Transcription
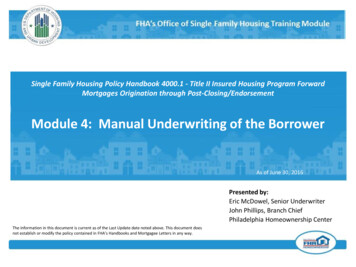
Relative Risk Tool Documentation - November 3, 201620163 November 2016RR Tool - Relative Risk Score CalculatorReport of the Society of ActuariesUnderwriting Criteria TeamTable of Contents1 Overview . 22 Limitations of the RR Tool. 33 Preferred risk program structure options . 44 Assumption development . 75 Logic . 95.1 General. 95.2 Determine the RR Scores and prevalences of all individual criteria based on Knock-out (K/O) . 105.2.1 Build special calculations . 135.2.2 “Treated” for Blood Pressure and Cholesterol . 135.3 RR Score and prevalence aggregations of all K/O based criteria qualifications . 145.4 Determine the RR Scores and prevalences of all individual criteria based on Debit-Credit (D/C) . 155.5 RR Score and prevalence aggregations of all D/C based criteria qualifications . 175.6 Converting D/C Points into Risk Class . 185.7 Combining the RR Scores and prevalences of the final K/O and D/C criteria . 195.8 Normalize the prevalences. 205.9 Combine the RR Scores and prevalences across all defined age ranges . 216 Validation of the Results . 227 Definition restrictions . 278 Members of the Underwriting Criteria Team . 2811 Bibliography . 29
3 November 2016RR Tool - Relative Risk Score CalculatorPage 2/291 OverviewPrinciples Based Reserving (PBR) is expected to be introduced in 2017. The 2017 CSO mortality table and theunderlying VBT experience table structures (beginning with the tables for 2015) were developed in conjunction withthis change in reserving approach. One of the main features of PBR is to allow the calculated reserves to be basedon actual experience, adding appropriate margins. To ensure risk equity in the U.S. life insurance markets, it hasbeen historically common to evaluate life insurance risks as either standard or substandard. The premiums onpolicies covering individuals with a higher substandard mortality risk are then assessed an additional surchargeconsistent with the higher mortality. To further improve the equity between premiums and risk, preferred RiskStructure programs became popular in the 1990s to more equitably stratify lives with standard mortality risks. Thisresulted in the introduction of fairly complex Preferred Risk Program structures to the individual life insurance market.These programs can vary significantly by life insurer writer.The Relative Risk Tool (RR Tool) provides a standard relative risk score (RR Score) which can be used to createreasonably appropriate reserves for each of the preferred classes in the many different types of programs. Thiscalculator is web based and available on the Society of Actuaries (SOA) website. This paper provides backgroundof the RR Tool, including a description of the logic, inputs and creation of the assumptions used to produce the RRScore output. The actual assumption tables are provided in a separate Excel file, named “RR Tool Assumption Tables– 2016-08-18.xlsx”. This file can be found on the SOA’s website.The RR Score provided by the RR Tool is an average industry estimate of the relative mortality of each of the riskclasses defined by the various preferred risk programs used by individual life insurers. The RR Score is based onassumptions built into the calculator. It can be used as a guide in deciding on the appropriate 2015 VBT relative risk(RR) table to use for each risk class for valuation purposes. The RR Score are more significant when a companydoes not have enough credible mortality to determine the RR Score relative mortality experience from its own portfolio.The range of risk class definitions used in the market is very broad. The calculator provides reasonable expectedrelationships based on the individual preferred risk underwriting program definitions. It determines RR Scores andprevalences of each risk class based on the structure of any life insurer’s specific preferred risk program. The RRTool includes logic for both knock-out and debit-credit qualification approaches, as well as those using a combinationof the two.The RR Score is the early duration mortality of a particular risk class relative to the overall average portfolio mortalityfor all non-substandard risks at the same gender, age, smoking status and duration. The prevalence is the proportionof all standard risks expected to qualify for the particular risk class, again at the same gender, age, smoking statusand duration.In a best estimate reserving environment, to the extent experience is credible, actual experience should dictate theunderlying assumptions, not the results of the RR Tool.The RR Scores of the RR Tool are a good overall industry average starting point for assumptions, in the same veinthat the VBT table is a good industry starting point for the overall mortality. Section 2 discusses the issue of industryand individual company results in more detail.Lastly, the use of the word standard must be interpreted very carefully in this document and in the industry in general.The highest mortality risk classes in a preferred program are sometimes called something like residual or residual
3 November 2016RR Tool - Relative Risk Score CalculatorPage 3/29standard. The use of the word standard in a preferred risk program can be confused with the term “standard” in astandard / substandard context. In the first stage of a risk evaluation process, lives are determined to be standard orsubstandard risks based on the evaluation of the circumstances of individual lives by underwriters. Only the risksdetermined to be “standard” qualify for a preferred risk programs. Therefore, all lives qualifying for that program are“standard” risks, regardless of the preferred class for which the individual qualifies. All of the preferred risk classes,whether super preferred, preferred, standard, or whatever other risk class names an insurer uses are standardunderwritten risks.2 Limitations of the RR ToolThe RR Tool is used to determine the RR Scores, which can be used to assist a carrier in the valuation process bydetermining the appropriate 2015 VBT RR tables for setting reserves for each or some risk classes.The results of the RR Tool represents an industry average of the mortality outcome of using the preferred risk concept.This is conceptually similar to how mortality tables represent overall industry experience. The actual risk classexperience will vary among many, if not most, life insurance carriers and from the results generated by the tool. Evenwhen comparing only overall portfolio mortality experience, there are significant differences. The credibility ofmortality experience of a single preferred class is even lower than for a carrier’s entire portfolio, resulting in an evenwider range of possible outcomes by class.In addition, experience differences by insurer occur for reasons other than credibility, including many which aresystematic. Some examples of reasons experience differ by insurer are:Assumption granularity: The assumptions have been developed from an average insurance portfolio. They do notvary by characteristics such as gender, age, smoking status, and therefore do not reflect the granularity required fora pricing exercise. The inputs to the calculator use the above mentioned characteristics only to reflect differencesbased on those characteristics in the preferred risk criteria.Logic limitations: The formulas used to calculate the impact of the interaction among the criteria are reasonable,but based only on broad industry assumptions. Also, there could be actual overlaps of the impact of both the relativerisks and prevalences among many of the criteria. However, the formulas assume completely independentrelationships.Company specific attributes: The results are based on life insurance industry overall average experience. Theactual experience for individual carriers could deviate from the calculated values. Differences can be due to a widevariety of different factors.There are many factors and conditions not reflected in the calculator which will impact individual companiesexperience uniquely. A non-comprehensive list includes items such as: Target market, Distribution methods, Company underwriting and claims standard practices, Company ad hoc business exceptions, and
3 November 2016RR Tool - Relative Risk Score CalculatorPage 4/29 Inclusion of non-standard risk criteria used in some preferred risk programs.Companies use various smoker definitions. Definitions usually vary in two aspects: Cigarette smokers only disqualify vs. any nicotine use disqualifies, and The minimum number of years the individual has not smoked or used tobacco before qualifying for the nontobacco class.Although the tool includes inputs for tobacco definition, it is not reflected in this version of the tool.Preferred risk program structures: The calculator is designed to reflect most, but not all, common preferred riskstructures. Some companies may use criteria not included in the RR Tool. The program includes logic for debit-creditapproaches using formulas where the impact is measured by adding or subtracting points. However, it is quitepossible that other approaches could be devised. Structures which allow occasional cigar smokers to qualify for nonsmoker classes are not supported. Exception offset qualifications used in some knock-out programs are notsupported. The definitions of some types of restrictions (e.g. – aviation, avocation) vary by insurer. The varying impactof the different definitions are not explicitly recognized. Lastly, the calculator does not reflect potential insuranceapplicant self-selection impacts in highly competitive markets. In a market with multiple preferred risk programs, eachwith a different qualification structure, the applicant will tend to choose policies from programs more advantageousto their particular situation.Data sources used to create assumptions: The main data sources used to create the underlying assumptionscome from “Applied for” policies. Reserves however, are calculated on issued policies. This could create biases forwhich it is not currently possible to adjust. If “Not taken” rates are biased, the mortality risk distribution of the portfolioof policies applied for would be different than that of policies issued. It is quite possible that the “not taken” rates forpolicies at the higher end of “standard underwritten” mortality risks will be higher than policies with the lower mortalityrisks. It would be useful to study this behavior for future versions of the calculator.3 Preferred risk program structure optionsPreferred risk programs have several structure dimensions:Number of risk classes: The calculator allows a single program to have up to six non-smoker and six smokerclasses. When this document refers to the number of classes, it includes the standard/residual class as one of theclasses. As well, the number of classes is always counted separately for non-smokers and smokers.Qualification scoring method: Scores for both knock-out (K/O) and debit-credit (D/C) preferred underwritingapproaches are calculated consistently. Calculations for programs which use a mix of K/O and D/C qualifications canalso be handled.Qualification categories: The list of available qualification categories is provided in Table 1 below. Family history,personal history and Other categories allow for up to two additional categories.
3 November 2016RR Tool - Relative Risk Score CalculatorPage 5/29Qualification category limit values: Table 1 shows the risk class measurement types and the range of possibleminimum and maximum values that a program may use for qualification limits.Measurement types: This column indicates the types of information used to define the qualification standards ofeach criterion.Industry standard minimum / maximum values: This column defines the industry normal range of risk classqualification values which would not disqualify a life to be a “standard underwritten” risk. If the specific program hasoverall program (not individual preferred risk class) minimum and maximum values equal to those shown in thiscolumn, the cumulative weighted RR Scores is equal to 100%, and the combined prevalence of all classes is equalto 100%. If the overall program minimum or maximum (combined minimums and maximums of all risk classescombined) does not equal these industry standard values, the average RR Score across all preferred risk classescould be greater or less than 100%. An example of this is shown in the Build example below in Section 5.8.Although this committee included actuaries, underwriters and medical directors, the “industry standard” values weredetermined somewhat subjectively and certainly will have a range of opinions as to their appropriateness. Thesedefinitions are worth revisiting in the future.Assumption table minimum / maximum values: This column provides the range of possible program qualificationlevels for which relative risks and prevalences are included in the calculator’s assumption tables. Risk class restrictionlimits are restricted to the values shown in the “Assumption table minimum/maximum values” column. Values outsidethis range will have no impact on the calculation results. For example, if the Build program minimum value indicatedis a BMI of 42, the RR Tool resets it to a value of 40 (the assumption table minimum BMI value for Build shown inthe table below). Choosing overall program limiting criteria restriction values more liberal than the industry standardvalues will increase the overall mortality of the program. Stricter restrictions will decrease the overall mortality of theprogram.Table 1: Preferred risk criteria qualification typesRisk CriteriaMeasurement typesBlood pressure – diastolic(DBP)DBP values (beingtreated for high BP andnot under treatment)SBP values (being treatedfor high BP and not undertreatment)Body Mass Index (BMI) orequivalent height/weightCR value (being treatedfor high cholesterol levelsand not under treatment)Total cholesterol value(being treated for highcholesterol levels and notunder treatment)Blood pressure – systolic(SBP)BuildCholesterol ratio (CR)Cholesterol total (TC)Industry standardminimum / maximumvalues{55/95}Assumption tableminimum / 4.1/40.0}{2.0/9.0}{2.0/10.0}{131/275}{110/290}
3 November 2016RR Tool - Relative Risk Score CalculatorPage 6/29Risk CriteriaMeasurement typesDriving record (Movingviolations)Maximum number ofviolations forgivenNo. of years recordreviewedFlat extra ratings allowedMaximum number ofviolations forgivenNo. of years recordreviewedFlat extra ratings allowedEvent definition: deathonly or death/disabilityFamily relationshipsconsideredDriving record (Drivingunder influence /Reckless driving)Family medical history(FamHx) - Cancer,cerebrovascular,coronary, diabetes,additional; all separatelyPersonal medical history(PerHx) - Cancer,cerebrovascular,coronary, diabetes,mental/nervous,additional; all separatelySubstance abuse –alcoholSubstance abuse – drugsOther restrictions(Aviation, avocation,citizenship, foreign travel,occupation, residency,additional; all separately)Maximum no. of eventsforgivenMaximum age at time ofonset of condition forevent to be consideredNo of additionalconditions (only for“FamHx additionalconditions”)Description (description ofadditional conditionsRestriction definitionNo of additionalconditions (only for“PerHx additionalconditions”)Description (description ofadditional conditionsNo. of years of recordreviewedNo. of years of recordreviewedRestriction usedNo of additionalconditions (only for “Otheradditional conditions”)Description (of additionalconditions only)Industry standardminimum / maximumvalues{0-3}Assumption tableminimum / maximumvalues{0-3}{1-5}{1-5}Yes, No1 when 10 years ago, 0when within last 9 years{1-10, 11 }Yes, No{0-3}{0-10,11 }Yes, NoDeath / Death or disabilityYes, NoDeath / Death or 0-2}{50, 55, 60, 65, 70}{50, 55, 60, 65, 70}{0}{0, 1 ,2}For documentation onlyFor documentation onlyNo history of disease, Noratable disease, No net(dr-cr) ratable disease,Ratings allowed{0}No history, No ratabledisease, No net (dr-cr)ratable disease, Ratingsallowed{0, 1 ,2}For documentation onlyFor documentation only{7-20}{1-20 }{5-20 }{1-20 }Yes / No{0}Yes / No{0, 1 ,2}For documentation onlyFor documentation only
3 November 2016RR Tool - Relative Risk Score CalculatorPage 7/29A clarification is needed to table 1 above:Personal Medical History options:“No history of disease” indicates that the insured has never had the disease.“No ratable disease” indicates that the insured may have or have had the disease, but not to the level of requiring atable or flat extra rating. This disease would result in a disqualification for eligibility in the risk class in a K/O structureor in the assessment of the allocated points in a D/C preferred structure.“No net (dr-cr) ratable disease” is a slight variant of the “No ratable disease” standard. The insured who has had thedisease would be disqualified only if there is a presence of any net positive debits minus credits in the underwritingreview process. In other words, underwriting credits are allowed as offsets to any assessed debits.“Ratings allowed” indicates that the insured would not be disqualified if ratings are assessed on the policy.4 Assumption developmentRelative risk and prevalence assumptions were developed for each preferred risk evaluation criterion. They wereconstructed from several sources as shown in Table 2 and explained in the paragraphs immediately below. Sincesubstandard risks are not eligible for preferred programs, the impacts of substandard risks were excluded to theextent possible. The base assumptions represent only standard risks. The assumption table contains values ofcertain criteria beyond normal industry standards for situations when a particular carrier has liberal standards indetermining whether a risk is substandard. The impact of substandard risks not due to the specific risk evaluationcriterion are not i
Report of the Society of Actuaries Underwriting Criteria Team . These programs can vary significantly by life insurer writer. The Relative Risk Tool (RR Tool) provides a standard relative risk score (RR Score) which can be used to create . The RR Score is the early duration mortali
