Transcription
Under no circumstances does the information in this document represent a recommendation tobuy or sell stocks or funds. It should not be assumed that the methods presented in this letter willbe profitable or that they will not result in losses. Past results are not necessarily indicative offuture results. This document is for educational and entertainment purposes only.-Once per year, I invite new investors to join me in World40. Now is the time.-The 2018 holiday promotion is 6,900 for 12 month membership. Membership is discounted thisyear from the usual 10,000 as I plan to take 6 weeks off during the summer to trek in Nepal.-New streamlined and simplified approach to Superstocks to benefit investors with full-time jobs.-Could be best time ever to join due to market opportunities and price point.-If you’d like to learn the ropes and work with me in 2019 and want to receive more information,please email me at worldforty@gmail.com with subject “W40 info.” .
“If you’re holding cash, you’re going to feel pretty stupid.”-Ray Dalio 1/23/1812/23/18
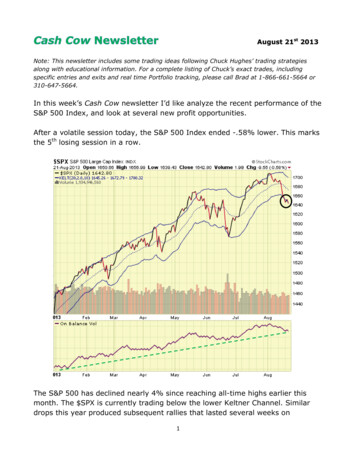
Merry Christmas Friends and Family!Despite the current market shenanigans, I hope this letter finds you happy and healthy during thisholiday season. This year, I write to you again from Bali, Indonesia where I plan to spendChristmas and New Year’s. If I get a little adventurous, perhaps I’ll make a trip to the Gili Islandsfor some holiday R R under a coconut tree. Fingers crossed that this will be the first year that Idon’t become deathly ill here.In any event, you know the drill by now. Most market forecasts are the result of looking at a chartof the S P 500 for 5 minutes, glancing at the recent past and speculating that the current trendwill continue indefinitely into the future. The name for this is Recency bias.In my opinion, far more important than looking at a single popular index (SPX) is to look into theentire global landscape and prevailing social mood. The essential key to investing is emotionalintelligence and the ability to sense the emotions of those around you (your market competitors).If I was lazy and HAD to look at just one index, I’d look at the NYSE which represents 2,800stocks vs. 500 in the SPX.OR .better yet, the Total World ETF VT .
MARKET CYCLESThe market goes up, the market goes down. Almost as predictably as the tides. Yet, us irrationalhumans continue to be totally shocked every time the tide goes out. In the current market, the timeto worry and to get defensive was several months ago as dozens of indicators rang alarm bells. Ilisted some of the significant warning signs in the “Trump Top” hjMTwNydYhxRuzjQrI08r50VbobjzOhBnCOU/edit?usp sharingUnlike what we saw last year at this time, heading into a new year, you want future expectationsto be as low as possible. We’ve definitely got that now.
As I wrote in a client note four months ago: .“I for one would welcome a market collapse with open arms as my biggest trades by alongshot have taken place during the recovery phase after market collapses.”THE CURRENT LANDSCAPE:1) ALL-TIME low dumb money sentiment extremes triggered Friday.2) 38 percent of equities on the Nasdaq and NYSE are trading at 52-week lows, numbers notseen since the 2008 lows and the Crash of 1987.3) All-TIME high retail stock liquidations.4) 12 month sustained global meltdown.5) Smart money bullishness- after becoming EXTREMELY bearish a few months ago at 32% andestablishing a record short position, the smart money is now near multi-year year highs at 74%bullish.6) Indexes approaching long-term oversold conditions.7) S P PE ratio now at 2012 levels.8) Average market decline during a bear market is 25%.and 33% during a recessionHERE ARE SOME QUESTIONS WE’LL TRY TO ANSWER
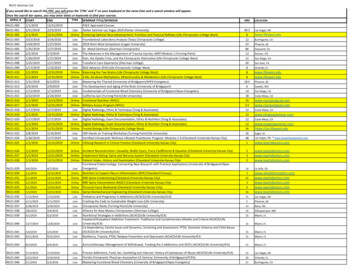
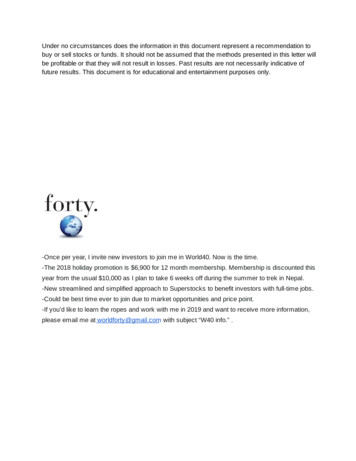
9) What tends to happen after EVERY asset class is down for the year?10) How does the U.S. dollar look today? Do hedge funds love it?.11) What are the global monthly bands saying?12) What happens after record small cap annihilation? (Hint- The russell 2000 averages 15%annual return after 20% pullbacks 13) Equity risk premium reaches historic extremes.14) What tends to happen after one of the worst quarters in history?Let’s first take a step back and look at the market landscape heading into 2018. Here’s what Isaid one year ago in my 2018 annual forecast titled “Blocksanity”:“Retail investors (dumb money) are about as bullish as they’ve ever been, and our good friends atour favorite investment banks are telling us to buy stocks hand-over-fist because of the tax cut .I hope you’re enjoying the action.Times like these do NOT last forever. .Frankly, for the first time in many years, I havevery little idea where the market will head in 2018. In any given year, there areusually a fair number of low-risk entries globally. I really can’t find anythingwith favorably skewed risk/reward this year.My view is that 2018 will truly be a “Stock-Picker’s” market. I DO expect a TON morevolatility in 2018.Many people feel that we are in another .COM boom. However, many fail to realizejust how big the declines are during a “vertical market”.
Here’s a chart of the NASDAQ during the .COM boom. Annual 20%-30%gut-wrenching pullbacks were the norm. A 20%-30% market pullback equates to50% pullbacks for the very best performing stocks.”Heading into 2018, here was the Dow vs. its long-term 200 month moving average.
SENTIMENTSentiment is EVERYTHING.
The most reliable indicator of future returns is current sentiment. Horrible current retail (dumbmoney) sentiment is usually indicative of much better than average future returns. Conversely,euphoric dumb money current sentiment is indicative of much worse than average future returns.Here’s a look at the sentiment heading into 2018:All-time high bullishness in the Investor’s Intelligence survey.Active investment manager equity exposure hit an all-time high.ABOVE 100%!
Ned Davis crowd sentiment hit an all-time high.
Consumer confidence data showed a record % of people expecting higher stock prices.Mom and Pop traders at retail trading brokerages were “ALL-IN”. No cash on the sidelines.3/13/18“Snoop Dogg just closed on a 45 million venture fund, in case you wanted to know which part ofthe cycle we're in.” -@Reformed broker
The entire planet piled into Amazon and Apple in August taking the market behemoths parabolicresulting in TRILLION dollar market caps. As a kid, I remember often thinking that trillion wasimpossible. I thought that there could never be a trillion of anything. To me, the idea of trillion wassimply incomprehensible.
And as fate would have it, that same day, sentiment hit a crescendo and the NASDAQ peaked.Here was my market commentary that day:8/30/18
Social media financial entertainers and TV entertainers:“Focus on good news”.
As sentiment went wild in the States, our sister market over in Germany was trying to give us aheads up.9/7Despite the warning signs, dumb money sentiment continued to rage .9/9
And then another retail sentiment extreme rang during the replay of “Long Island Iced Tea Top”.9/22Smart money sentiment finally reached an extreme on September 29th.9/29
Despite the euphoric sentiment, there was a TON of selling below the surface. AAPL and AMZNwere holding up the major averages while institutions were unloading everything else. In a“stable” market, breadth was perhaps the worst I’ve ever seen.
Then we got our next sentiment extreme earlier this month when the Trump-Xi G20 love affairwas promoted to the masses. “EPIC SANTA CLAUS RALLY!”12/3/18Of course, institutions tend to buy in anticipation of big events (G20), and then “Sell the news”hand over fist.
In the last two Friends and Family letters I said there was a good chance that IWN (small capvalue ETF) would at least trade up to its 50 day moving average. It ultimately did, but the actiongetting there was PATHETIC.
2019“Scars remind us of where we have been, not where we are going.”@kpaxsLet’s now have a look at 2019 and where the market stands .GLOBAL MARKETSPundits continue to say that we are “starting” a bear market. I tend to disagree. Global marketshave been pricing in a global slowdown since the January euphoria.
Oil is ALREADY down 40%.The German DAX is ALREADY down 30% after giving warning signs several months ago.
Lumber could be argued as being a leading economic indicator. It has ALREADY collapsed over50%.AAPL is ALREADY down 35%. AMZN is ALREADY down 34%. Facebook is ALREADY down42%. Netflix is ALREADY down 42%. NVDA is ALREADY down 58%.
As of a few sessions ago before the most recent collapse, IBM was down 32%, Dupont 33%,Citibank 32%, Wells Fargo 29%, Bank of America 26%, AIG 36%, Goldman 33%, Deutche Bank59%, Credit Suisse 40%, BNP 40%, ING 40% and I won’t even go into energy stocks which havebeen totally destroyed and left for dead.This was the entire global landscape a few sessions ago before the most recent carnage:
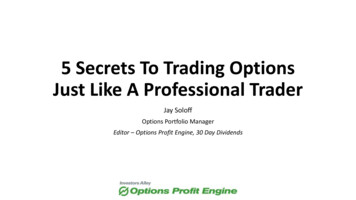
3-4 MONTH WINDOWSHistorically, massive selling sprees tend to be confined to 3-4 month windows before a significantbounce ensues. Here’s what the S P has done following horrific quarters. (I think S P is nowdown 21% or 22%).
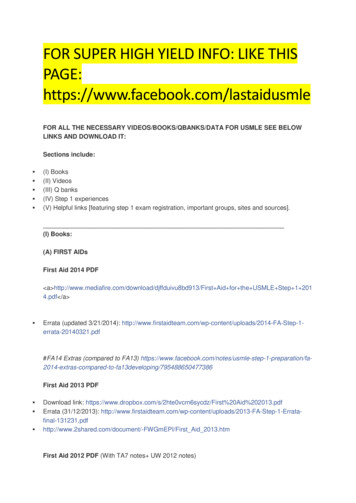
SMALL CAPSLooking at small caps specifically, we can see that this might be the largest exodus inhistory. Since my bread and butter is in the small cap arena, I salivate when I see thischart. Note that prior meltdowns usually lasted 3-4 months before a rally. Also notehow small caps performed during the .COM collapse of 2000-2002. Aside from acouple downdrafts, they actually held up quite well compared to tech.
WHAT HAPPENS AFTER A BAD YEAR?Historically, bad years tend to be “one and done”. If we exclude '73/'74 and the .COM fiasco,since 1942, here are the S P returns the year AFTER an S P return of 2.1% or less:4%, 5%, 7%, 12%, 12%, 16%, 20%, 23%, 24%, 27%, 27%, 31%, 38%, 44%, 53%.Every single asset class has been down this year. Equities, treasuries, high yield,gold, investment grade corporates, small caps, international equities, U.S. bonds, realestate, commodities etc.For all asset classes, I believe it’s the worst year on record. But historically, look whathappens the year following dreadful performance from all asset classes .
EARNINGSS P earnings are projected to climb 27% for 2018. Since the start of the year, the S P PE ratiohas moved from 21.4 to 15.6- which is now at or below 2012 levels.In addition to the PE ratio, current investor sentiment is somewhat similar to how it was in 2012.For those who have read my book, you’ll recall what I said about sentiment in 2012:“People think I’m crazy for releasing the book now. They say that books needto be released during periods of heightened social mood and market frenzy. I disagree. I believethat for the benefit of the reader, those are the worst possible times to release a book. My beliefis that the best time to read a book of this nature is during universal pessimism. It is my hopethat readers will be able to utilize what they have learned in these pages to eventually crush themarket when social mood begins to turn (if not well before).Look, we have massive unemployment, trillion dollar government bailouts, the “OccupyWall Street” movement, the “Fiscal Cliff,” the multi-trillion dollar U.S. debt bubble, the “2012”end of civilization, the crash in China’s economy, the debacle in Greece, Spain, Ireland, Portugal,Italy etc., the “end of the European Union,” the “end of the Euro currency,” economists calling foran imminent recession, and Goldman Sachs call for a possible 25% drop in the S P 500.Did I mention that there are about 10 countries today in the Middle East that are threatening totake down the entire planet? The media couldn’t build a higher “Wall of Worry” if it tried.As you will see, the largest market advances in history happened when we least expected
them to happen. The largest market advances happen in spite of the prevailing Wall of Worry(negative groupthink). In short, market advances NEED a gigantic wall of worry to keep asmany people as possible on the sidelines. ““Insider Buy Superstocks”, p.16IPO’sThere are MASSIVE IPO’s in the pipeline for 2019. Typically, investment banks try to time megaIPO’s to come out during favorable market conditions.On deck is Slack ( 7 billion), Instacart ( 7.6 billion), Lyft ( 15 billion), Palantir ( 40 billion), Airbnb( 60 billion), and Uber ( 120 -expected-in-2019.html
YIELD CURVE INVERSION?
“THE GREATEST WEEK OF REDEMPTIONS IN HISTORY”Over the last 2 weeks, roughly 80 billion has been pulled out of equity funds. In the first week, atotal of 0.44% of all assets were withdrawn. The prior one week record was 0.39% in mid Augustof 2011.
Additionally, safe-haven money market funds pulled in 81 billion the first week (I don’t have dataon the 2nd week), also the most ever recorded.Here’s what happened after the previous record level of redemptions.Here’s a chart of the average fund flows over the previous 4 weeks. The average annual gainAFTER similar readings in the past was 25%.
Additionally, 174 hedge funds were liquidated in Q3 this year (during a tame market). We’ll seethis exodus rocket higher in investors-jplw0j14Whenever we see that there are a large number of hedge funds piled into the same trade, thattrade ultimately fails in spectacular fashion. Here’s the newest popular hedge fund trade .
As an aside, if I’m a hedge fund or institution, do I want to show investors that I have crappystocks (every stock is down) on my books at year end?“EQUITY RISK PREMIUM”According to Sentimentrader.com, the S&P’s earnings yield has jumped to nearly 6%. Thecomparison between bond yields and stock yields is often referred to as an Equity Risk Premium(ERP), the amount that investors are willing to pay for earnings above/below the yield on bonds.When the ERP Z-score reaches extremes of 2 or above like we saw one yearago, the average annual S P return is -4%.When the Z-score reaches extremes of -2 or below, the average annual S Preturn is 40%.
SENTIMENT CHARTSObviously, the primary theme of this year’s letter is sentiment. One year ago, dumb moneybullishness reached extremes of 77% during much of December and January.At the February bottom, dumb money bullishness hit a low of 27%.As of yesterday’s close, dumb money bullishness spiked down to an all-time low of just 12%while smart money bullishness stands at 75%, just shy of a year high.According to Sentimentrader.com, “When Ma & Pa have gotten this despondent, tech stocksrallied an average of 29% over the next year.”
According to Fundstrat Global Advisors,“We believe sentiment has reached an extreme bearish level that historically is a major contrarianbuy signal," Tom Lee, managing partner at Fundstrat Global Advisors, wrote in a note to clientson Monday morning, adding that the rate at which investors had grown bearish has moved "farforward of fundamentals."Specifically, Lee and his team point to the Purchasing Managers' Index (PMI) being at a healthy59, suggesting a sound fundamental backdrop."And the data analysis shows when AAII is this bad and PMIs (Purchasing Manager’s Index) are 51, equity return risk/reward is especially impressive . last time this was seen was August 27,2010, right before a massive rally."As we entered 2018, Investor’s Intelligence sentiment was in the top 5% of all readings- whichhas historically resulted in an average annual return of -1.6%. When their readings are in thebottom 5% as they are currently, average annual returns are 10.9%.
Currently, Nasdaq newsletter writers bullishness is lower than 98% of all readings since 2000 asthey recommend a 55% short position (vs. 92% long at the top) on average.
And again, the year 2012 comes up again. Global sentiment is LOW.
INTERESTING STAT-“Since ‘84, (Excluding ‘08), when over 25% of NYSE and NASDAQ stocks are at a 52 week low, theS P returns the following 12 months were:-9.5%, 15.5%,17.9%, 18%, 19.6%, 20.6%, 21.1%, 21.7%, 22.9%, 24%, 25.2%, 26.1%, 27.4%, 29.1%,29.3%, 31.5%, 33.9%, 37.9%, 39.2%, and 66.6%.”-Sentimentrader.comSMALL CAPS
SMALL CAP VALUE ETF MONTHLY
This note caught my attention a couple of days ago from Kuppy over at the Adventures inCapitalism blog:“I’ve been involved in this sector (small caps) for nearly two decades. I can only thinkof two other times where I have seen so much pain and frustration amongst my smallcap friends. That would be the 2008 to 2009 period and to a lesser extent during thefirst few months of 2016 .You are witnessing a massive culling of the hedge fund industry as hundreds of fundsare liquidated and thousands more get sizable redemptions .As a result, you are seeingwaves of forced sell orders and few buyers. It is creating rather insane bargains allaround .If your fund is facing a year-end redemption, you need cash in hand by December 31and you probably finish selling a few days before then. Therefore, at most, there’s 9 ½days left to make sales .What I suspect, is that the pain will finally abate in two weeks. Or at least the forcedselling pain will be done. If you look at Q4, despite only a small drop in the S&P, it hasbeen one of the most painful that my friends or I can remember. There are lots of guysdown 20% to 30% this quarter and suddenly forced to de-lever further, to get their riskratios in order. This sort of pain and indiscriminate selling creates lots ofopportunities .Despite my bearishness, I have been putting capital back to work over the past twoweeks. Many of the companies that I am buying are down more than half thisyear—some are down a whole lot more. It’s the most exciting opportunity I’ve seensince 2016 I suspect that even if the overall market is down dramatically during 2019, the bargainsof late 2018 will shine given their current valuations—especially as many institutebuybacks to soak up the newly freed up shares hitting the market. Christmas has comeearly once again—at least in the stock market—I might as well take advantage of hedgefund 18/12/16/hedge-fund-armageddon/
MONTHLY CHARTSHere are a slew of global monthly charts that have grabbed my attention. Note how many are attheir lower monthly Bollinger Bands as we enter 2019. Interesting stuff .EMERGING MARKETS
SOUTH KOREASINGAPORE
ALL CHINA ETFFINANCIALSINDIAN SMALL CAPS
WORLD’S LARGEST COMMODITY PRODUCER GLENCOREPOLAND
SOCIAL MEDIA ETF
CHINA INTERNET ETFITALYSPAIN
GREECECHINA Q’s
BIOTECH CLINICAL TRIALS ETF
S P BIOTECHGASOLINEIBD 50 ETF
JAPANHONG KONG
CASINO STOCKS
WYNNGOLD
SILVER (Tight monthly closes:))
STEELOILMICROCAPS
INVERSE VIXTRANSPORTS
NYSEGLOBAL 100 ETF
HIGH BETA STOCKSSEMICONDUCTORS. (Not quite there yet).
CURRENCIESDumb money hedge funds all piled into “FANGS”. Hedge Funds are now going belly up. Theirnext groupthink “great trade” is the U.S. dollar. OOPS!.
Time for S P earnings to accelerate due to a drop in the dollar?We could see some sort of “favorable” resolution for “Brexit” coming out of left field .
MONTHLY RSI CHARTS OF INTERESTTotal World ETFNYSE
AMAZON
APPLE
40 MONTH MOVING AVERAGE CHARTSWILSHIRE 5000S P
AAPL sucks. BUT, it might be due for a big mean-reversion rally.Same story with NVDA
Semiconductors are not quite there yet.THE # OF STOCKS ABOVE THEIR 50 DAY MOVING AVERAGE HAS PLUMMETED.
For tax loss plays, I’d probably look at financials and energy. For instance, natural gas producerswill be making great EPS in ‘19 at current strip prices. They have sold off DRAMATICALLY dueto the decline in the energy sector. Not a stock that I’d buy, but insiders in CHK have been buyingsh
-New streamlined and simplified approach to Superstocks to benefit investors with full-time jobs. -Could be best time ever to join due to market opportunities and price point. -If you’d like to learn the ropes and work with me in 2019 and want to receive more information, please em