Transcription
Qlik Architecture & TechnologySee the whole story in your dataMarcel van LaarhovenSolution Architect
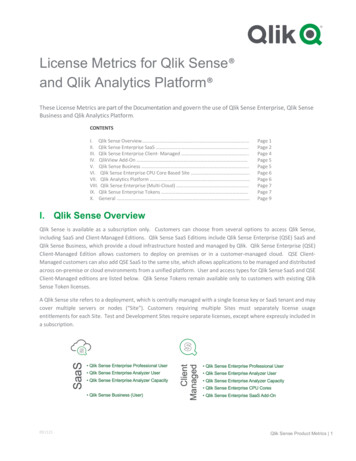
Visualization alone isn’t the answerThere is a broad spectrum of needs and analytics use cases acrossany business, all of which are importantautomatedpre ticappspreparationdata acquisitionhigh performancedatabasescollaborationand sharingembeddedanalyticsSource: “The Digital Universe of Opportunities: Rich Data and the Increasing Value of the Internet of Things” – April 2014
Why our approach is uniqueA visual analytics platformSee the whole story that lives within your dataInnovative associative model enables users to probe all the possibleassociations that exist in their data, across all data sources, to answer not just“What happened?”, but “Why?”, and “What is likely to happen?”
See the whole story that lives within your dataITLoBGroups
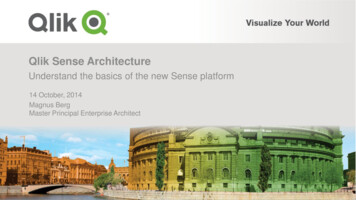
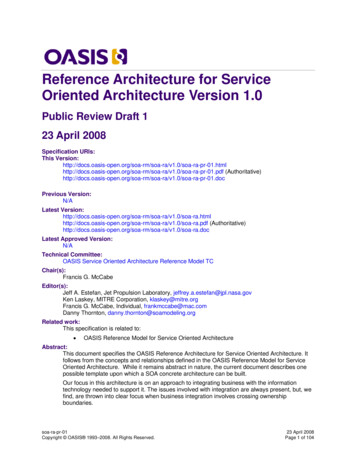
See the whole story that lives within your dataExample: Tell us all of the patients who had a hip replacement that cost more than 10,000; the surgeons that treatedthose patients that have used different prosthetics for those hip replacements Linear data visualizationAssociative visual analyticsversusResult of the partial story: You reducethe number of operationsResult of the whole story: You increase effectivenessof procedures to maintain the number of operations
Why our approach is uniqueA visual analytics platformSee the whole story that lives within your dataInnovative associative model enables users to probe all the possibleassociations that exist in their data, across all data sources, to answer not just“What happened?”, but “Why?”, and “What is likely to happen?”A platform for all your visual analytics needsMore than a tool, Qlik’s platform approach enables centrally deployed guidedanalytics, self-service data visualization, embedded and custom built analytics,collaboration and reporting
Qlik’s modern BI portfolioServicesValue ndationQIX Associative EngineEcosystem
Qlik platform-enabled visual analyticsQlik Sense EnterpriseSelf-service ustom analyticsapplicationsReporting andcollaborationDecentralized analysisand exploration forindividuals and groupsCentrally deployed guidedanalytics to multipleknowledge workersAnalytics embedded inweb and enterpriseapplicationsCustom-built analyticsapplications for internaland external usePixel-perfect reportdistribution across theenterpriseQlikView Qlik Analytics PlatformQlikView NPrinting
Qlik Analytics Platform
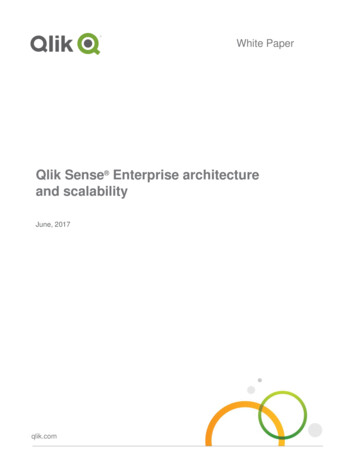
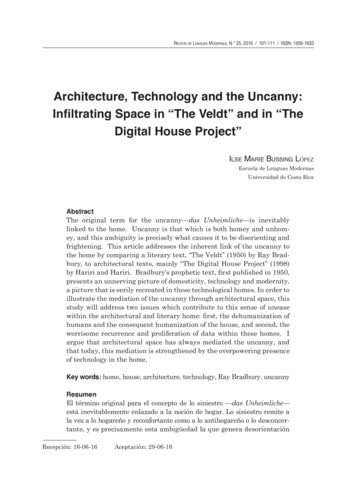
Qlik platform-enabled visual analyticsQlik Sense EnterpriseSelf-service ustom analyticsapplicationsReporting andcollaborationDecentralized analysisand exploration forindividuals and groupsCentrally deployed guidedanalytics to multipleknowledge workersAnalytics embedded inweb and enterpriseapplicationsCustom-built analyticsapplications for internaland external usePixel-perfect reportdistribution across theenterpriseQlik Analytics PlatformBy using the Qlik Analytics Platform, customers and partners can seamlessly embed Qlik’s powerful visual analyticscapabilities, powered by the QIX engine and visualizations, right into their applications by using modern and open API’s.
Introducing Qlik Analytics PlatformWith Qlik’s patented Associative Data Indexing technology at its core, Qlik Analytics Platformdelivers capabilities for: Delighting Developers Embed visual analytics anywhere Direct access to QIX engine Modern and open APIs Delivering for OEM Beautiful visualizations Deliver maximum value to your customers Licensing to match any useA platform for the enterprise Extend with governance Analytics in your workflow appsEngage your partner and customer communities12
Use-case – Embedded Analytics Easily embed apps, sheets and visualizations in a widerange of environment, for example: Portals Web applications Intranet and Extranet sitesQlik Analytics Platform provides a number of JavaScriptbased APIs for embedding Qlik Sense content: Single Integration API for iFrame integration Capability APIs for embedding objects in webpages Backend API for communicating with the backendof Qlik Sense13
Use-case – Custom Analytics Integrate visual analytics with great flexibility in your ownsoftware. It can, for example, be integrated as a: Windows application Web-based applicationQlik Analytics Platform provides client side integrationcapabilities through open, standard APIs for: Visualization extension for enabling new waysof visualizing data and enhance user input andinteraction. Mashups for creating new applications to meetunique business requirements. Single Integration to integrate singlevisualizations, sheets or snapshots into an iframe.14
Integration15
Demo
ExtensionsCreate your own visualization type andexpand the capabilities of your QlikPlatform.Integration is just an upload to the serverin order to use it at the frontend andinside your applications.Templates are available to speed up yourdevelopment process.Share or use an extension on / fromhttp://branch.qlik.com.This is working with standard WebTechnology CSS3, HTML5 andJavaScript.17
Use Existing Libraries18
Demo
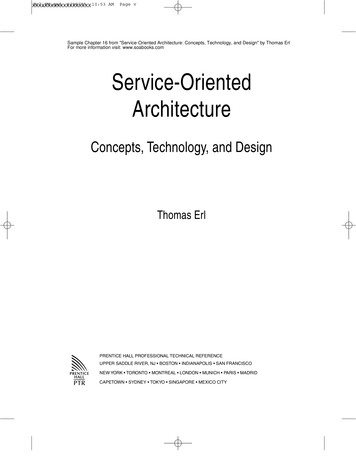
What is Qlik Analytics PlatformQlik Sense Qlik Analytics Platform vs Qlik Sense EnterpriseSelf-service Drag/DropCreationStorytellingSmart DataLoadQlik Chart ManagementLibrary& SecurityAPIsQIX EngineUser Access HubQlik Analytics PlatformQlik Sense EnterprisePart of the Qlik Sense family of products, the Qlik Analytics Platform puts the power of the QIXassociative data indexing engine and visualizations in the hands of application developers throughpowerful, open and modern API’s, allowing you to see the whole story within your data.20
Why our approach is uniqueA visual analytics platformSee the whole story that lives within your dataInnovative associative model enables users to probe all the possibleassociations that exist in their data, across all data sources, to answer not just“What happened?”, but “Why?”, and “What is likely to happen?”A platform for all your visual analytics needsMore than a tool, Qlik’s platform approach enables centrally deployed guidedanalytics, self-service data visualization, embedded and custom built analytics,collaboration and reportingAgility for the business user, with trust and scale for ITSupport the business and IT; Data sourcing and preparation, visualization andanalytics, collaboration and reporting all within a governed framework
Qlik platform-enabled visual analyticsQlik Sense EnterpriseSelf-service ustom analyticsapplicationsReporting andcollaborationDecentralized analysisand exploration forindividuals and groupsCentrally deployed guidedanalytics to multipleknowledge workersAnalytics embedded inweb and enterpriseapplicationsCustom-built analyticsapplications for internaland external usePixel-perfect reportdistribution across theenterpriseQlik Analytics Platform
Governed Self-Service
Dividing the workWhen using Self Service BI, you choose who can do what and what level offreedom users get. No longer IT delivers and Business consumesITBusiness Users Manage data load process (ETL) Read dashboard (Display only) Ensure calculations are correct (Definition ofmeasures) Modify for own use, create new visualizations, reuse what governed functionality is provided. Database connections Modify for own use, create new measures and use allfields. Folder connections Scheduling tasks Server management Security configuration Publish your new creations to the communitywithout IT involvement. Share your findings, discovered in the data. (Createstories) Create new dashboards from scratch from internal orexternal sources.
Guided Analytics & Self-ServiceIn order to make sure each user reaches their level of self-service,roles can be applied providing each user the correct capabilities.IT orTechnicalAnalystIT orTechnicalAnalyst3. rsSubject Matter Experts
ConsumeUsersConsumption patternsPersonalizeUsers Users consume visualization apps to quicklyanswer the next question. User personalize their own visualizationsleveraging pre-built libraries. User build, extend, and publish contentleveraging pre-built libraries.ExtendUsersPublishConsumeUsers
ConsumeConsumer / business userAdding user rolesExtendContributor Business-Users: Consume visualizationapps to quickly answer the next question. Contributor: extends the application withvisualizations, sheets and data stories incl.publish. Developer: builds applications, models andprepares data for other users. Admin: administrates all apps for a certaindepartment (stream).BuildDeveloperDepartment Admin
Demo?
Qlik platform-enabled visual analyticsQlik Sense EnterpriseSelf-service ustom analyticsapplicationsReporting andcollaborationDecentralized analysisand exploration forindividuals and groupsCentrally deployed guidedanalytics to multipleknowledge workersAnalytics embedded inweb and enterpriseapplicationsCustom-built analyticsapplications for internaland external usePixel-perfect reportdistribution across theenterpriseQlikView
Deploying the portfolio
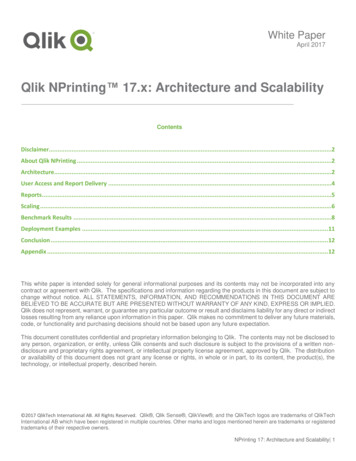
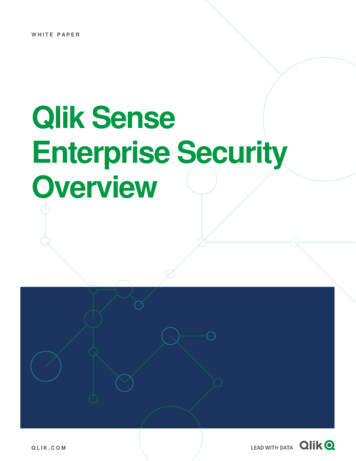
How do they work together?Qlik Sense deployments are able to share and reuse much of the valuebuilt within QlikView QlikViewQlik Sense60-80%of the effort associated withmost BI projects is relatedto data & expression logicand is therefore reusable!UIUILibraryExpressionsModelEngineSame expression logicSame data logicSame engine technologyExpressionsModelEngineReusable Data LayerQlik Data Layer31
UsersSelf-Service VisualizationGuided AnalyticsCommon platformData models Re-use of QlikView Data Architecture: Re-use data layer (QVD) Re-use existing data models & complex business logic Automatic publishing to both systemsDeveloper Single point of Truth & Maintenance Multiple use cases: Self-service visualizationOperational Data sources Guided Analytics
Coexistence: Different Solutions by DepartmentHRITSales &MarketingCentrally Managed Data Layer
Coexistence: Different Solutions by Application
Qlik Supported cases 1 physical machineQlikView & Qlik Sense runningon the same server. 1 physical machineQlikView & Qlik Sense runningon separate virtual servers 2 physical machinesQlikView & Qlik Sense runningon different machinesWindows Host Ports will be used twice Not recommended unsupportedHostHostvirtual environmentunsupportedsupportedHostHostsupported35
User experience
Single Portal
Navigating between QlikView & Qlik Sense
experience it for yourselfCreate an appQlik.com/downloadTry an appShare an appSense-demo.Qlik.comQlikcloud.comTest your ent43
Qlik Sense Enterprise Qlik Analytics Platform Sense Part of the Qlik Sense family of products, the Qlik Analytics Platform puts the power of the QIX associative data indexing engine and visualizations in the hands of application developers through powerful, open and modern API’s, allowing you to see the whole story within your data.