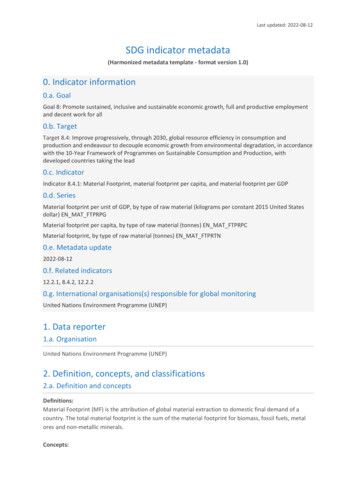
Transcription
Last updated: 2022-08-12SDG indicator metadata(Harmonized metadata template - format version 1.0)0. Indicator information0.a. GoalGoal 8: Promote sustained, inclusive and sustainable economic growth, full and productive employmentand decent work for all0.b. TargetTarget 8.4: Improve progressively, through 2030, global resource efficiency in consumption andproduction and endeavour to decouple economic growth from environmental degradation, in accordancewith the 10-Year Framework of Programmes on Sustainable Consumption and Production, withdeveloped countries taking the lead0.c. IndicatorIndicator 8.4.1: Material Footprint, material footprint per capita, and material footprint per GDP0.d. SeriesMaterial footprint per unit of GDP, by type of raw material (kilograms per constant 2015 United Statesdollar) EN MAT FTPRPGMaterial footprint per capita, by type of raw material (tonnes) EN MAT FTPRPCMaterial footprint, by type of raw material (tonnes) EN MAT FTPRTN0.e. Metadata update2022-08-120.f. Related indicators12.2.1, 8.4.2, 12.2.20.g. International organisations(s) responsible for global monitoringUnited Nations Environment Programme (UNEP)1. Data reporter1.a. OrganisationUnited Nations Environment Programme (UNEP)2. Definition, concepts, and classifications2.a. Definition and conceptsDefinitions:Material Footprint (MF) is the attribution of global material extraction to domestic final demand of acountry. The total material footprint is the sum of the material footprint for biomass, fossil fuels, metalores and non-metallic minerals.Concepts:
Last updated: 2022-08-12Domestic Material Consumption (DMC) and MF need to be looked at in combination, as they cover thetwo aspects of the economy, production and consumption. The DMC reports the actual amount ofmaterial in an economy, MF the virtual amount required across the whole supply chain to service finaldemand. A country can, for instance, have a very high DMC because it has a large primary productionsector for export or a very low DMC because it has outsourced most of the material intensive industrialprocess to other countries. The material footprint corrects for both phenomena.2.b. Unit of measureTonnes;Kilograms per constant United States dollar;Tonnes per capita.2.c. Classifications Material categories accordance to the global EW-MFA guide “UNEP (2021). The use of naturalresources in the economy: A Global Manual on Economy Wide Material Flow ndle/20.500.11822/36253/UNRE.pdf?sequence 3&isAllowed y);Standard Country or Area Codes for Statistical Use (UN M49 classification of countries andregions)3. Data source type and data collection method3.a. Data sourcesThe global estimation for MF is based on data available from different national and international datasetsin the domain of material flow accounts, agriculture, forestry, fisheries, mining and energy statistics.International statistical sources for MF include the International Energy Agency, the United NationsStatistical Division, the United States Geological Survey, the Food and Agriculture Organization andCOMTRADE databases.3.b. Data collection methodFor global estimation, the International Resource Panel (IRP) Global Material Flows and ResourceProductivity working group compiles the data from national and international databases.At the same time, country-provided indicators are collected through the QUESTIONNAIRE ON ECONOMYWIDE MATERIAL FLOW ACCOUNTS for the SDG indicators 8.4.1/12.2.1 and 8.4.2/12.2.2.3.c. Data collection calendarFirst data collection in 2022 and every 2 to 3 years after.3.d. Data release calendarFirst data release in 2017, the second in 2021 (fully estimated data). Then, in 2022 and every 2 to 3 yearsafter (both globally estimated and country data).
Last updated: 2022-08-123.e. Data providersNational Statistical Offices3.f. Data compilersUnited Nations Environment Programme (UNEP), Organization for Economic Co-operation andDevelopment (OECD) and EUROSTAT3.g. Institutional mandateUNEP was mandated as a Custodian Agency for indicator 8.4.1 / 12.2.1 by the Inter-agency and ExpertGroup on SDG Indicators. UNEP IRP is the mechanism within UNEP supporting all work aspect in relationto Material Flow Accounting.4. Other methodological considerations4.a. RationaleMaterial footprint of consumption reports the amount of primary materials required to serve finaldemand of a country and can be interpreted as an indicator of the material standard of living/level ofcapitalization of an economy. Per-capita MF describes the average material use for final demand.4.b. Comment and limitationsA footprint calculation uses the global Multi-Regional Input Output (MRIO) analysis, which compilesinformation from many countries national statistics to create a global multi-regional input-output table.This process requires a high level of computing capacity by supercomputers. Therefore, a limited numberof countries can do the analysis on its own.4.c. Method of computationMaterial footprint by type of raw material (tonnes) is calculated as:𝑀𝐹 𝐷𝐸 𝑅𝑀𝐸𝐼𝑀 𝑅𝑀𝐸𝐸𝑋Where:𝑀𝐹 – material footprint;𝐷𝐸 – domestic extraction of materials;𝑅𝑀𝐸𝐼𝑀 – raw material equivalent of imports;𝑅𝑀𝐸𝐸𝑋 – raw material equivalents of exports.For the attribution of the primary material needs of final demand a global, multi-regional input-output(MRIO) framework is employed. The attribution method based on I-O analytical tools is described indetail in Wiedmann et al. 2015. It is based on the Eora MRIO framework developed by the University ofSydney, Australia (Lenzen et al. 2013) which is an internationally well-established and the most detailedand reliable MRIO framework available to date.Material footprint per capita, by type of raw material (tonnes), is calculated as:
Last updated: 2022-08-12𝑀𝐹 𝑝𝑒𝑟 𝑐𝑎𝑝𝑖𝑡𝑎 𝑀𝐹𝐴𝑛𝑛𝑢𝑎𝑙 𝑎𝑣𝑒𝑟𝑎𝑔𝑒 𝑝𝑜𝑝𝑢𝑙𝑎𝑡𝑖𝑜𝑛Material footprint per unit of GDP, by type of raw material (kilograms per constant 2015 United Statesdollar), is calculated as:𝑀𝐹 𝑝𝑒𝑟 𝐺𝐷𝑃 𝑀𝐹𝐺𝐷𝑃 𝑖𝑛 𝑐𝑜𝑛𝑠𝑡𝑎𝑛𝑡 2015 𝑈𝑛𝑖𝑡𝑒𝑑 𝑆𝑡𝑎𝑡𝑒𝑠 𝐷𝑜𝑙𝑙𝑎𝑟𝑠4.d. ValidationUnited Nations Environment Programme (UNEP) sends a prefilled questionnaire with estimated data tothe National Statistical Office (NSO) Focal Points (FP) with a request to validate globally estimated datafor this indicator and replace the data if needed/possible. The FPs coordinate data validation withstakeholders within their countries and report back the data to UNEP. For countries with no national datacollected for this indicator, UNEP asks to agree on publishing and releasing the estimated data on UNEP’sWorld Environment Situation Room and UNSD SDG Global database.4.e. AdjustmentsUNEP replaces globally estimated data by national data if requested by the country.4.f. Treatment of missing values (i) at country level and (ii) at regional level At country level:A zero is imputed when no positive real value was officially recorded, in the base data sets used, for anyof the underlying components which make up this aggregated total. Thus “0.0” can represent either NA,or a genuine 0.0, or (crucially) a combination of both, which is a common situation. This allows for valuesto be easily aggregated further; however, it should be thus noted that due to imputing missing values as“0.0”, the aggregations may represent a lower value than the actual situation. At regional and global levels:Similarly, missing values are imputed as zero in the regional and global aggregations. However, in thecase where no data is available at all for a particular country, then the per capita and per GDP estimatesare weighted averages of the available data.4.g. Regional aggregationsThe data are aggregated at the sub-regional, regional and global levels. For the aggregation methods,please see: http://wesr.unep.org/media/docs/graphs/aggregation methods.pdf4.h. Methods and guidance available to countries for the compilation of the data atthe national level United Nations Environment Programme (UNEP) jointly with the International Resource Panel(IRP), United Nations Statistics Division (UNSD), the Statistical Office of the European Union(Eurostat) and the Organisation for Economic Co-operation and Development (OECD) havedeveloped a global manual on Economy-Wide Material Flow Accounting (EW-MFA) which brings
Last updated: 2022-08-12 in the European guidelines but provides a modular approach for countries looking to developEW-MFA for the first time and it addresses specific issues related to resource extractive basedeconomies. UNEP (2021). The use of natural resources in the economy - A Global Manual onEconomy Wide Material Flow e/20.500.11822/36253/UNRE.pdf?sequence 3&isAllowed yEUROSTAT (2018). The EU Economy-wide material flow accounts handbook nuals-and-guidelines/-/KS-GQ-18-0064.i. Quality managementQuality management is provided by United Nations Environment Programme (UNEP), jointly withInternational Resource Panel (IRP), using the Global Manual on Economy-Wide Material Flow Accounting(UNEP, 2021).4.j Quality assuranceQuality assurance is provided by United Nations Environment Programme (UNEP), jointly withInternational Resource Panel (IRP), using the Global Manual on Economy Wide Material Flow Accounting(UNEP, 2021).4.k Quality assessmentQuality assessment is provided by United Nations Environment Programme (UNEP), jointly withInternational Resource Panel (IRP), in consultation with countries (nominated Focal Points) after receivingtheir feedback on the globally estimated indicators.5. Data availability and disaggregationData availability:The data covers about 160 countries (either globally estimated or country data).Time series:The data set presented in the SDG database covers a time period of 20 years (2000-2019).The International Resource Panel (IRP) publishes estimated data series for 1970-2019 on its website.Disaggregation:The Material Footprint indicator is disaggregated into four main material categories (biomass, fossil fuels,metal ores and non-metallic minerals).6. Comparability / deviation from international standardsMaterial Footprint is calculated coherent with international standards, recommendations, andclassifications such as the System of National Accounts 2008, the System of Environmental-EconomicAccounting – Central Framework 2012, the Balance of Payments and International Investment Position,the International Standard Industrial Classification of All Economic Activities (ISIC), the Central ProductClassification (CPC) and the Framework for the Development of Environment Statistics.
Last updated: 2022-08-12Sources of discrepancies:Not applicable7. References and DocumentationURL:UNEP (2021), The use of National Resources in the Economy: a Global Manual on Economy Wide MaterialFlow e/20.500.11822/36253/UNRE.pdf?sequence 3&isAllowed yReferences:EUROSTAT (2013). Economy-Wide Material Flow Accounts. Compilation guide -1fb0-40f2-b1e4-64ed22ae3f4cEUROSTAT (2018). The EU Economy-wide material flow accounts handbook nuals-and-guidelines/-/KS-GQ-18-006Wiedmann, T., H. Schandl, M. Lenzen, D. Moran, S. Suh, J. West, K. Kanemoto, (2013) The MaterialFootprint of Nations, Proc. Nat. Acad. Sci. Online before print.Lenzen, M., Moran, D., Kanemoto, K., Geschke, A. (2013) Building Eora: A global Multi-regional InputOutput Database at High Country and Sector Resolution, Economic Systems Research, 25:1, 20-49.
Material footprint per unit of GDP, by type of raw material (kilograms per constant 2015 United States dollar) EN_MAT_FTPRPG Material footprint per capita, by type of raw material (tonnes) EN_MAT_FTPRPC Material footprint, by type of raw material (tonnes) EN_MAT_FTPRTN 0.e. Metadata update 2022-08-12 0.f. Related indicators 12.2.1, 8.4.2, 12.2.2
