Transcription
Tire Footprint StudiesMangal Chawla and John MedzorianLanding Gear Systems GroupFlight Dynamics DirectorateWright LaboratoryWright Patterson Air Force Base, OH
TIRE FOOTPRINT STUDIESMangal Chawla and John MedzorianLanding Gear Systems GroupFlight Dynamics DirectorateWright LaboratoryWright Patterson Air Force Base, OHABSTRACTThis presentation covers the results of tire footprint studies conducted in the Landing Gear Development Facility of the USAF Wright Laboratory at the Wright Patterson Air Force Base, OH. Tire footprintstudies are essential in understanding tire wear mechanisms and computing tire tread wear rates. The powerinput into the tread is the driving force for tread wear. Variables needed for power input calculations includethe footprint pressure and slip velocity distributions. Studies were performed on the effects of power inputdistributions due to vertical load, camber, yaw, inflation pressure and tire construction. For the present study,two tire constructions, one radial and the other bias, were selected. These tires were for the F-16 Block 30Fighter aircraft, both of which were previously worn. The present study was limited to steady straight roll witha 14,000 lb vertical load, a 310 psi inflation pressure, zero yaw and camber. All tests were conducted on theTire Force Machine (TFM) with a specialized sensor plate with embedded pressure sensors (X, Y and Z) andslip sensors (X & Y). All tests were conducted for a table speed of 1ids. Tests on the TFM show that the powerintensity distributions and total power for both tire constructions are quite similar for straight roll. Later on,tests were also conducted on a modified dynamometer which was overlaid with a grit wear surface. The tirespeed was maintained at 40 miles per hour and yaw was set to four degrees. Dynamometer tests showed thatradial tires have more tread wear than the bias tire, however, in the field, radial tires have longer life. This isa dilemma.
PROBLEMIncluded is the problem statement of low tire life.Excessive tire wear due to- Large contact pressuresLarge slip velocity-Very few sortiedtire-.8-12 landingsF-16 Block 40 8 50.4-8 landingsF- 16 Block 30.Figure 1.
OBJECTIVESThis slide states the objectives of the program. The main objectivesare to quantify parameters affectingtread wear.Overall Objective: Increase tread lifeFocussed Objective: Quantiw operating conditions and tire designparameters affecting tread wearOperating conditions- Load- Takeoff/Landing profile (speed, yaw, camber, braking)- An tiskid characteristicsTire design parameters- Inflation pressure- Tire construction (bias/radial)Figure 2.
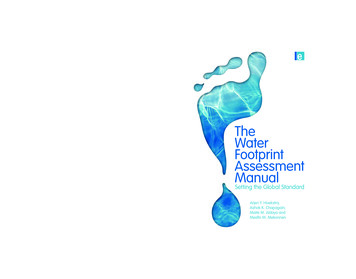
NEEDSThis slide states the need to study footprint pressures and slips so that power intensity can be calculatedfor tread-wear computations. This data is needed for steady roll, yaw and braking conditions.Determine aircraft tire footprint slips and pressuresto quantify PO wer intensity due to-Steady rollYawSteady (crosswind)Cornering-BrakingSteady (constant slip)Transient (antiskid)Figure 3.
TOOLSThe tools for carrying out this work are the Tire Force Machine (TFM) and specialized sensors whichmeasure footprint pressures and slips.Experimental-TFMSteady conditions onlyLow speed (2 in/s max)A nalytical/Computational-FEMFigure 4.
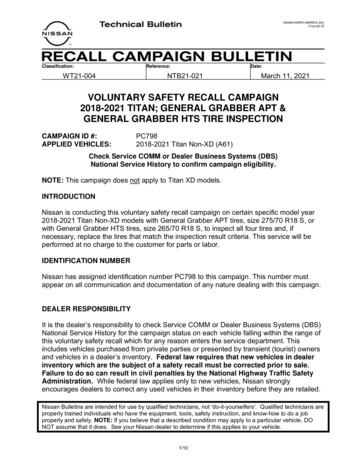
APPROACHThe approach to this work is to performroll tests on the TFM and measurefootprint data using specializedequipment. The data will be analyzedfor wear energy rate determination. Parameter studies will be performedto compare the performance of radial against bias tire for vertical load, yaw and camber.Perform Footprint measurements on TFM-Slip velocity x (longitudinal) y (lateral)-Contact force intensity x, y and z (normal)Data Analysis-Wear energy rate determinationParametric studies on F-I6 tires****Type (Radial vs Bias)Vertical LoadYawCamberFigure 5.
SENSORS FOR TIRE FORCE MACHINEThis slide shows the layout of pressure and slip sensors and the direction of roll. Pressure sensors giveX, Y and Z components of pressure, whereas slip sensors measure X and Y components. There are 37 pressuregages and 37 slip gages. The holes are 114inch in diameter. The pressure sensors are level with the top of theplate whereas the slip sensors are 4 mils above the plate surface.SENSORS FOR TIRE FORCE MACHINE,------I- ,SO*)(36 SPACES 18'------------IiPRESSUREGAGES371DIRECTION OF MDTIONFigure 6.
F-16 BLOCK 30This is a mesh plot of the vertical (Z) pressure for the bias and the radial F- 16 Block 30 tires. Both plotslook similar in shape and magnitude indicating that the normal pressures are nearly the same for these tires.In all runs, the tire is rolling towards the origin in the fore-aft direction. The table speed was 0.98 1 i d s for theradial tire and 0.91 3 i d s for the bias tire.BIASF-16 BLOCK 30Load 14 Kips, Inf. Pr. 310 PSIRADIALYaw 0 , Camber 0fore-aft posllion (in)lateral position (in)fore-afl position (in)Figure 7.00laleral position (ln)
X PRESSUREThis is a plot of the fore-aft (X) pressure distributions for both radial and bias tires. The total measuredsteady state X force is 140 lbs for the radial tire and 271 lbs for the bias tires. This compares favorably withthe predicted integrated values of 265 lbs and 141 lbs. Therefore, the total dissipative power in these runs worksout to be 137 in-lbls for the radial tire and 247 in-lbls for the bias tire.F-16 BLOCK 30Load 14 Kips, Inf. Pr. 310 PSIYaw 0, Camber 025.5x8.014RO Load 14,000Ib P JlOpsi Y C Ofore-aft position (in)0025.5x8.OR14RO Load l4,OMllbP JlOpsi Y C Ofore-an posltion (in)lateral position (in)Figure 8.RADIAL00lateral pas lion( n)
Y PRESSUREThis is a plot of the lateral (Y) pressure distribution for both radial and bias tires.F-16 BLOCK 30BIASLoad 14 Kips, Inf. Pr. 310 psiRADIALYaw 0, Camber 0fore-aft pos tion(in)00lateral positton ( n )fore-aft pos tion(in)Figure 9.00lateral position (in)
TRACTION VECTORThis is a plot of the traction vectors providing both magnitude and direction.Figure 10.ioi
X SLIP VELOCITYThis is the slip velocity in the fore-aft (X) direction, measured in miYs. Note that the peaks occur at thetrailing edges of the contact patch. The slip velocity was calculated from the slips by using the centraldifference method. The data was manipulated such that at zero normal (2)pressure, no slip velocity occurs.Note that the maximum slip occurs at the trailing edge of the tire.BIASF-16 BLOCK 30Load 14 Kips, inf. Pr. 310 PSIRADIALYaw 0, Camber 025.5 8.0-14/20Load l4,WOlb P 310p iY C O.- -10f o r e 4porltm (in)00lateral psitim (in)10lOre-?Jl position (in)Figure 11.00IhtWdlposition (in)
Y SLIP VELOCITYThis is the slip velocity in the lateral (Y) direction, measured in mills. Note that the maximum valuesoccur at the trailing and leading edges of the contact patch.F-16 BLOCK 30BIASLoad 14 Kips, inf. Pr. 310 psiRADIALYaw 0, Camber 000lateral posilion (in)fora-aff posi&n (in)Figure 12.0x01htmlpoar on(in)
SLIP VELOCITY MAGNITUDEThis is the slip velocity magnitude measured in mills. Note that the peaks occur at the trailing edge ofthe contact patch.F-16 BLOCK 30Load 14 Kips, Inf. r . 310 PSIYaw 0, Camber 025.5 8.014/20Load 14,0001bP Jl@si Y C oRADIAL25.5 8.OR14ROLoad.14.0001bP-3lOpsi Y C O10.f o r s 4 poaikn (in)00fOre-afI position(in)lateral psiliar (in)Figure 1300lateral position (in)
SLIP VECTORThis is the plot of the slip velocity vector giving both the magnitude and the direction. There is a lot ofsimilarity between the two tires.F-16 BLOCK 30RADIALLoad 14 Kips, Inf. Pr. 310 PSIYaw 0, Camber 025.5 8.014ROLoad 14,0001bYwCam O Slip vector12345lateral position (in)6725.5x8.OR14RO Load 14,0001bP 3lOosl Y C O Slio veclor89Figure 14.12345lateral position(in)6709
Z PRESSUREThis is a contour plot of the normal (Z) pressure for the bias tire. When integrated over the contact area,it gives a total value of 15,565 lbs which compares favorably with the applied load of 14,000 lbs.F-16 BLOCK 30 BIASLoad 14 Kips, Inf. Pr. 310 PSIYaw 0 , Camber 0012468Fore-aft position (in)Figure 15.1012
SLIP VELOCITY MAGNITUDEThis is a contour plot of the slip velocity magnitude for the bias tire. Note that the slip velocity ismaximum at the trailing edge of the contact patch. This data was manipulated by zeroing out values whichoccurred at zero contact pressure.F-16 BLOCK 30 BIASLoad 14 Kips, Inf. Pr. 310 PSIYaw 0, Camber 0Slip Vel Mag(mills)L8hc.---VC-.0 6V)4-l0-az'1-.c-'-J2-a82.38224:I t)3' -7" 0@2468Fore-aft position (in)Figure 16.1012
POWER INTENSITYThis is a contour plot of the power intensity calculated by multiplying an assumed value of coefficientof friction (0.5) and the Z pressure by the slip velocity magnitude. Note that the maximum power intensityoccurs at the front and back edges of the tire. The total dissipative power due to friction was determined byintegrating this power intensity over the contact area. The resulting value was 22.0 in-lbls for the bias tire.F-16 BLOCK 30 BIAS] L tLoad 14 Kips, Inf. Pr. 310 PSIYaw 0, Camber 02F&-aft68position (in)Figure 17.Pow Int(in-lb)l(s inA2)12
Z PRESSUREThis is a contour plot of the normal (Z) pressure for the radial tire. When integrated over the contact areait gives a value of 15,095 lbs which compares favorably with the applied load of 14,000 lbs.F-16 BLOCK 30 RADIALLoad 14 Kips, Inf. Pr. 310 PSIYaw 0, Camber 0PressureFigure 18.
SLIP VELOCITY MAGNITUDEThis is a contour plot of the slip velocity magnitude for the radial tire. Note that the slip velocity ismaximum on the trailing edge of the contact patch. This data was manipulated by zeroing out values whichoccurred at zero contact pressure.F-16 BLOCK 30 RADIALLoad 14 Kips, Inf. Pr. 310 PSIYaw 0, Camber 091Slip Vel Mag(miVs)Figure 19.
POWER INTENSITYThis is a contour plot of the power intensity for the radial tire. This was calculated by multiplying anassumed value of coefficient of friction (0.50) by the Z pressure and the slip velocity magnitude. Note thatthe maximum power intensity occurs at the front and back edges of the tire. The total dissipative power was23.6 in-lbls for the radial tire.F-16 BLOCK 30 RADIAL'Load 14 Kips, Inf. Pr. 310 PSIYaw 0, Camber 0Pow IntFigure 20.
POWER INTENSITYThis is a mesh plot of the power intensity distributions for the two tires.F-16 BLOCK 30Load 14 Kips, Inf. Pr. 310 PSIRADIALYaw 0, Camber 025.5x8.OR14RO Lcad 14,0001bP 31OpaiY C 4Figure 2 1.
POWER PER UNIT LENGTHThis is a plot of power per unit width plotted in the lateral direction which was determined by integratingthe power intensity along the fore-aft direction.F-16 BLOCK 30Load 14 Kips. Inf. Pr. 310 PSIYaw 0, Camber 0Figure 22.RADIAL
RESULTSTabulated results for both bias and radial tires. All values are very similar.BIASTable speed (ink)Maximum slip (mil),91331.3RADIAL,98149. IX-Pressure range psiYIPressure range psiTraction Vector psi2-Pressure range psiX-Slip Velocity mi1.sV-Slip Velocity mil/sSlip Velocity Magnitude mi1.sPower Intensity in-lb/(s-inA2)MEASURED (INTEGRATED) TOTAL VALUESFx (Ib)FY(lb)Fz (lb)Power (in-lb/s)271 (265)182 (6)14,000 (15,565)(22.0)Figure 23.140 (141)157 (199)14,000 (15,291)(23.6)
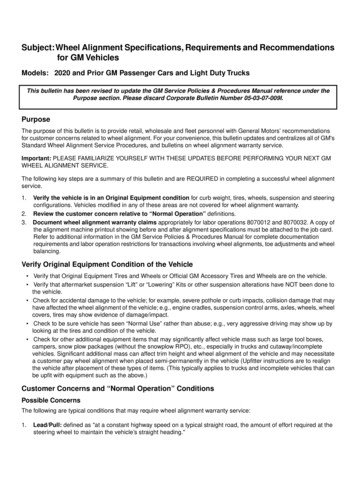
WL DYNAMOMETER TIRE WEAR RESULTS SUMMARYThis is a plot of the actual tire wear on the bias and the radial tires which were run on a modified externaldrum dynamometer overlaid with an abrasive material glued to the wheel surface. The tire was run with fourdegrees of yaw at 40 mph. Tread wear was quantified by measuring the maximum groove depth on the tiretread. Note that on the dynamometer for four degrees of yaw, the radial tire wears much faster than the biastire. However, in the field, the radial tires have longer tread life.IwQ)0u2Lsaitu4Dea.Yaw13,000 b Vertical Load310 psi lnfhtbn PressweBlas T i (QTR 461B-3431-TL)Radii Tire (QTR Q M 7 M I )69010000Cumulative Distance Traveled (it)Figure 24.20000
Tire footprint studies are essential in understanding tire wear mechanisms and computing tire tread wear rates. The power input into the tread is the driving force for tread wear. Variables needed for power input calculations include the footprint pressure and slip velocity distributions. Studies were performed on the effects of power input