Transcription
1
Introduction The High Quality Market (HQM) Corporate Bond Yield Curve forthe Pension Protection Act (PPA) uses a methodologygy developedpat Treasury to construct yield curves from extended regressionson maturity ranges. This presentation discusses basic concepts for understanding andusing the HQM yield curve, and presents an overview of thecurve methodology. For links to more detailed documentationand technical descriptionspof the curve,, see the last slide. The methodology for the HQM curve is general. It has beenapplied to Treasury inflation-indexed securities (TIPS) and hasbeen used to construct other corporate bond yield curves; anexample of a AA curve appears at the end of this presentation.2
HQM Yield Curve Summary A yield curve provides information about a sector of the bondmarket at a point in time. The information includes yields ondifferent types of bonds in this sector at various maturities. The HQM yield curve pertains to the high quality corporate bondmarket i.e.,market,i e corporate bonds rated AAAAAA, AAAA, or AA. Theregression methodology of the HQM curve blends AAA, AA, and Abonds into a single yield curve that represents the marketweighted average quality of high quality bondsbonds. The HQM methodology also projects yields beyond 30 yearsmaturity out through 100 years maturity. The methodologyensures that the projections are consistent with yields before 30years maturity and with long-term investment returns availablein the market.3
Spot Rates The yields provided by the HQM Corporate Bond YieldCCurveare spott rates.tThThe HQM curve providesid spott ratestfor each maturity at half-year intervals for maturities of ½year up through 100 years, for a total of 200 spot rates. The spot rate for any maturity is defined as the yield on abond that gives a single payment at that maturity. This iscalled a zero coupon bond. Because high quality zero coupon bonds are not generallyavailable, the HQM methodology computes the spot ratesso as to make them consistent with the yields on other highquality bonds.4
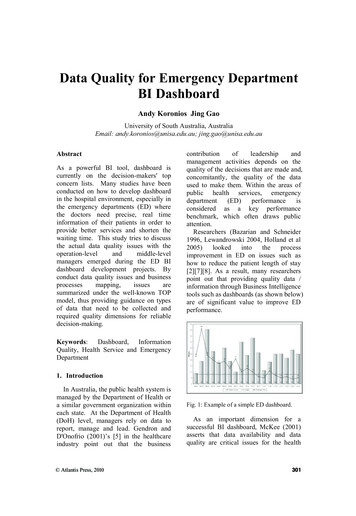
Spot Rates, continued The HQM yield curve is calculated late in the day for eachb ibusinessdday, andd ththe publishedbli h d monthlythl HQM spott ratestare averages of rates for all the business days of the month. Segment rates required by the PPA are derived from themonthly average spot rates. The next chart plots the 200 monthly average spot ratesout through 100 years maturity from the HQM yield curvesfor July and August of this year. The August curve is belowJuly beyond the shortest maturities.5
HQM SPOT YIELD CURVESMonthly Averages, Percent9988776655August 2011July 2011432321041Maturity1020304050607080090 1006
Discounting Liabilities The HQM spot rates are used to discount future pensionli biliti toliabilitiest provideid theth presentt fundingf di levelll neededd d forfthe liabilities. Therefore, regardless of the assets chosen todo the funding, the HQM spot rates give the funding levelatt a market-weightedk ti ht d hihighh creditdit quality.lit A different quality yield curve would give a differentfunding levellevel: the higher the credit quality of the bonds inthe yield curve used for discounting, the higher the fundinglevel and the greater the funding burden on the pensionplan but also the lower the risk that the plan will becomeplan,underfunded.7
Discounting Liabilities, continued Therefore, the choice of the credit quality for the yieldcurve implies a decision about the tradeoff between higherfunding levels and less pension underfunding risk, versuslower funding levels and more risk. Consequently, a different yield curve from the HQM yieldcurve may change funding requirements substantially.E g the use of a Treasury curve would increaseE.g.,significantly the funding burden relative to the HQMcurve.8
Blended High Quality Bonds Although no individual bond has the credit qualityrepresented by the HQM yield curvecurve, the curve can be usedfor an appropriate blended set of high quality bonds. For example, if 5 percent of the high quality market is AAArated, 25 percent is AA rated, and 70 percent is A rated, ablended high quality bond of 10 years maturity consistingof 5 percent 10-year AAA, 25 percent 10-year AA, and 70percent 10-year A can be priced by applying the HQM spotrates to the cash flows from these bonds. ThTherefore,fiin principle,i i l pensioni liliabilitiesbiliti couldld beb fundedf d dby a portfolio of blended high quality bonds, and the valueof this portfolio would track the HQM yield curve.9
Blended High Quality Bonds, continued Of course, this approach is difficult for a variety of reasons,including ratings changes within the portfolio whichrequire rebalancing, and lack of bonds beyond 30 yearsmaturity. Moreover, changes in the relative sizes of the three highquality ratings categories would require changes in theblended bonds to remain consistent with the HQMQ yieldycurve. Therefore, it’s no surprise that typical bond portfolios thatd nott accountt ffor thdothese diffidifficultieslti ddon’t’t ttrackk ththe HQMcurve exactly.10
HQM Risk Aspects Nevertheless, it’s not clear that any other yield curve wouldbe easier to hedge than the HQM yield curve. EvenTreasury coupon issues stop at 30 years maturity, and havespecial inconsistencies such as on-the-run issues. In analyzing hedging, it must also be kept in mind that theHQM yield curve provides a suitable level of pensionfunding that is both accurate and stable over timetime.Therefore, the HQM curve can be relied upon for planning,and in that sense reduces risk.11
HQM Risk Aspects, continued Also, the monthly average feature of the HQM yield curvemay further reduce certain types of risk. This is because no portfolio tracks the HQM curveperfectly and therefore,perfectly,therefore itit’ss important that the curve bestable for planning purposes. The monthly averagereduces the possible volatility in the curve that could comeffromspeciali l behaviorb h i att month-end.th d12
Yield Curve Methodology The following slides contain an overview of the HQM yieldcurve methodology.th d l Different yield curve methodologies can produce verydifferent results, which affect pension liabilities andeverything else for which the curve is used. Therefore, it’sessential to develop the methodology that accuratelycaptures market behavior.behavior Moreover, an understanding of the HQM methodology aidsgreatly in the appropriate use of the HQM curve.13
HQM Methodology FeaturesThe HQM yield curve methodology contains features andcapabilities that do not appear in other yield curveapproaches: This methodology combines regression variables with theyield curve. The methodology projects yields beyond 30 years. The methodology makes use of established bond marketcharacteristics to help generate a stable curve thatcaptures market movements.movements14
HQM Methodology: Regression Variables The HQM methodology has the special capability of combiningregression variables with the yield curve. The regressionterms adjust for the particular attributes of individual bonds. The HQM yield curve contains two regression terms. Thesettermsare adjustmentdj tt ffactorstththatt blblendd AAAAAA, AAAA, anddAbonds into a single HQM yield curve that pertains to themarket-weighted average quality of high quality bonds. Other yield curve approaches were typically developed forTreasury securities, and they do not take into account thedistinctive characteristics of corporatepbonds. Otherapproaches do not have regression variables and cannot blendbonds of different qualities.15
HQM Methodology: Projections The HQM methodology projects yields beyond 30 yearsmaturity out to 100 years maturity to get discount rates forlong-dated pension liabilities.gy ensures that the pprojectionsjare The methodologyconsistent with yields before 30 years maturity and withlong-term investment returns available in the market. OthOther yieldi ld curve approachesh generallyll stopt att 30 yearsmaturity and contain no provision for projection.16
HQM Methodology: Established Market Views The HQM methodology is derived from basic hypothesesabout corporate bond markets. The hypotheses inform thesetting of the parameters that underpin the HQM yieldcurve. Other yield curve approaches typically use mathematicalfunctions that don’t have any foundation in markethypotheses.hypotheses Consequently, differences among yield curves given byppwith different mathematics are arbitrary,y,other approachesin that there is no way to choose among them.17
Estimation of HQM Spot Rates Estimation of the spot rates in the HQM yield curve startsb choosingbyh i an appropriatei t sett off bbondsd (d(describedib d llater).t ) The regression terms are computed so that the price ofeach bond adjusted by the regression terms equals what itwould have been if the bond were of market average highquality. (Technical discussion of the regression terms isfound in the references.)references ) The spot rates are chosen to be the rates that give the beststatistical fit to all the prices in the bond set. This meansthat the estimated prices of the bonds, given as their cashflows discounted by the spot rates, come closest on averageto their actual prices.18
Estimation of HQM Spot Rates, continued Note that the HQM yield curve estimation employs a modelof bond pricesprices. The estimation does not directly use bondyields or averages of yields. However, the description so far of the estimation is toogeneral actually to get spot rates statistically. To carry outthe estimation, the spot rates must be assumed to follow amathematical pattern or functional form. The main source of differences among yield curveapproaches is their different choices of functional forms,and as noted,noted functional forms in other approachestypically are not grounded in market hypotheses. TheHQM methodology bases the functional form on hypothesesaboutb t maturityt it ranges iin ththe market.k t19
The Forward Rate The concept of the forward rate is useful for picking afunctional form for estimating the spot rates. The forward rate is straightforward: for each maturity,consider entering into a contract to invest an amount atthe time of that maturity for a small amount of timebeyond that maturity. The forward rate at that maturity isthe future interest rate on this investment.20
The Forward Rate, continued In ggeneral,, analogousgto spotp rates,, the market does notprovide explicit forward rates, and they must be inferredfrom other prices in the market. ThThe fforwardd ratet iis hihigherh att a givenimaturityt it whenhinvestors who are trading at that maturity are less eager tolend based on their views of uncertainty and theirexpectationsiaboutbtheh market,k whilehil borrowersbare moreeager to borrow based on their perceptions. The forwardrate summarizes market views at each maturity in a singlenumber.21
Maturity Ranges Trading in bonds tends to divide into maturity ranges. Thetrades that take place in each maturity range on averagereflect similar preferences and expectations of traders inthat range. As a consequence, the forward rates in each maturity rangeare related, because they reflect the views of traders. Therefore, the HQM methodology models the forward ratesin each maturity range as a smooth (cubic) function, andjjoins the functions togethergsmoothlyy ((as a cubic spline).p)22
Maturity Ranges, continued The HQM methodology uses five maturity rangesranges,delineated by the maturity points 0, 1.5, 3, 7, 15, and 30years maturity. The choice of fixed maturity ranges increases significantlythe stability of the HQM yield curve estimates over time.23
The Long-Term Forward Rate Assumptionspmust be made in order to pprojectjforwardrates beyond 30 years maturity so as to obtain spot ratesout through 100 years maturity. FiFirstt off all,ll ththe llong-termtfforwardd ratet bbeyondd 30 yearsmaturity is set to a constant, because there are usually notenough data to estimate accurately movements in thefforwardd ratet bbeyondd 30 years maturity.t it24
The Long-Term Forward Rate, continued Next the HQM methodology postulates that the long-termforward rate is determined by the same factors that affectforward rates in the longest 15- to 30-year maturity range,since that range is likely sufficiently distant in time toreveal underlying long-term attitudes toward risk. Therefore, the constant long-term forward rate from 30years maturity up through 100 years maturity is taken tobe the average forward rate in the 15- to 30-year maturityrange.25
Estimation The forward rates in the maturity ranges are estimated byleast squares, and the spot rates are derived from theestimated forward rate curve. The regression terms and adjustment factors aresimultaneously estimated. Before estimation, the bonddata are weighted. (The adjustment factors and weightingare described in the references.)references )26
Data The HQM yield curve uses data from a set of high qualitycorporate bonds,bonds rated AAA,AAA AA,AA or A,A that accuratelyrepresent the high quality corporate bond market.g qqualityy The bonds are selected from the universe of all highbonds based upon several types of characteristics. The HQM curve is meant to represent all bonds in themarket.k t SoS a bondb d ththatt iis pricedi d andd availableil bl ffor ttraded iisincluded even if its yield appears to be an outlier relative toyields on other bonds. Such a bond is excluded only if therei some reason otherish thanh unusuall yieldi ld forf theh exclusion.l i27
Data, continued The basic type of selected bond is analogous toconventional Treasuryy couponp issues: a bond that ppaysy afixed semiannual nominal coupon denominated in U.S.dollars until maturity, when the principal is returned. ThThe bondb d set covers maturitiesi i up throughhh 30 years, withihmaturities below 1 year filled in by Federal Reservecommercial paper rates. Bid prices are used. Each bondmust meet a minimum size threshold in terms of paramount outstanding, currently 250 million. The number of corporate bonds that fulfill thesespecifications is sufficiently large at all maturities thatthere is no problem in computing the HQM yield curve.28
Results The following charts present sample results for the HQMyieldi ld curve ffor a singlei l day,d AAugustt 3131, 20112011, ththe llastt dday offAugust. As noted earlier, the published HQM curve forAugust is the monthly average.Characteristics of the bonds included in the August 31 set:RatingNumber ofBondsMaturity Range(years)Number ofBondsAAA420 – 1.5225AA2991.5 – 3283A1,3453–7502Commercial paper127 – 15287Total1,69815 – 3040129
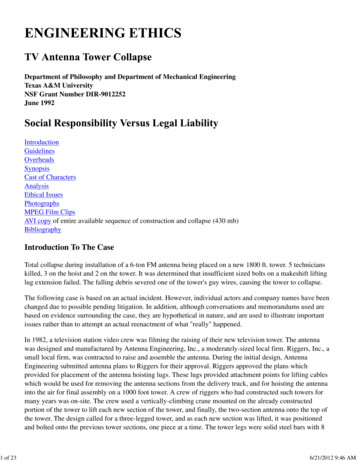
Results, continued The first chart shows the estimated forward rate curve forAAugustt 3131, 2011 plottedl tt d ththroughh 30 years maturity,t it anddprojected out through 40 years maturity. The chart depicts the forward rate in the five maturityranges, delineated by the vertical lines at the maturities 0,1.5, 3, 7, 15, and 30 years. The forward curve is fixed at 30 years maturity and beyondat the long-term forward rate of 6.76 percent, which isgiven by the average of the forward rate in the 15–30 yearmaturity range.30
HQM FORWARD RATE CURVE8/31/2011, Percent99Projected Beyond 30Knots: 00,1.5,3,7,15,301 5 3 7 15 30887766Flattens Out55443BecomesLinear210Average 15 to 30 Value at 30 6.7651015202521Maturity, Years03303504031
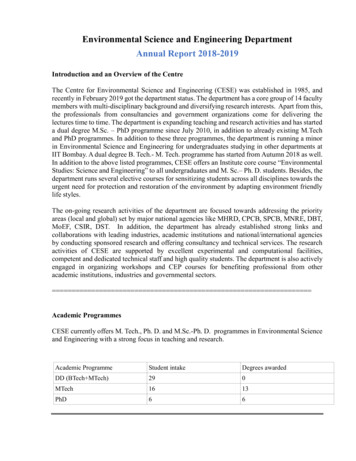
Results, continued The second chart shows the spot yield curve for August 31,312011. The spot curve is projected out through 100 years. It slopesgently upward from about 30 years maturity onward. Itreaches 6.00 percent at 30 years maturity, and 6.62 percentat 100 years maturity. It is near zero at the earliestmaturities, reflecting the low short-term rates on this date.32
HQM SPOT YIELD CURVE8/31/2011, Percent9988776655443322101Maturity YearsMaturity,01020304050607080090 10033
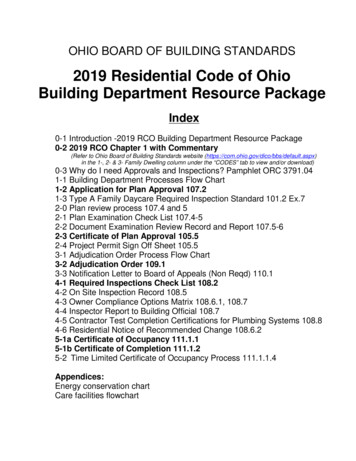
Sample AA Yield Curve The last chart adds a sample spot yield curve for August31 2011 att AA quality31,lit tto ththe HQM spott curve. PleasePlnotetthat this yield curve is a prototype, and it is not an officialTreasury yield curve. The sample AA curve was constructed using the HQMmethodology modified for AA quality instead of the marketweighted average high quality of the HQM curvecurve. The AA curve illustrates the fact that the HQMmethodology is a general-purpose yield curve methodologythat can be applied to different kinds of yield curves.34
SPOT YIELD CURVES8/31/2011, Percent9988776655HQMAA443322101Maturity, Years01020304050607080090 10035
For More Information The High Quality Market (HQM) Corporate Bond Yield Curve forthe Pension Protection Act (PPA) is published by the IRS eachmonth and is available on the IRS website. For more details on the mathematics behind the curve and formore documentation in general,general visit the Office of EconomicPolicy website. Go to www.treasury.gov, under “Resource Center”choose “Economic Policy,” then choose “Corporate Bond YieldCurve Papers.”p The HQM methodology has been applied to Treasury inflationindexed securities (TIPS). See papers 0601 and 0501 in theEconomic Policy Research Paper Series on the Office of EconomicPolicy website.36
Th f i i il i libiliti ldb f ddTherefore, in principle, pension liabilities could be funded by a portfolio of blended high quality bonds, and the value of this portfolio would track the HQM yield curve. 9. Blended High Quality Bonds, continued