Transcription
WHITE PAPERToday’s MEDICAL PRACTICECoding ProductivityBenchmarksDoyoupeersmeasureHow yourare doing up?— do you measure up?
2IntroductionWhen it comes to coding productivity, today’s medical practices are hard pressed toensure their coders peform at levels that keep reimbursements flowing to meet financialgoals. Your practice’s continued profitability hinges upon their ability to stay productive,accurate and efficient. There is a lot of noise that can distract coders from this primarypurpose. Medical practice decision makers must stay current on resources availableto them to ensure their coders are adequately equipped to meet new and challengingdistractions; or go under. This white paper illustrates the top productivity benchmarks tohelp you compare your own productivity and assess how your coders measure up basedon 4 key metrics. It will also expose the recipe for a high achieving coding department(hint: stack your department with coders that match this profile) and lastly the broadertrends related to evolving coder responsibilities.WHAT’S INSIDE:Introduction. 2Executive Summary. 3Productivity metrics for coders. 4Coding metrics by practice size,location. 9Profile of a productive coder.12Trends in coder om Toll-free: 1-855-CALL-DH1 Fax: 1-301-287-2535Two Washingtonian Center, 9737 Washingtonian Blvd., Ste. 502, Gaithersburg, MD 20878-7364
3EXECUTIVE SUMMARYEstablishing coder productivity standards can be difficult because you must take various factors intoaccount, and there are no apple-to-apple comparisons on which you can base your own requirements.However, medical practice managers and administrators can develop coder productivity standards bylearning from their peers. DecisionHealth surveyed 178 medical practice administrative professionals— including 90 coders — to determine benchmarks for productivity by measuring common repetitiveactivities: charts reviewed, claims coded, claims submitted and denials appealed.Some of the key findings are: Productivity of medical practice coders varies by specialty. Orthopedic and painmanagement coders have the highest per-day average of claims coded at 94 and 93, respectively.Otolaryngology (26), urology (38) and gastroenterology (39) have the lowest average numbers ofclaims coded per day. The most experienced coders are not the most productive. Generally, coders with six to 10years of experience in medical administration had the highest averages on productivity metrics.Interestingly, coders who had less than a year or more than 20 years of experience had similarproductivity numbers, according to the survey. Coders use online coding tools more than reference books. Only official manuals, which100% of coders employed to code, were more widely used than online coding tools (87%).Reference books were used by 72% of coders and payer/carrier websites were used by 70% ofthat group.The results of the survey are a snapshot into coder productivity and their current job responsibilities. Butincreasingly, coders are asked to diversify their roles at their practices, adding management, billing andcompliance responsibilities. Those factors could affect productivity benchmarks in the future.www.decisionhealth.com Toll-free: 1-855-CALL-DH1 Fax: 1-301-287-2535Two Washingtonian Center, 9737 Washingtonian Blvd., Ste. 502, Gaithersburg, MD 20878-7364
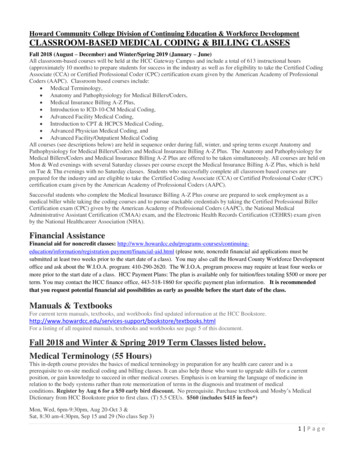
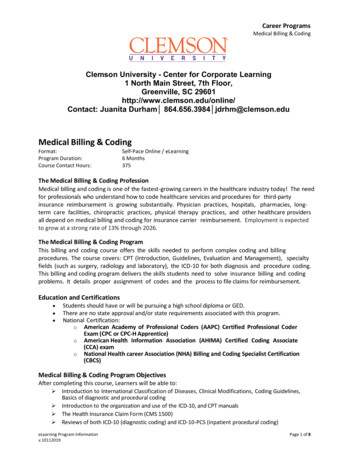
4Productivity metrics for codersCoders in medical practices have a variety of tasks to perform as part of their daily workflow.The survey measured four metrics that demonstrate a coder’s productivity: charts reviewed,claims coded, claims submitted and denials appealed. While not every coder performs eachtask, the ones captured illustrate the expanding role for coders.Overall, the coders in the study averaged these metrics for productivity on those topics:ALL CODERS (AVERAGE PER DAY)Coder Averages (first page)Charts Reviewed7889Claims Coded79Claims submitted4Denials appealed020406080100AVERAGE PER DAYSeparating those metrics by specialty shows variation in productivity. (Note that the all coder averagecontains more specialties than are listed on the following pages.)www.decisionhealth.com Toll-free: 1-855-CALL-DH1 Fax: 1-301-287-2535Two Washingtonian Center, 9737 Washingtonian Blvd., Ste. 502, Gaithersburg, MD 20878-7364
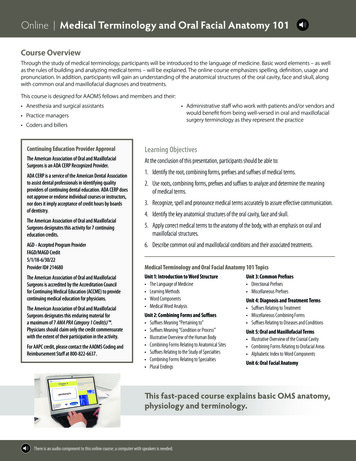
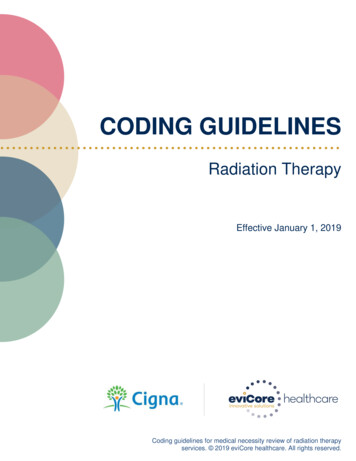
5CHARTS REVIEWEDCHART 1 Charts reviewed per day, by specialty78All coder eneral ryngology32Pain management6850Pediatrics72Primary care86Radiology32Urology020406080100NUMBER OF CHARTS REVIEWED PER DAYCoders in radiology and anesthesiology have the highest chart-per-day review averages at 86 and 83,respectively. Primary care — which includes family practice, general practice and internal medicine —and orthopedic coders review an average of 72 claims per day, also among the highest averages.Conversely, gastroenterology (31 charts reviewed per day), otolaryngology (32) and urology (32) codershad the lowest averages of charts reviewed per day.www.decisionhealth.com Toll-free: 1-855-CALL-DH1 Fax: 1-301-287-2535Two Washingtonian Center, 9737 Washingtonian Blvd., Ste. 502, Gaithersburg, MD 20878-7364
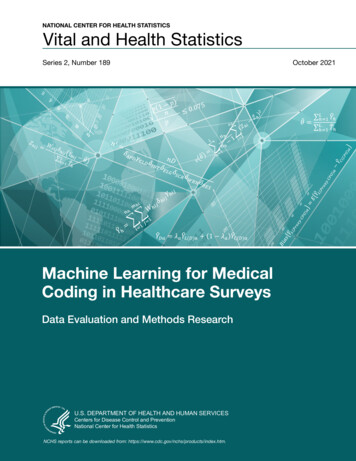
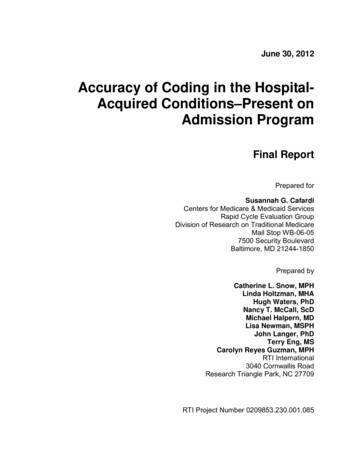
6CLAIMS CODEDWhile coding isn’t the only task many coders perform, it’s the main one. Almost 99% of coders dodiagnosiscodingwhile 92%do E/Mperand day,procedurecoding.CHART2 Claimscodedby specialty89All coder 9General ryngology93Pain management46Pediatrics82Primary care59Radiology38Urology020406080100CLAIMS CODED PER DAYOrthopedics has the highest average number of claims coded per day at 94. At one orthopedic practiceDecisionHealth interviewed, a program embedded in the electronic health record (EHR) system helpedphysicians drill down to the most specific ICD-10 codes with drop-down menus. The EHR would promptthem to answer questions about laterality and initial, subsequent and sequela encounters for fractures.That program helped ease code selection.Pain management coders also had a high number of per-day claims coded at 93, followed by primarycare with an average of 82 and anesthesia with an average of 75.Among the lowest averages for claims coded per day were otolaryngology (26), urology (38) andgastroenterology (39).www.decisionhealth.com Toll-free: 1-855-CALL-DH1 Fax: 1-301-287-2535Two Washingtonian Center, 9737 Washingtonian Blvd., Ste. 502, Gaithersburg, MD 20878-7364
7CLAIMS SUBMITTEDCoders no longer are tasked with just selecting codes, according to the DecisionHealth survey.Increasingly, they are taking on billing responsibilities. In fact, 53% of coders said they perform billingfunctions daily and almost 40% file claims.CHART 3 Claims submitted per day, by specialtyAll coder yGeneral aryngology1466Pain managementPediatrics2865Primary care34RadiologyUrology30020406080100120CLAIMS SUBMITTED PER DAYSubmitting claims is most prevalent at orthopedic practices where coders average 108 claims submittedper day, according to the survey. That’s far above the all-coder average of 79 claims submitted.Pain management coders submit an average of 66 claims per day and primary care coders submit anaverage of 65 claims per day.Practices where coders provide billing functions less often not surprisingly have lower average claimssubmitted per day. For example, just 27% of otolaryngology coders perform billing functions daily, andthat may account for the low claims-submitted-per-day average of 14. Similarly, 18% of pediatric codersperform billing functions daily, and coders in that specialty submit an average of 28 claims per day.www.decisionhealth.com Toll-free: 1-855-CALL-DH1 Fax: 1-301-287-2535Two Washingtonian Center, 9737 Washingtonian Blvd., Ste. 502, Gaithersburg, MD 20878-7364
8DENIALS APPEALEDAppealing claims denials is a task that 16% of coders perform daily, 29% perform weekly and 11%perform monthly.CHART 4 Denials appealed per day, by specialty4All coder eral ngology97Pain management10PediatricsPrimary care9RadiologyUrology100246810DENIALS APPEALED PER DAYCoders in gastroenterology, general surgery, pediatrics, radiology and urology appeal an average of 10claims per day. Cardiology, obstetrics/gynecology, otolaryngology and primary care coders appeal anaverage of nine claims per day.Anesthesia coders average just one appeal per day, notably fewer than their counterparts in otherspecialties. But interestingly, 60% of anesthesiology coders said they never appeal claims denials, whichrelates to the specialty’s low number of denials appealed per day.www.decisionhealth.com Toll-free: 1-855-CALL-DH1 Fax: 1-301-287-2535Two Washingtonian Center, 9737 Washingtonian Blvd., Ste. 502, Gaithersburg, MD 20878-7364
9Coding metrics by practice size, locationThe size of a coding department or the number of providers at the practice can affect coders’productivity metrics.SIZE OF CODING DEPARTMENTCODERS/BILLERS INCODING/BILLING LSAPPEALED10 or fewer515559411 to 25347054426 to 50544644551 to 9967691281100 or more7553531Coding departments with 11 to 25 coders or 51 to 99 coders seemed to have found the most efficienciescoding claims — they have the highest averages of claims coded per day at 70 and 69, respectively.Departments with 26 to 50 coders had the lowest average of claims coded per day at 46.Coders at practices with coding departments of 100 or more coders reviewed the highest average numberof charts per day at 75, while coders at departments with 11 to 25 coders had the lowest average of 34.Departments with 51 to 99 coders submitted a whopping 128 claims per day on average. All other sizes ofcoding departments averaged between 44 claims and 59 claims submitted per day.The smaller the coding department, the more responsibility its members seem to have to appeal deniedclaims. Coding departments of 10 or fewer coders and 11 to 25 coders appealed an average of fourdenials per day, according to the survey. Departments with 26 to 50 coders appealed an average of fivedenials per day.But at larger coding departments — those with 51 to 99 coders or 100 or more coders — the averagenumber of denials appealed per day dropped to one.www.decisionhealth.com Toll-free: 1-855-CALL-DH1 Fax: 1-301-287-2535Two Washingtonian Center, 9737 Washingtonian Blvd., Ste. 502, Gaithersburg, MD 20878-7364
10NUMBER OF PROVIDERS IN THE PRACTICENUMBER DDENIALSAPPEALED1 to 525273446 to 10436030211 to 257262137626 to 506710371451 to 10055701353101 to 2504448527More than 2506044352Practices with one to five providers had the lowest daily average numbers of charts reviewed and claimscoded at 25 and 27, respectively. Their average claims submitted per day — 34 — was the second lowestbehind practices with six to 10 providers.But being larger doesn’t mean you’ll have more productive coders. The biggest practices, those with morethan 250 providers, averaged per day 60 charts reviewed, 44 claims coded, 35 claims submitted and twodenials appealed.The practices with the highest average of charts reviewed per day, 72, have 11 to 25 providers. The highestaverage of claims coded was in the group of practices with 26 to 50 providers. And practices with 11 to 25or 51 to 100 providers had the highest average number of claims submitted at 137 and 135, respectively.www.decisionhealth.com Toll-free: 1-855-CALL-DH1 Fax: 1-301-287-2535Two Washingtonian Center, 9737 Washingtonian Blvd., Ste. 502, Gaithersburg, MD 20878-7364
11LOCATION OF ALSAPPEALEDGreat Plains (KS, ND, NE, OK, SD)29641314Mid-Atlantic (DC, DE, MD, NJ, NY, PA, VA, WV)143881922Midwest (IA, IL, IN, MI, MN, MO, OH, WI)101103653New England (CT, MA, ME, NH, RI, VT)9117413614Pacific (AK, CA, HI, OR, WA)54921413Rocky Mountains (CO, ID, MT, UT, WY)4994451Southeast (AL, AR, FL, GA, KY, LA, MS, NC, SC, TN)7073478Southwest (AZ, NM, NV, TX)4742191LOCATIONThe data show an emphasis on different metrics based on location. Charts reviewed: Mid-Atlantic, Midwest and New England states have the highest average chartsreviewed per day at 143, 101 and 91, respectively. Coders in the Great Plains (29), Southwest (47) andRocky Mountains (49) have the lowest averages. Claims coded: Coders in New England average the highest number of claims coded per day (174) byfar. Midwest coders average 103 claims coded per day followed by the Rocky Mountains (94) and Pacific.Coders in the Southwest average the fewest claims coded per day at 42. Claims submitted: Coders in the Mid-Atlantic submit the most claims per day on average at 192. Theaverage for coders in the Southwest is just 19. Denials appealed: The data show that some regions place more emphasis on coders appealing denials.Coders in New England average 14 appealed denials per day, and coders in the Southeast average eightdenials appealed per day. Coders in the Rocky Mountains and Southwest average one denied claim perday, indicating that task may not be among their responsibilities.www.decisionhealth.com Toll-free: 1-855-CALL-DH1 Fax: 1-301-287-2535Two Washingtonian Center, 9737 Washingtonian Blvd., Ste. 502, Gaithersburg, MD 20878-7364
12Profile of a productive coderExperience and tools play roles in how productive coders are. But having more experiencedoesn’t necessarily mean being more productive, the survey shows.YEARS OF EXPERIENCE INMEDICAL TTEDDENIALSAPPEALEDLess than 1 year68563631 to 5 years9013711626 to 10 years1081151291111 to 20 years8392656More than 20 years6474363Coders with six to 10 years in medical administration have the highest daily averages of charts reviewed(108), claims submitted (129) and denials appealed (11).Their counterparts with one to five years in medical administration have the highest average of claimscoded at 137 a day.Coders with more than 20 years of experience in medical administration on average reviewed 44 fewercharts, coded 63 fewer charts, submitted 93 fewer claims and appealed eight fewer denials than the mostproductive coders.New coders — those with less than one year in medical administration — actually had similar numbersto those with more than 20 years of experience, with the exception of average claims coded per day. Newcoders code almost 20 fewer claims than their highly experienced counterparts.www.decisionhealth.com Toll-free: 1-855-CALL-DH1 Fax: 1-301-287-2535Two Washingtonian Center, 9737 Washingtonian Blvd., Ste. 502, Gaithersburg, MD 20878-7364
13CODER CERTIFICATIONSCoders who have taken the time to earn coding certifications have higher productivity averages thanthose who do not have certifications.Certified coders review 29 more charts, code almost double the number of claims and submit 14more claims per day on average than those who do not have certifications. Certifications that codersindicated they have include certified professional coder (CPC), ICD-10 certification, certified outpatientcoder (COC), certified coding specialist — physician based (CCS-P), registered health informationtechnician (RHIT), certified compliance professional — physician (CCP-P), certified cardiology coder(CCC), advanced coding specialist — anesthesia (ACS-AN), certified evaluation and management coder(CEMC), certified professional medical auditor (CPMA), advanced coding specialist — cardiology (ACSCA) and advanced coding specialist — radiology (ACS-RA), among ecisionhealth.com Toll-free: 1-855-CALL-DH1 Fax: 1-301-287-2535Two Washingtonian Center, 9737 Washingtonian Blvd., Ste. 502, Gaithersburg, MD 20878-7364
14RESOURCES CODERS USECoders use a variety of tools to help them increase accuracy and efficiency. Among them, online codingtools are used by 87% of coders, second to only official manuals (CPT , ICD-10, ASA Crosswalk).Online coding tools also are used more often than reference books (Answer Books, Coder’s DeskResourcescodersuseto dotheirReference,specialtyspecificbooks)and jobspayer/carrier websites.100%Official manuals87%Online coding tools72%Reference books70%Payer/carrier websites66%Newsletters63%Medical dictionary59%EHR56%Cheat XXXXXXXXXXXXXXXXXXXXIn fact, more than 80% of the most productive coders — the ones with one to five years or six to 10 yearsof medical-administration experience — use online coding tools, the survey shows.www.decisionhealth.com Toll-free: 1-855-CALL-DH1 Fax: 1-301-287-2535Two Washingtonian Center, 9737 Washingtonian Blvd., Ste. 502, Gaithersburg, MD 20878-7364
15Trends in coder responsibilityAssigning CPT or diagnosis codes to claims is the traditional role for a medical practicecoder, but that’s changing. A host of responsibilities are inching into coders’ job descriptions,according to surveys conducted by DecisionHealth from 2012 to 2016.Take note of these trends in new responsibilities:APPEALING DENIED CLAIMSCoders Responsibilites (2012 to 2016)10019% increase over 4 years8060%604041%45%50%51% Appealing denied claims: The percentage of coders20020122013201420152016performing this task has steadily increased from 2012 when41% of coders said they appeal denied claims to 2016 whenthe figure was 60%.BILLINGCoders Responsibilites (2012 to 2016)10024% jump from 2015 to 201679%8055%6054%40 Billing: Performing billing functions jumped 44% since2000%20120%20132014201520162014. In that year, 55% of coders said they completed billingtasks; in 2016, that number jumped to 79%. (Note: Thisoption was not offered as a response in 2012 or 2013.)www.decisionhealth.com Toll-free: 1-855-CALL-DH1 Fax: 1-301-287-2535Two Washingtonian Center, 9737 Washingtonian Blvd., Ste. 502, Gaithersburg, MD 20878-7364
16CONDUCTING AUDITS/INTERNAL REVIEWCoders Responsibilites (2012 to 2016)10080Subtle 2% increase by 201671%69%73%73%56%60 Conducting audits/internal review: This task was4020020122013201420152016common for coders in 2012 when 71% of them reportedconducting audits/internal review was part of their jobs.The number dropped to 56% in 2013 but climbed backup to 73% in 2016.FILING CLAIMSCoders Responsibilites (2012 to 2016)10017% increase over 4 years80604030%32%2012201339%40%47% Filing claims: Traditionally a billing function, this200201420152016task has become more common for coders to the pointin which almost half of coders in 2016 reported filingclaims as part of their jobs. Just 30% said so in 2012 —that’s a 17% increase over four years.PERFORMING COMPLIANCE-RELATED ACTIVITIESCoders Responsibilites (2012 to 2016)1005% rise over 2 years8074%76%79%60402000%0%20122013201420152016 Performing compliance-related activities: Becauseof the nature of medical practice coding, complianceis essential, but coders have been taking on morecompliance-related activities, according to the surveys.In 2014, 74% of respondents noted that they performedcompliance-related activities as part of their jobs; thatnumber increased to 79% in 2016. (Note: This optionwas not offered as a response in 2012 or 2013.)www.decisionhealth.com Toll-free: 1-855-CALL-DH1 Fax: 1-301-287-2535Two Washingtonian Center, 9737 Washingtonian Blvd., Ste. 502, Gaithersburg, MD 20878-7364
17QUERYING CLINICIANS ABOUT DOCUMENTATIONCoders Responsibilites (2012 to 2016)100808% climbover 2years89%93%97% Querying clinicians about documentation: Because60402000%0%20122013201420152016of the preparation for the switch to the ICD-10 code set,it’s not surprising that coders have increasingly foundthemselves asking clinicians for more details. Thepercentage of coders who asked clinicians for detailsrose from 89% in 2014 to 97% in 2016, the surveys show.(Note: This option was not offered as a response in 2012or 2013.)www.decisionhealth.com Toll-free: 1-855-CALL-DH1 Fax: 1-301-287-2535Two Washingtonian Center, 9737 Washingtonian Blvd., Ste. 502, Gaithersburg, MD 20878-7364
18ConclusionDecisionHealth’s surveys show that coding — assigning procedural or diagnosis codes to claimsbased on provider documentation — continues to be the main task of those with the title ofcoder or coding specialist.But they also show that coders and coding specialists need to expand their skills and take advantage ofresources to become efficient and productive at all of the tasks now under their purview.This report has shown these key elements of understanding medical coder productivity: Coder productivity is measured in a variety of ways but commonly charts reviewed, claimscoded, claims submitted and denials appealed. Coders average 89 claims coded per day, but thatnumber fluctuates depending on the specialty. The most experienced coders aren’t necessarily the most productive. The most productivecoders — those with the highest average number of claims coded per day — were those with oneto five years of experience. Successful coders are certified. Averages of productivity metrics are notably higher for coderswho have certifications — such as CPC, CCS-P, CCP-P and certified evaluation and managementcoder (CEMC). And almost all coders (93%) have a coding certification. Online coding tools are used more often than reference books and even payer/carrierwebsites. A full 87% of coders use online coding tools, making those tools the second most usedresource behind only official manuals.DEMOGRAPHICS:Of the 178 total survey takers, 90 respondents were coders All respondents (note that most of the data is coders only, but this is an overview of everyone):āā 33% have some college education but no degree, and 47% have a two-year or four-yearcollege degreeāā 66% have a coding certificationāā 97% are femalewww.decisionhealth.com Toll-free: 1-855-CALL-DH1 Fax: 1-301-287-2535Two Washingtonian Center, 9737 Washingtonian Blvd., Ste. 502, Gaithersburg, MD 20878-7364
19āā 74% are between ages 36 and 60āā 41% work for a physician-owned medical practice, 9% work for a health system, 9% workfor a multi-specialty groupāā 55% work 40 to 44 hours per week Just coders:āā 37% have some college education but no degree, and 44% have a two-year or four-yearcollege degreeāā 93% have a coding certificationāā 99% are femaleāā 78% are between ages 36 and 60āā 37% work for a physician-owned medical practice, 10% work for a hospital-owned practiceāā 71% work 40 to 44 hours per weekFor 30 years, DecisionHealth has been the industry’s leading source for coding, compliance and billing andreimbursement resources. From current news coverage, analysis and instructional guidance, medical practiceproviders and their staffs continue to rely on the high-quality information our unique blend of award-winningon-staff editorial professionals, health care executives and experts deliver day in and day out. From leadingbrands including Part B News, Coder’s Pink Sheets and SelectCoder, our customers are always well-equippedto make the best business decision on issues affecting their operations.SelectCoder is DecisionHealth’s all-in-one online coding solution that simplifies medical practice coderprocesses to save them time and improve practice profitability. With cutting edge features that improvecoder accuracy and productivity, they get to the right code faster to submit error-free clams and ensure fullreimbursement. No matter the provider size, specialty or location, SelectCoder has an access level to meetany medical practice’s needs and budget.www.decisionhealth.com Toll-free: 1-855-CALL-DH1 Fax: 1-301-287-2535Two Washingtonian Center, 9737 Washingtonian Blvd., Ste. 502, Gaithersburg, MD 20878-7364
Coding metrics by practice size, location The size of a coding department or the number of providers at the practice can affect coders' productivity metrics. SIZE OF CODING DEPARTMENT CODERS/BILLERS IN CODING/BILLING DEPT. CHARTS REVIEWED CLAIMS CODED CLAIMS SUBMITTED DENIALS APPEALED 10 or fewer 51 55 59 4 11 to 25 34 70 54 4 26 to 50 54 46 44 5