Transcription
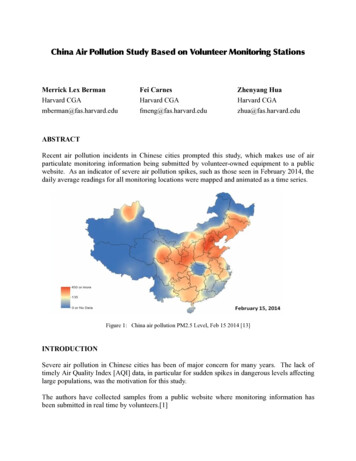
ationsMerrick Lex BermanHarvard CGAmberman@fas.harvard.eduFei CarnesHarvard CGAfmeng@fas.harvard.eduZhenyang HuaHarvard CGAzhua@fas.harvard.eduABSTRACTRecent air pollution incidents in Chinese cities prompted this study, which makes use of airparticulate monitoring information being submitted by volunteer-owned equipment to a publicwebsite. As an indicator of severe air pollution spikes, such as those seen in February 2014, thedaily average readings for all monitoring locations were mapped and animated as a time series.Figure 1: China air pollution PM2.5 Level, Feb 15 2014 [13]INTRODUCTIONSevere air pollution in Chinese cities has been of major concern for many years. The lack oftimely Air Quality Index [AQI] data, in particular for sudden spikes in dangerous levels affectinglarge populations, was the motivation for this study.The authors have collected samples from a public website where monitoring information hasbeen submitted in real time by volunteers.[1]
From the aquired data samples, the AQI indicator for 2.5 micron particulate matter [PM 2.5] wasnormalized into a series of daily average readings for each of the recorded monitor locations.The daily average maps, which reveal the areas suffering from low to high levels of airbornePM2.5, comprise a time series for the collection period.Subsequently, the time series was animated to provide a concrete visualization [2] of the dailychanges in PM2.5. The worst levels detected from the monitoring equipment correspond closelyto eyewitness reports from various media outlets.The raw data samples have also been made publicly available for further analysis. [3]DATA ACQUISITIONThere are a number of existing datasets acquired by remote sensing related to air qualitymonitoring. For example the data collected from multiple satellites in the NASA AIRS series arebased on global imagery at various scales, from 5km pixels to 50km pixels. The datasets,available in near-real time, are processed to provide information about aerosol components andoptical depth, or the degree to which the air is penetrable by the sensors. [4]Similarly, the NASA Ozone and Air Quality website makes available daily captures of remotesensing images processed to study various gases, aerosols and other properties of atmosphericpollution. [5] In addition to these sources there are numerous studies related to the aerosolconcentrations of black carbon. The U.S. EPA Report to Congress on black carbon pointed outthat remote sensing provides information about spatial variability of aerosol particulatesthroughout the entire atmospheric column, and needs to be combined with ground basedmonitors to adequately identify the areas of surface concentrations. [6]All of the remotely sensed data, in addition to requiring a large investment of pre-processingtime, is unable to detect conditions below the cloud cover or to detect the localized severity ofpollution levels within larger regions of general smog, or conditions within which the opticaldepth is too shallow to allow for any meaningful measurements to be acquired about conditionson the ground. In addition, the ground-based monitoring network mentioned in the EPA reportconsisted of some 200 monitors for the entire United States, while the number of monitors usedin China for the same report amounted to a mere handful.Figure 2: China ground monitoring stations for black carbon EPA Report, p.121 [6]2
Seeking alternatives to help us understand the recent air pollution events in China, we sought outany information available about air quality indicators on the ground. We found two initiativesthat provide near real time maps of Air Quality Indicator levels, one presumably sponsored bythe Chinese Environmental Survey Agency, called the National Urban Air Monitoring Platform[NUAMP] [7] and one non-governmental website, called Aqicn.org. [1]The NUAMP website provides a real-time map of cities and a graph showing the AQI level forcities that are selected by clicking on the map. This site was developed by the AdvancedTechnology Institute of Zhongshan University and the Guangdong Environmental Survey Center.When using this website, the AQI values shown in the graph, (or in a pop-up window for citieswith AQI above 100), do not seem to correspond to the detailed values shown for the specificreadings of either PM2.5 or PM10.The Aqicn.org website provides a real-time map of all monitor locations, arranged by cities, andfor which the raw monitor readings are provided. Upon investigation, the readings are based ona mashup of publicly available data being sourced from various providers such as the WeatherUnderground and various provincial or municipal environmental agencies in China; togetherwith real time data about particulate matter levels being acquired and contributed by volunteers.According the FAQ of the Aqicn.org website, [8] volunteers who purchased and installed acombination of the Dylos Air Particle Monitor [9] and the Rasberry PI hardware interface, [10]could install free software that automates the upload process from their own monitor to theAqicn server. [11]Although the monitoring readings from each Dylos unit being are automatically sent to the Aqicnserver, the raw data is only viewable in the form of webmaps or digital images on the Aqicnwebsite. Nonetheless, a closer examination of the published webpages showed that the AQIlevels could be found for each monitor location, including values for: PM2.5, PM10, O3, NO2,SO2, CO, as well as other temperature and weather indicators. We also found that by tracingeach webpage related to a particular monitor station over time, we could compile a snapshot ofthe values for a specific time of day.Based on the publicly available webpages, we then proceeded to automate a method forcapturing all the values found on the website under the China category. Even with an optimizedprocess, the assembly of one batch of data took several hours. Therefore we did not attempt tocollect a continuous stream of data, but to limit the collection samples to three times per day. Inconsultation with our colleagues at Harvard School of Public Health, we decided that the threesampling times (eight hours apart), should coincide with (1) the beginning of the morning rushhour, (2) the end of the work day, and (3) a middle-of-the-night sample. The exact time for eachbatch of AQI data being collected from each station varies slightly each day depending on theserver response conditions.Testing of the data collection was completed by late January 2014, and deployed beginningFebruary 7th 2014. Once launched, our data acquisition method for this project should continueto produce samples three times a day. Each complete batch of monitoring data is being saved in
plain-text, comma-delimited files, and compressed into time-stamped archives. All the data hasbeen made available for free public download. [3]DATA PROCESSING AND ANALYSISOwing to the unverifiable nature of the source data, and the incomplete coverage of monitoringstations across China, the processing and analytical approaches to the data that we could takewere limited. We could not, for example, attempt a gap analysis to fill in values for interveningareas where there were no monitors providing data. On the other hand, we did have somedetailed values to measure the presence of particulate matter several times per day for a set ofstations that fluctuated from in number from 700 to over 1000 stations at any given samplingtime. This was a sample on the order of 50 times larger than that EPA Carbon Study for China.Not being atmospheric scientists, we decided to focus only on the PM2.5 values. Even thoughmany other factors are obviously involved, we felt that the sampling of particulate matterreadings spread across more than 200 cities in China -- not available from any other source -justified taking a look at how the PM2.5 readings varied over space and time.Since we typically had three samples per day, we first calculated daily averages for PM2.5 foreach location. From the daily averages, we then performed a variety of spatial analysis methodsusing geographic information systems software (ArcGIS), to find an outcome most suited toshowing the variation over space and time for the PM2.5 values. We began with what hasbecome commonly referred to as a "heat map," which is a calculation based solely on the kerneldensity, or distance between locations. However, this type of kernel density analysis shows onlythe prevalence of where monitors are located. What we needed for this study was a way to showthe relative intensity of the PM2.5 values across space.For our purposes, geostatistical analysis using kriging interpolation presented the most intuitiveresult to visualize the air pollution concentrations from our dataset. Although the analysis isbased on air monitoring stations in China that are not evenly distributed across space, we foundother studies that had taken the same approach. [12] Of course, interpolation methods are alsogoing to be primarily skewed towards where the data is concentrated spatially, but it does offerthe normalization factor to smooth the resulting classes spatially based on a selected attribute.Therefore, by using the kriging interpolation, despite its drawbacks, the daily average readingsfrom the sensors could be visualized and their relative distribution and concentrations mapped.For each set of daily averages, the same interpolation with kriging, normalized on the PM2.5values was run, resulting in a set of maps for each day in February for which data was available.We then had a time series of PM2.5 concentration maps running from February 7th to February28th.Finally the maps were animated at the rate of one second per frame, so that the month ofchanging air pollution (using the proxy of daily average PM2.5 values) is seen in 30 seconds.The resulting video was published on Youtube. [2]4
REFERENCES[1] Aqicn.org. http://aqicn.org/[2] China Air Pollution (Feb 2014) Time Series Animation http://t.co/K1zCyQe0uW[3] China AQI Raw Data http://aqi.cga.harvard.edu/china/[4] NASA AIRS data. http://goo.gl/qGKqts[5] NASA Ozone and Air Quality http://ozoneaq.gsfc.nasa.gov[6] EPA Report on Black Carbon (2012): p129. .pdf[7] National Urban Air Monitoring Platform http://113.108.142.147:20035/emcpublish/[8] Aqicn FAQ e-counter-experimentation-part-1/[9] Dylos Air Particle Monitor http://www.dylosproducts.com/[10] Rasberry Pi http://www.raspberrypi.org/[11] Dylos Reader Scripts https://github.com/aqicn/dylos[12] "GIS to predict air pollution in mining region" Geospatial World, (Jul 2012) http://goo.gl/7jXXOt
Figure 1: China air pollution PM2.5 Level, Feb 15 2014 [13] INTRODUCTION Severe air pollution in Chinese cities has been of major concern for many years. The lack of timely Air Quality Index [AQI] data, in particular for sudden spikes in dangerous levels affecting large populations, was the motivation for this study.