Transcription
This is the author's version of an article that has been published in this journal. Changes were made to this version by the publisher prior to publication.The final version of record is available ging Static AnalysisLisa Nguyen Quang Do, Stefan Krüger, Patrick Hill, Karim Ali, and Eric BoddenAbstract—Static analysis is increasingly used by companies and individual code developers to detect and fix bugs and securityvulnerabilities. As programs grow more complex, the analyses have to support new code concepts, frameworks and libraries. However,static-analysis code itself is also prone to bugs. While more complex analyses are written and used in production systems every day,the cost of debugging and fixing them also increases tremendously.To understand the difficulties of debugging static analysis, we surveyed 115 static-analysis writers. From their responses, wedetermined the core requirements to build a debugger for static analyses, which revolve around two main issues: abstracting from boththe analysis code and the code it analyses at the same time, and tracking the analysis internal state throughout both code bases. Mosttools used by our survey participants lack the capabilities to address both issues.Focusing on those requirements, we introduce V ISUFLOW, a debugging environment for static data-flow analysis. V ISUFLOW featuresgraph visualizations and custom breakpoints that enable users to view the state of an analysis at any time. In a user study on 20static-analysis writers, V ISUFLOW helped identify 25% and fix 50% more errors in the analysis code compared to the standard Eclipsedebugging environment.Index Terms—Testing and Debugging, Program analysis, Development tools, Integrated environments, Graphical environments,Usability testing.F1I NTRODUCTIONIn 2017, Google took down over 700,000 malicious applications that were submitted to their Play Store [1], 99%of which were removed before anyone could install them.One of the techniques used in the vetting process of appstores –and by some third-party code developers is staticcode analysis, a method of automatically reasoning aboutthe runtime behaviour of a program without running it.As more complex applications are produced, more complexanalyses are also created to efficiently detect bugs and security vulnerabilities in those applications, hereafter referredto as the analyzed code. An error in the code of the analysescould have a large security impact on the applications madeavailable to the public every day: over 86,000 applicationswere released on the Google Play Store in April 2018 [2].Prior static-analysis research has yielded many novel algorithms [3], [4], [5], analyses [6], [7], and analysis tools [8],[9] to better support code developers and app stores. However, standard debugging tools [10], [11], [12] are often illsuited to help static analysis writers debug their analyses.Debugging static analysis comes with its own set of challenges, e.g. abstracting how the analysis code interpretsthe code it analyses and how the two code bases interactwith each other. Analysis writers have to handle specificcorner cases in two different code bases while also ensuring soundness and precision. Such tasks can be hard andtime consuming, making the development of new analysescumbersome in academia and industry.To provide better tools for developing and debuggingstatic analyses, we conducted a large-scale survey aimedat identifying the specificities of debugging static-analysiscode. In this survey, we determine the particular debuggingfeatures needed to debug static analysis. The survey identifies (1) common types of static analysis, (2) common bugsin static-analysis code, (3) popular debugging tools usedby analysis writers, (4) the limitations of those tools withrespect to debugging static-analysis code, and (5) desirablefeatures for a static-analysis debugger.We have implemented some of the debugging featuresfound in the survey for the most popular development environment —Eclipse, analysis framework —Soot [13]— andanalyzed language —Java— from the survey. We presentV ISUFLOW, a debugging environment for Soot-based staticanalysis that helps analysis writers better visualize andunderstand their analysis code while debugging it. A userstudy with 20 participants shows that the debugging features of V ISUFLOW help analysis writers identify 25% and fix50% more errors in static-analysis code compared to usingthe standard Eclipse debugging environment. The participants found the debugging features in V ISUFLOW moreuseful than their own tools for debugging static analysis.This article makes the following contributions: Lisa, Nguyen Quang Do, and Stefan Krüger, and Patrick Hillare with Paderborn University. Emails: lisa.nguyen@upb.de, stefan.krueger@upb.de, pahill@campus.uni-paderborn.deKarim Ali is with University of Alberta. Email: karim.ali@ualberta.caEric Bodden is with Paderborn University & Fraunhofer IEM. Email:eric.bodden@upb.deA comprehensive survey to motivate the need for bettertools to debug static analyses, and identify desirablefeatures that such tooling should provide.V ISUFLOW, a debugging environment integrated inEclipse for Soot-based static analysis.A user study to evaluate the usefulness of V ISUFLOWfor debugging static analyses and determine which ofthe desirable features that we have extracted from thesurvey are, in fact, useful for debugging static analysis.V ISUFLOW is available online, along with a video demo,and the anonymized survey and user study datasets [14].Copyright (c) 2019 IEEE. Personal use is permitted. For any other purposes, permission must be obtained from the IEEE by emailing pubs-permissions@ieee.org.
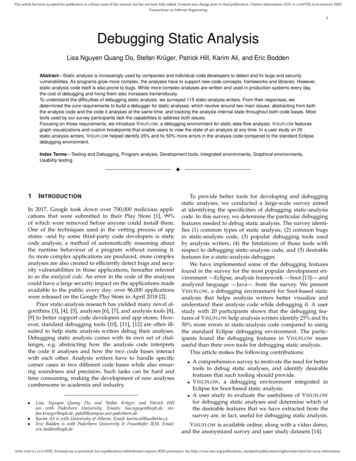
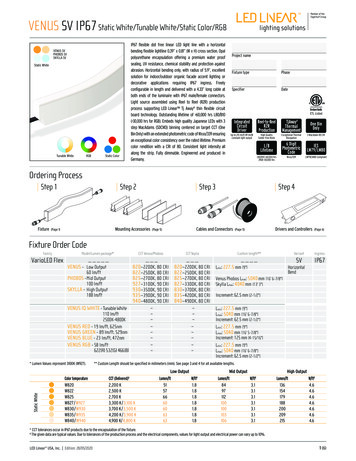
This is the author's version of an article that has been published in this journal. Changes were made to this version by the publisher prior to publication.The final version of record is available athttp://dx.doi.org/10.1109/TSE.2018.28683492S URVEYTo identify useful debugging features for static analysis,we conducted a large-scale survey of 115 static-analysiswriters. The goal of this survey is to understand the specificrequirements of debugging static-analysis code compared todebugging any kind of code that is not static-analysis code.We ask participants to contrast those two categories, referredto as analysis code and application code, which can range fromsmall test cases to large, complex systems.We aim to answer the following research questions:RQ1: Which types of analysis are most commonly written?RQ2: Do analysis writers think that analysis code is harder/easier to debug than application code, and why?RQ3: Which errors are most frequently debugged in analysis code and application code?RQ4: Which tools do analysis writers use to support thedebugging of analysis code and application code?RQ5: What are the limitations of those tools and whichfeatures are needed to debug analysis code?2.1Survey DesignThe survey contains 32 questions that we refer to as Q1–Q32, in the order in which they were presented to participants. In this section, we omit questions that are not relevantto the study presented in this article. We group the surveyquestions into the following 8 sections:1) Participant information (RQ1): Through multiplechoice questions, we asked participants for their affiliation (academia/industry) (Q1), how long they havebeen writing analyses (Q3), for which languages (Q4),and with which branches (Q6) and frameworks (Q9) ofstatic analysis that they have worked with.2) Debugging analysis code compared to applicationcode (RQ2): Q11 asks participants which type of codeis easier to debug on a scale from 1 (application code)to 10 (analysis code). Q12 asks them why, in free text.3) Debugging analysis code (RQ2–RQ3): Q13 asks participants how long they spend on writing analysis codecompared to debugging it on a scale from 0 (100% coding, 0% debugging) to 10 (0% coding, 100% debugging).In free text, Q15 asks for the typical causes of bugs thatthey find in analysis code.4) Tools for debugging analysis code (RQ4–RQ5): Infree text, we asked participants which features of theircoding environments they like (Q17), dislike (Q18), andwould like to have (Q19) to debug analysis code.5) Debugging application code (RQ2–RQ3): Q20 andQ21 mirror Q13 and Q15, for application code.6) Tools for debugging application code (RQ4–RQ5):Q23–Q25 mirror Q17–Q19, for application code.7) Specific debugging features (RQ5): Q26 asks participants to rate the importance of some debugging features on the following scale: Not important - Neutral Important - Very important - Not applicable.8) Coding environment (RQ4): Q28 asks participants ifthey primarily use a text editor (e.g., Vim, Emacs) oran IDE (e.g., Eclipse, IntelliJ). Q29 asks for the specificsoftware, in free text.Pilot Survey: We sent a pilot survey to 10 participantsand asked them for feedback about length, quality, 0Q21Q23Q24Q25Q26Q28Q292Fig. 1: Number of valid answers (gray) and “Others” answers (white) per question.understandability. As a result we shortened the survey from48 to 32 questions and grouped together the questions aboutanalysis code (becoming sections 3–4 in the survey) andapplication code (becoming sections 5–6 in the survey).2.2Result ExtractionWe manually classified the answers to the free-text questionsusing an open card sort [15]. Two authors classified theanswers into various categories, which were derived duringthe classification process. Responses that do not answer thequestion were classified in an “Others” category (e.g., “n/a”).We received a higher rate of answers that we classified into“Others” in the second half of our survey, due to the similarities of survey sections 3–4 and 5–6. In the latter sections,some participants were confused by the familiar questionsand did not notice that they now pertained to applicationcode. Answers such as “Already answered the question earlier”were thus classified into the “Others” category.To verify the validity of our classification, another author –who had not been part of the classification phase–sorted the answers in the categories derived during thefirst classification. We then compared the agreement between the two classifications. Since one answer could matchmultiple categories (e.g., “I use breakpoints and stepping.”matches both “Breakpoint” and “Stepping”), we calculateda percent agreement for each category of each question.The average percent agreement over all categories for allquestions is 96.3% (median 98%, min 65.2%, max 100%,standard deviation σ 0.05). Because of the imbalance inthe distribution of the answers, we ran into a paradox ofinter-rater agreement [16], making the Cohen’s Kappa [17]an unreliable statistic for this survey (average κ 0.66,median κ 0.7, min -0.08, max 1, σ 0.33).Due to optional questions and participants who did notfinish the survey, some questions received fewer answersthan others. Figure 1 reports the number of valid (gray) and“Others” (white) answers per question. In the following sections, the percentages reported for each question are basedon the number of valid answers for the particular question and not on all 115 answers. Participants could choosemultiple answers to the same multiple-choice question, andan answer to a free-text question could match multiplecategories. Therefore, the percentages for each question mayadd up to more than 100%. Although in this article, weonly report the most popular or relevant answers to thesurvey questions, we included all answers in our statisticaltests, and report on all significant results. All questions andanonymized answers are available online [14].Copyright (c) 2019 IEEE. Personal use is permitted. For any other purposes, permission must be obtained from the IEEE by emailing pubs-permissions@ieee.org.
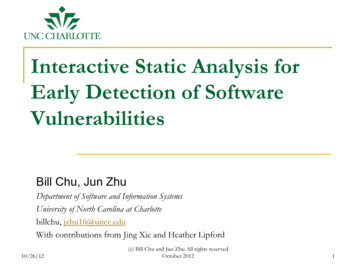
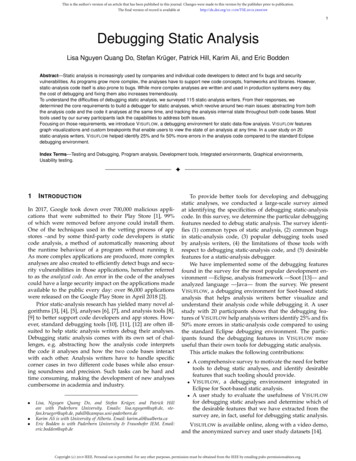
This is the author's version of an article that has been published in this journal. Changes were made to this version by the publisher prior to publication.The final version of record is available athttp://dx.doi.org/10.1109/TSE.2018.2868349325 %20 %15 %10 %5%0%TABLE 1: Reasons why static analysis is harder to debugthan application code (SA) and vice-versa (AC). EQ denotesthe reasons why both are equally difficult to debug. (Q12)12345678910HarderReasonSAAbstracting two types of codeGreater variety of casesMore complex structure of static analysis toolsEvaluating correctness is harderSoundness is harder to achieveIntermediate results are not directly accessibleStatic analysis is harder to debugEQBoth are application codeThey cannot be comparedNo opinionFig. 2: Ranking the difficulty of debugging static analysiscode compared to application code on a scale from 1 (staticanalysis is harder) to 10 (application code is harder). (Q11)2.3ParticipantsWe contacted 450 authors of static-analysis papers published between 2014 and 2016 at the following conferencesand their co-located workshops: ICSE, FSE, ASE, OOPSLA,ECOOP, PLDI, POPL, SAS. We received responses from 115researchers, 85.2% from academia and 15.7% from industry(Q1). Most participants are experienced static-analysis writers. Approximately 31.3% of the participants have 2–5 yearsof experience writing static analysis, 22.3% have 5–10 yearsof experience, 26.8% have more than 10 years of experience,and only 9.8% have less than 2 years of experience (Q3).2.4Results2.4.1 RQ1: Which types of analysis are most commonlywritten?We asked participants which programming languages theyanalyze the most (Q4), and received 3 main answers:Java (62.3%), C/C (59.4%), and JavaScript (23.6%). Lessthan 8% analyze each of the other 34 named languages.We also asked participants which branches of staticanalysis they write for (Q6). Data-flow analysis is the mostpopular (74.5%), followed by abstract interpretation (65.1%),symbolic execution (36.8%), and model checking (21.7%).Less than 4% use each of the 9 remaining categories.The most popular framework used to write static analysis (Q9) is Soot [13] (55.4%), followed by WALA [18] andLLVM [19] as second and third (31.1% and 21.6%, respectively). Less than 10% use each of the 32 other frameworks.RQ1: Java is the most analyzed programming language. Data-flow analyses are the most common typeof static analysis. Soot is the most popular framework.ACUsed to developing static analysisApplication code is more 6%6.0%2.4%for a piece of application code (57.5% writing and 42.5%debugging). A X 2 test of independence does not detectsignificant correlations (p 0.05) between the rating ofQ11 and the participants’ background (seniority, codinglanguages, editor type, or analysis frameworks).Table 1 classifies the reasons that participants gave whenasked why they found one type of code harder to debugthan the other (Q12). In this article, we only report thereasons mentioned by more than one participant. The mainreason that participants find analysis code harder to debugis the complexity of handling two code bases (i.e., the analysis code and the application code that is being analyzed)at the same time: “Static Analysis requires to switch betweenyour analysis code and the Intermediate Representation whichyou actually analyse”. This complexity creates more cornercases that the analysis writer must handle. Another reasonis that correctness is harder to define for a static analysis. Toquote a participant: “‘correct’ is better defined [in applicationcode]”. The final reason is that intermediate results of theanalysis are not directly verifiable in contrast to the outputof application code that can be directly validated: “Staticanalysis code usually deals with massive amounts of data. [.]It is harder to see where a certain state is computed, or evenworse, why it is not computed.”Participants who find analysis code and application codeequally hard to debug have two main arguments. First, bothare application code: “a static analyzer is an application, albeita sophisticated one”. Second, they are so different that theycannot be compared: “These two difficulties are qualitativelydifferent and hence incomparable.”2.4.2 RQ2: Do analysis writers think that analysis code isharder/easier to debug than application code, and why?Q11 asks participants to rate how hard debugging analysiscode is compared to debugging application code on a scalefrom 1 (analysis code is harder to debug) to 10 (application code is harder to debug). The average ranking is 4.0(standard deviation σ 2.1). Figure 2 shows that 50.5% ofthe participants find static-analysis harder to debug thanapplication code, 28.2% are neutral, and 9.5% think thatapplication code is harder to debug. This is confirmed inQ13 and Q20 where participants reported that they spentmore time debugging a piece of static-analysis code (53.2%of their time) than writing it (46.8%), and the contraryParticipants who find application code more difficult todebug argue that it is more complex than static-analysiscode, and thus contains numerous corner cases: “Staticanalysis code usually includes very limited number of possiblecases.” Some participants also wrote that the reason whythey find application code harder to debug is that they areused to developing static analysis.RQ2: 5.3 more participants found analysis codeharder to debug than application code. This is due tothree main reasons: handling two code bases simultaneously, correctness requirements for static analysis,and the lack of support for debugging analysis code.Copyright (c) 2019 IEEE. Personal use is permitted. For any other purposes, permission must be obtained from the IEEE by emailing pubs-permissions@ieee.org.
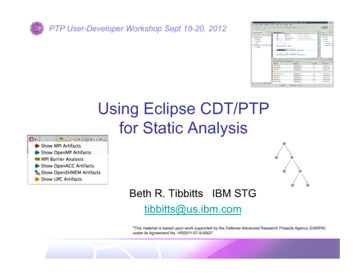
This is the author's version of an article that has been published in this journal. Changes were made to this version by the publisher prior to publication.The final version of record is available athttp://dx.doi.org/10.1109/TSE.2018.2868349480 %60 %Static AnalysisApplication CodeTABLE 2: Useful features for debugging static analysis (SA)and application code (AC) for IDE users (IDE) and texteditor users (TE). (Q17 and Q23)40 %20 %0%sseeedgrrorases rroratch cturer c ming e hmic e knowl mism frastrunrsCo ram goritaing innticgAlDom Sema derlyinProUnFig. 3: The root causes of errors found when debuggingstatic analysis and application code. (Q15 and Q21)2.4.3 RQ3: Which errors are most frequently debugged inanalysis code and application code?We asked participants for the typical root causes of errorsthey find when debugging analysis code (Q15) and application code (Q21), and classified them in the six categoriesshown in Figure 3. When debugging analysis code, themain cause of errors is handling corner cases. This category includes overlooked cases that the developer normallyknows of (e.g., “Forgot to consider the effect of certain, rareinstructions”). Domain knowledge refers to code behaviour thatthe developer is unaware of (e.g., “Unexpected values returned by an API”). Programming errors occur twice as often inapplication code than in static-analysis code. This categoryincludes implementation errors such as “wrong conditions,wrong loops statements”. Algorithmic errors contains errorsdue to a wrong design decision in the program’s algorithm(e.g., a “non-convergence” of the analysis), which happens3.5 more often in analysis code than in application code.Semantics mismatch and underlying infrastructure are specificto static analysis. The former refers to how the analysisinterprets the analyzed code (e.g., “The code does not take[into] account the abstract semantics correctly”). The latter issimilar to domain knowledge, but instead of the knowledge ofthe analyzed code, it is about the analysis framework (e.g.,“Can’t load classes/methods successfully.”).While bugs in application code are mainly due to programming errors, static-analysis bugs are distributed overmultiple categories. We attribute this to the heightenedinterest of analysis writers to produce correct analyses.Testing functional correctness typically requires validatinginput/output relationships. For analysis code, those relationships are always imperfect due to necessary approximations. Hence, it is hard to define functional correctnessfor static analysis. Moreover, handling two code bases isalso the cause of analysis-specific errors: more corner cases,semantics mismatch and underlying infrastructure. Becauseof the specific requirements of static analyses, the bugs thatdevelopers investigate in application code have differentcauses compared to analysis code, thus motivating the needfor proper support of those specific categories of errors.RQ3: Analysis code is more often debugged thanapplication code for corner cases, algorithmic errors,semantics mismatch, and unhandled cases in the underlying analysis infrastructure.PrintingBreakpointsDebugging toolsCoding supportVariable inspectionAutomated testingExpression 3333333Memory toolsGraph visualizationsSteppingType checkerHot-code replacementVisualizationsStack tracesDrop framesDocumentation3333333333332.4.4 RQ4: Which tools do analysis writers use to supportdebugging of analysis code and application code?In Q28 and Q29, 56% of the participants answered that towrite analysis code, they use an Integrated DevelopmentEnvironment (IDE) such as Eclipse [10] (used by 28%) orIntelliJ [11] (17.3%), while 42.7% use text editors such asVim [20] (33.3%) or Emacs [21] (21.3%). Each of the other21 tools is used by less than 10% of the participants.We asked participants about the most useful features oftheir coding environments when debugging analysis code(Q17) and application code (Q23). Table 2 shows the features mentioned by more than one participant. The mostpopular debugging feature is Breakpoints, used by 35.2% ofparticipants when debugging application code and 28.2%for analysis code. Coding support (e.g., auto-completion) isappreciated by 29.6% when writing analysis code, and 20.4%for application code. Variable inspection is used by 27.8%when writing application code and 19.7% when writinganalysis code. Debugging tools (e.g., “GDB/JDB”) are used by20.4% when writing application code, and 16.9% for analysiscode. 21.1% of the participants print intermediate results whendebugging analysis code, compared to 13.0% for applicationcode. IDE users highlighted IDE-specific features such astype checkers, stepping, and hot-code replacement.A X 2 test of independence shows a strong correlationbetween the type of editor used (IDE or text editor) andthe most useful features of the debugging environment (p 0.01 0.05) for application code. The test does not find sucha correlation for analysis code, indicating that the debuggingfeatures used when writing analysis code are the same in alltypes of coding environments.RQ4: Regardless of the coding environment, analysiswriters use the same debugging features to debuganalysis code and application code, e.g., breakpoints,variable inspection, coding support, and printing intermediate results.Copyright (c) 2019 IEEE. Personal use is permitted. For any other purposes, permission must be obtained from the IEEE by emailing pubs-permissions@ieee.org.
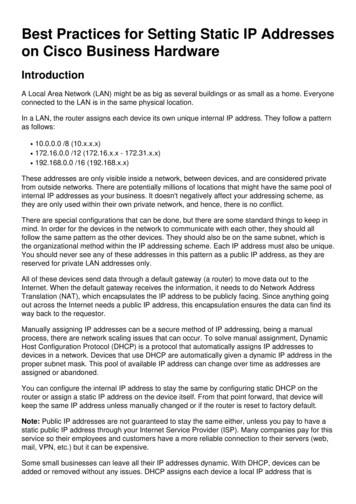
This is the author's version of an article that has been published in this journal. Changes were made to this version by the publisher prior to publication.The final version of record is available athttp://dx.doi.org/10.1109/TSE.2018.28683495TABLE 3: Unsatisfactory features when debugging staticanalysis (SA) and application code (AC) for IDE users (IDE)and text editor users (TE). (Q18 and Q24)Debugging toolsImmediate feedbackCoding tiple environmentsIntermediate resultsHandling data structuresSupport for system setup77ScalabilityVisualizationsConditional breakpointsMemory toolsBad documentation7777TABLE 4: Requested features when debugging static analysis (SA) and application code (AC) for IDE users (IDE) andtext editor users (TE). (Q19 and Q25)SA/IDESA/TE3333333Graph visualizationsOmniscient debuggingVisualizationsHot-code replacementCoding supportTest generationDebugging toolsIntermediate resultsConditional breakpointsHandling data structuresAC/IDEAC/TE3333333377Not ImportantNeutralImportantVery ImportantN/A100 %2.4.5 RQ5: What are the limitations of the existing debugging tools and which features are needed to debug analysiscode?Q18 and Q24 ask participants about the features of theircoding environments they dislike when debugging analysiscode and application code, respectively. Features mentionedby more than one participant are shown in Table 3.To our surprise, two of the most disliked features—debugging tools (disliked by 29.5% when debugging analysiscode and 25% when debugging application code) and codingsupport (18.2% for analysis code and 25% for applicationcode)—are also among the most used and appreciated. Thissuggests that although current tools are useful, analysiswriters require more specific features to fully support theirneeds. For example, a participant wrote: “While the IDE canshow a path through [my] code for a symbolic execution run,it doesn’t show analysis states along that path.” Therefore,debugging tools for static analysis could be improved byshowing more of the intermediate results of the analysis.For application code, participants requested more supportfor handling different systems and environments. Participants complained about the “manual work to setup complexbuild/test systems” and “Dealing with an external dependency[.] that I cannot control”. Participants using an IDE to writeanalysis code find that debugging tools are not scalable,lack visualizations of analysis constructs (e.g., “It’s mostly textbased”), and need special breakpoints (e.g., “Missing an easyway to add a breakpoint when the analysis reaches a certainline in the input program (hence having to re-run an analysis)”).RQ5-1: Current static-analysis debugging tools lackimportant features such as showing intermediate results, providing clear visualizations of the analysis,and special breakpoints.To identify which debugging features would best support static-analysis writers, we asked participants to suggest useful features for debugging analysis code (Q19) andapplication code (Q25). Table 4 shows the features thatare mentioned more than once. The requested debuggingfeatures for application code and analysis code are quitedifferent. To write application code, participants requestedbetter hot-code replacement and coding support (e.g., “better75 %50 %25 %0%hrapGals intsIR suals dates rationingvisu eakpo Steppr vi ck up geneerBOth Qui TestFig. 4: Ranking the importance of features for debuggingstatic analysis. IR is "Intermediate representation". (Q26)support to record complex data coming from external services”).For analysis code, 18.4% of participants asked for bettervisualizations of the analysis constructs, and 23.7%, for graphvisualizations: “Easier way to inspect ‘intermediate’ result of ananalysis, easier way to produce state graphs and inspect themwith tools.” Omniscient debugging was requested by 13.2% ofparticipants to help show the intermediate results of theanalysis: “Stepping backwards in the execution of a program”.Participants also requested better test generation tools andspecial breakpoints (RQ5-1).A X 2 test on the features of Table 4 shows a correlationbetween the features requested by participants and the typeof code (analysis code or application code) (p 0.04 0.05), motivating the need for specific tooling for debuggingstatic analysis code in particular. The same test did notyield significant p-values in the case of debugging featuresthe users liked/disliked, indicating that they use the samedebugging features for analysis code and application code.In Q26, participants evaluate the importance of thedesirable debugging features. Figure 4 shows that graphvisuals, access to the intermediate representation count asvery important features, along with breakpoints and steppingfunctionalities that consider both the analysis code and theanalyzed code. Other types of visuals, better test generation,and quick updates are considered important.RQ5-2: The most important features for debugginganalysis code are (graph) visualizations, access to theintermediate representation, omniscient debugging,and special breakpoints.Copyright (c) 2019 IEEE. Personal use is permitted. For any other purposes, permission must be obtained from the IEEE by emailing pubs-permissions@ieee.org.
This is the author's version of an article that has been published in this journal. Changes were made to this version by the publisher prior to publication.The final version of record is available mmary and DiscussionOur survey shows that writing static analysis entails specificrequirements on the writer. Handling two code bases anddefining soundness makes analysis code harder to debugthan general application code (RQ2). Those requirementscause different types of bugs to be of interest to staticanalysis writers when debugging (RQ3). To debug theircode, analysis writers mainly use the traditional debugging features included in their coding environments suchas breakpoints and variable inspection (RQ4). While thosetools are helpful, they are not sufficient to fully supportthem: debugging features such as simple breakpoints fallshort and force analysis writers to handle parts of thedebugging process manually (RQ5-1).Table 2 shows that the debugging tools that analysiswriters currently use are adapted for more general application code. Table 4 shows that the features needed to debuganalysis code are quite different from the features neededto debug application code. Those features revolve aroundimproving the visibility of how the analysis code representsand analyses the analyzed code. The desirable features fordebugging analysis code are (RQ5-2)
in static-analysis code, (3) popular debugging tools used by analysis writers, (4) the limitations of those tools with . We have implemented some of the debugging features found in the survey for the most popular development en-vironment —Eclipse, analysis framework —Soot [13]— and analyzed language —Java— from the survey. We present