Transcription
VRT Testing – What Makes BullsEyeBetter and Different from the rest(Our competitive Advantage)December 16th, 2015
Table of Contents1.Purpose . 32.What a typical internet speed test measures. . 43.What a BullsEye VRT TCP Test Measures. . 54.What a BullsEye VRT VoIP Test Measures. . 115.Summary . 152VRT Testing, What makesBullsEye different from the rest
1.PurposeThe purpose of this document is to demonstrate why the BullsEye “VRT Testing Tool” is a far superiortesting tool compared to other service providers and SaaS IT integrators. BullsEye specializes inproviding traditional POTS as well as Integrated Voice (analog to Digital, SIP, Hosted and UnifiedCommunications). Over the past two decades, hundreds of carriers have proved to be lacking whenqualifying a new customer for these services. When asked about VoIP services, 50% of businessowners state that the lack of qualification of these services has created a very negative view of theVoIP product.Understanding these differences is BullsEye’s competitive advantage and should be understood whenassisting companies in selecting VoIP and which carrier to use to provide said services. This whitepaper will also answer many questions regarding why our results do not match conventional internetspeed test results such as http://www.Speedtest.net, https://www.speakeasy.net/speedtest/,or http://www.bandwidthplace.com/. BullsEye has invested millions creating a testing tool and aselect team of professionals in order to complete comprehensive evaluations of your internet service.Using the "VRT Testing Tool", BullsEye can simulate the additional bandwidth required for your newservices and then measure the results to ensure all problems are addressed prior to installation andfinal cutover of business critical communication tools.The following areas will be reviewed and valued information will be given to assist businesses withwhat questions to ask when making their digital transition. The benefits of Integrated VoIP and UCservices within your day to day work place, as well as documentation of monumental cost savingsalong with reduced CAPEX yearly spend are also important items covered on our websiteat http://www.bullseyetelecom.com. What a typical speed test measures (our competitors)What a BullsEye VRT TCP test measuresWhat a BullsEye VRT VoIP test measures3VRT Testing, What makesBullsEye different from the rest
2.What a typical internet speed test measures.A typical internet speed test, such as http://www.speedtest.net, measures connectivity to a serverthat is close in proximity to the customers’ location. This test consists of multiple subtests: Latency,Download, and Upload.Latency The round-trip time between the customer’s location and the closest speed test server.Repeats this test multiple times and uses the lowest value for the final result.Download Establishes multiple connections with the server over port: 8080. The client requests the serverto send an initial chunk of data.The client calculates the real-time speed of the transfers, and then adjusts the chunk size andbuffer size based on this calculation to maximize the usage of the network connection.As the chunks are received by the client, the client will request more chunks throughout theduration of the test.During the first half of the test, the client will establish extra connections to the server if itdetermines additional threads are required to more accurately measure the download speed.The test ends once the configured amount of time has been reached.Upload The client establishes multiple connections with the server over the defined port and sends aninitial chunk of data.The client recalculates the real-time speed of the transfers and adjusts the chunk size and buffersize based on it to maximize the usage of the network connection, and requests more data.As the chunks are received by the server, the client will send more chunks throughout theduration of the test.During the first half of the test, the client will establish extra connections to the server if itdetermines additional threads are required to more accurately measure the upload speed.The test ends once the configured amount of time has been reached.To calculate the results the server then takes all samples and sorts then by speed. The two fastestspeed test results are removed from the calculation and the remaining tests are averaged to producethe total that is presented on the screen.4VRT Testing, What makesBullsEye different from the rest
3.What a BullsEye VRT TCP Test Measures.A BullsEye VRT internet TCP test, also call MySpeed, test shows a more detailed set of information than anormal speed test. The TCP test summary page shows: Per session download speed – This number is in Kbps and shows the actual amount of data a userwith a single session out to the internet can use. To get this number, it takes 1000 which is 1 secondin milliseconds, and divides it by the average round trip time. It then multiplies this number by 520which is the average frame size.Per session upload speed – This number is usually reflective of the actual upload rate for thecustomer in an asymmetrical connection.Consistency of service for download – This percentage shows how consistent the download servicewas for the period of time that the test was run.Consistency of service for upload - This percentage shows how consistent the upload service was forthe period of time that the test was run.Minimum round trip time – This number in “ms” shows the lowest achieved round trip time for thetest that was run.Maximum round trip time - This number in “ms”’ shows the highest achieved round trip time for thetest that was run.Average round trip time - This number in “ms” shows the average achieved round trip time for thetest that was run.Consistency of the round trip time – This number shows if there were any major fluctuations in theround trip time from test start until test end.Max delay – This number in “ms” shows the maximum length of time the client is waiting for data toarrive.Average delay - This number in “ms” shows the average length of time the client is waiting for data toarrive.Effective Speed – This number in “Kbps” shows what the bandwidth of the customer’s circuit actuallyis. This takes the Download Speed and multiplies it by the route concurrency to get this result.Route Speed – This number is the maximum TCP application throughput speed attainable betweenthe client and the server because of the routing that is being used.Forced Idle – This number is the percentage of time your connection is waiting to send or receivedata, versus the amount of time data is actually being sent.Route concurrency – This shows how many TCP socket sessions or connections can be used on thecircuit being tested when MAXED OUT.5VRT Testing, What makesBullsEye different from the rest
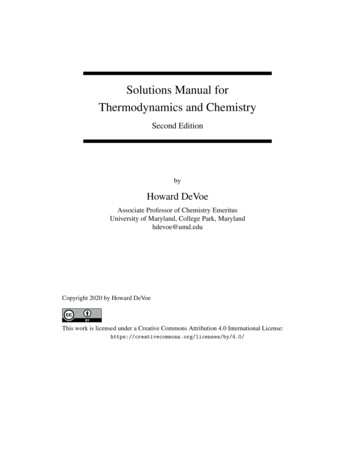
A sample summary for a TCP/MySpeed test is shown in the image below.One of the primary benefits of using the BullsEye TCP VRT test over a normal speed test is the graphing.Below is a sample TCP Transfer Speed test for download/upload and a sample TCP Pause graph fordownload/upload. For each image there is a description of what that image is showing.6VRT Testing, What makesBullsEye different from the rest
TCP Download Transfer Speed:This graph shows the Download TCP transfer rate in Mbps that this customer is achieving. Throughthe use of graphing, one can see the fluctuation in throughput over an 8 second period (8000ms) intime. A typical TCP speed test would not show this because it is just filling the circuit to capacity butnot analyzing every MS during the test. This data is extremely valuable and differentiates BullsEye’stesting compared to users such as Speedtest.com.7VRT Testing, What makesBullsEye different from the rest
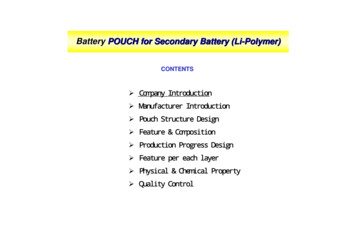
TCP Upload Transfer Speed:This graph shows the Upload TCP transfer rate in Mbps that this customer is achieving. In this graphit can be seen that the transfer rate fluctuates a great deal and even drops off to 0Mbps at times.8VRT Testing, What makesBullsEye different from the rest
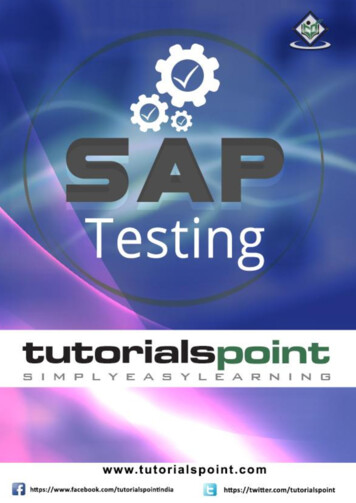
TCP Download Pause:This graph shows the Download TCP pause that this customer is experiencing. In this graph a gooddeal of pause can be seen across the board and the pause never really drops below around 30msduring the test. This also very accurately depicts the USER experience.9VRT Testing, What makesBullsEye different from the rest
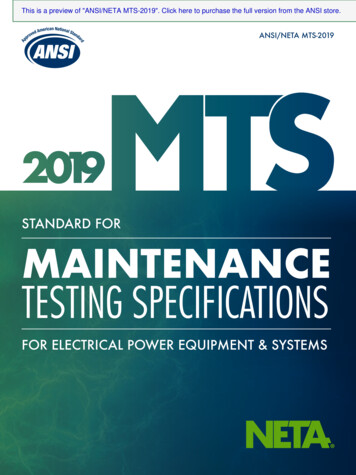
TCP Upload Pause:This graph shows the Upload TCP pause that this customer is seeing. In this graph there is TCP pausethat reaches up to 80 ms. This can be seen side-by-side in the TCP Upload Transfer Speed graphwhere the transfer speeds for upload drop off to “0”. By showing the Pause (time between positivelyacknowledged packets), you can easily see regulation when pause patterns are observed at aconsistent time or speed value)10VRT Testing, What makesBullsEye different from the rest
4.What a BullsEye VRT VoIP Test Measures.The BullsEye VRT VoIP test shows a great deal of information pertaining to voice calls and SIP traffic. Itemsthat are shown on the VoIP test summary area are: Upstream jitter – From an upstream perspective, the variation in packet transmission delay.Downstream jitter – From a downstream perspective, the variation in packet transmission delay.Upstream max jitter – From an upstream perspective, the most jitter that was seen on the test.Downstream max jitter – From a downstream perspective, the most jitter that was seen on the test.Upstream packet loss – A percentage showing how many packets never reached the VRT server.Downstream packet loss – A percentage showing how many packets never reached the VRT client.Upstream packet order – A percentage showing how many packets arrived in order to the VRT server.Downstream packet order – A percentage showing how many packets arrived in order to the VRTclient.Packet discards – A measure of packets that arrive too late to be used by the application.MOS – A measure from 1(worst) to 5(best) rating the quality of the call.Register ms – Length of time it took to send/receive the register message.Invite ms – Length of time it took to send/receive the invite message.Bye ms – Length of time it took to send/receive the bye message.RTTMin - This number in ‘ms’ shows the lowest achieved round trip time for the test that was run.RTTAvg - This number in ‘ms’ shows the average achieved round trip time for the test that was run.RTTMax - This number in ‘ms’ shows the highest achieved round trip time for the test that was run.RTT Consistency - This number shows if there were any major fluctuations in the round trip time fromtest start until test end.Upstream loss distribution – From an upstream perspective, a percentage that shows if there was atight grouping of lost packets or if it was spread out over the length of the test.Downstream loss distribution - From a downstream perspective, a percentage that shows if therewas a tight grouping of lost packets or if it was spread out over the length of the test.SIP ALG – This shows if the SIP application layer gateway is on (Y) or off (N). Most all VoIP will notwork correctly if SIP ALG is on in the customer’s firewall, router, or ISP modem.11VRT Testing, What makesBullsEye different from the rest
A sample summary for a VRT VoIP/MyVoIP test is shown in the image below. Notice SIP ALG displays“Y” for Yes.A BullsEye VoIP test graphs jitter and packet loss. Below are a sample graph for upstream anddownstream and a brief description of what can be read from each example.12VRT Testing, What makesBullsEye different from the rest
VoIP Upstream Jitter and Packet Loss Test:This graph shows packet loss up to 15% over the course of the test.13VRT Testing, What makesBullsEye different from the rest
VoIP Downstream Jitter and Packet Loss Test:This graph shows no packet loss on downstream.14VRT Testing, What makesBullsEye different from the rest
5.SummaryIn summary, there are several key differences in the BullsEye TCP and VoIP tests as compared to a typicalspeed test that near all carriers use. The BullsEye TCP Speed and UDP VoIP/Capacity testing allow for amuch deeper inspection of potential issues. We review the relationship of TCP to UDP traffic which isparamount when using a single circuit for both VoIP and data needs. Lastly, measuring circuit performancefrom an internet user perspective and then subsequent verification of remediation when issues arecorrected is a key to the continuous quality connection we provide despite the ever changing circuitperformance.For more information on the BullsEye VRT test, please read our Standards VoIP Readiness document onthe Field Forces SharePoint page.15VRT Testing, What makesBullsEye different from the rest
that is close in proximity to the customers' location. This test consists of multiple subtests: Latency, Download, and Upload. Latency The round-trip time between the customer's location and the closest speed test server. Repeats this test multiple times and uses the lowest value for the final result. Download