Transcription
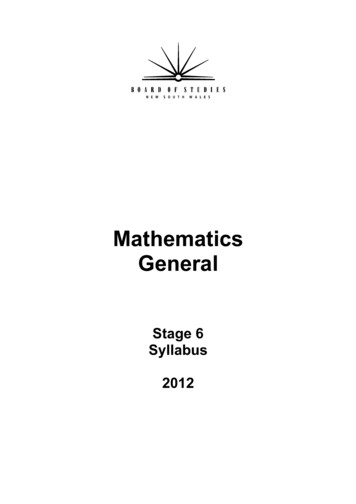
Paul Calter108 Bluebird LaneRandolph Center, VT05061 USApcalter@sover.netkeywords: arch, St.Louis Arch, EeroSaarinen, Gateway tothe West, GatewayArch, catenary,parabola, hanging chainResearchGateway to MathematicsEquations of the St. Louis ArchAbstract. Eero Saarinen's Gateway Arch in St. Louis has the form of acatenary, that is, the form taken by a suspended chain. The catenary canbe reproduced empirically, but it can also be precisely formulatedmathematically. The catenary is similar to the paraboloid in shape, butdiffers mathematically. Catalan architect Antoni Gaudi used thecatenary to great effect in his Church of the Sagrada Familia inBarcelona, but he also used the paraboloid as well.An arch consists of two weaknesses which, leaning one against the other, make astrength.Leonardo da VinciIntroductionWhen building a circular masonry arch, a builder was likely to construct awooden form on which the stones or bricks were laid, the shape being traced withpegs and string or a radius bar. But for larger arches, and those made of steel,fabricated at a steelyard and assembled on-site, it is useful to work from anequation. If fact, equations of geometric figures like the circle were not evenavailable until René Descartes developed analytic geometry in the seventeenthcentury.Fig. 1.NEXUS NETWORK JOURNAL – VOL. 8, NO. 2, 2006 53Nexus Network Journal 8 (2006) 53-661590-5896/06/020053-14 DOI 10.1007/s00004-006-0017-7 2006 Kim Williams Books, Firenze
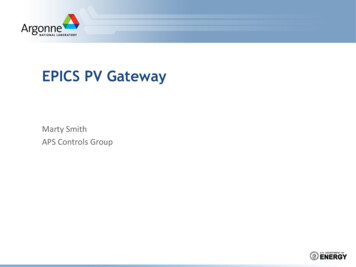
An equation of the arch will give the height y of any point on the arch at a givenhorizontal distance x. Both distances are measured from chosen axes. An equationis, of course, meaningless unless one knows the x and y axes, and the origin, thepoint where they intersect.For example, here are the equations for the circular, pointed, parabolic andelliptical arches shown in fig. 1, if the axes are placed as shown. Changing theposition of an axis would change the equation.Circular:y r 2 x2One side of Pointed:y r 2 x2Elliptical:y b 1 Parabolic:x2a2y kx 2Note that for the parabola, we have taken the origin at the vertex of the curve,and the positive y axis vertically downward.Turning to the St. Louis arch, note that we have three curves, for the intrados,the extrados, and the centerline (fig. 2). What I call the centerline is the curveconnecting the centroids of the cross-section.Fig. 2.54PAUL CALTER – Gateway to Mathematics: Equations of the St. Louis Arch
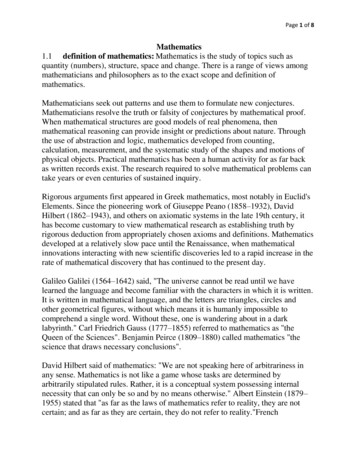
The cross-section of the arch is an equilateral triangle, whose centroid is at theintersections of the three medians (fig. 3). For an equilateral triangle, that samepoint is also the orthocenter (the intersections of the altitudes) the incenter(intersection of the angle bisectors) and, for good measure, the circumcenter(intersection of the perpendicular bisectors of the sides.)Fig. 3.The CatenaryThe published equation of the centerline of the St Louis arch, with the constantsrounded to three digits, isy 68.8(cosh 0.01 1)Let us break it down. First, what is a cosh? It is one of the six hyperbolicfunctions. The hyperbolic functions are analogous to the circular functions, butare based on the hyperbola rather than the circle. In particular, the hyperboliccosine is defined ascosh ax e ax e ax2So with a 0.01, our arch equation becomes e 0.01x e 0.01x 1 y 68.8 2 Fig. 4 shows the graph of that equation. Notice that the curve opens upwards,but we can correct that simply by inverting the curve. We then take the origin atthe high point, with the y axis downward and along the centerline of the curve.NEXUS NETWORK JOURNAL – VOL. 8, NO. 2, 2006 55
Fig. 4.The constants in the arch equation, 68.8, 0.010, 2, and –1, serve to scale thecurve to the proper height and width, and to shift the curve vertically. Let usdisregard them, just for now, and try to make sense of the catenary equation.To our arch equation, in simplified form becomesy e x e xNow this equation may still be daunting to some, so I will try to break it down,explain each piece, and then put it back together.Exponential GrowthLet us start with that letter e. It is not like the constant a in our earlierequation, that stands for any constant value. It is a very special number, and has aparticular value.There are different ways to arrive at the value of this number e, but perhaps themost intuitive starts with the familiar idea of compound interest, like that given bya bank.If you invest P dollars at an interest rate n, you would have an amount y after xyears,56PAUL CALTER – Gateway to Mathematics: Equations of the St. Louis Arch
y P (1 n )x dollarsFor example, 500 invested at 6.5% for 8 years givesy 500(1 0.065)8 827.50For this example, the interest was compounded once a year.Now suppose we compound interest m times per year. We would now have mxinterest periods, but for each the interest rate would be n/m.n y P 1 m mxRepeating our example with interest compounded monthly gives12(8 ) 0.065 y 500 1 12 893.83or another 12.33.Fine, but what does this have to do with the number e ? We will see if we nowask, what if the interest were not computed in discrete steps, but continuously?Suppose m were not 12 or 365 or 1000, but infinite.Let us make the substitutionk mnso that our equation for compound interest becomes1 y P 1 k knx,which can be writtenk 1 y P 1 k nx.Now as m gets very large, and k also gets very large, what happens to thequantity inside the brackets? Let us calculate some values.NEXUS NETWORK JOURNAL – VOL. 8, NO. 2, 2006 57
k1 1 1 k 0100002.71828kWe get the surprising result that as m becomes infinite, the value of theexpression in the brackets settles down to a specific value, about 2.7183. Thatvalue is called e.Now replacing (1 1 k )k by e in our formula for compound interest gives theformula for continuous growth or exponential growth:y Pe nx .Does that look familiar? Its one of the expressions in our arch equation, with P 1 and n 1.Populations offer an example of exponential growth; the greater the populationthe faster it grows, orThe rate of growth is proportional to the amount.Fig. 5 is a graph of exponential growth, with P 1 and n 1.Fig. 5.58PAUL CALTER – Gateway to Mathematics: Equations of the St. Louis Arch
Exponential DecayNow lets look at the other term in the catenary equation, e x . The minus signin the exponent is all that is needed to change the equation from describingexponential growth into one that describes exponential decay (fig. 6).Fig. 6As an example, take a hot cup of coffee. It is the temperature differencebetween the coffee and the room air that drives heat out of the coffee. As thecoffee cools, the temperature difference decreases, so the rate of temperature dropdecreases. As with population growth,The rate of change of temperature is proportional to the temperature T.In calculus notation,dTdt kTThe Hanging ChainNow let us plot the growth and decay curves on the same axes, and also graphtheir sum. Note that the sum of the growth and decay curves combine to formthe catenary.The seventeenth-century Dutch mathematician Christian Huygens named thecurve catenarius, after the Latin word for chain. The reason for that name is thatthis curve describes the shape of a uniform chain or flexible rope hanging from twopoints.What does a hanging chain have to do with exponential growth and decay?NEXUS NETWORK JOURNAL – VOL. 8, NO. 2, 2006 59
Let us look at the forces on a small section of cable. Fig. 7 shows the tensionsTU and T resolved into vertical and horizontal components.Fig. 7.Fig. 8.We note the following:60–The two horizontal forces H must be equal and opposite, as there are noother horizontal forces acting on this section of cable.–The vertical force V is equal to half the weight of the cable below thatpoint, the other half being supported on the right-hand side.–As we go lower along the cable, the vertical force V decreases a constantamount for each foot of cable.–As the vertical force decreases, the angle θ of the resultant decreases, as thehorizontal force H is constant.PAUL CALTER – Gateway to Mathematics: Equations of the St. Louis Arch
Thus the slope of the curve decreases as we move along it, so the rate of changein vertical distance is proportional to the distance along the curve. But for steeperparts of the curve, the vertical displacement is approximately equal to the distancealong the curve (fig. 8).The rate of change of vertical distance is approximately proportional to the verticaldistance.Comparing this with temperature drop in our coffee cup, we saw thatThe rate of change of temperature was proportional to the temperature T of thecoffee.In calculus notation,For drop in temperature:For drop in height:dT kTdtdy kydxSo the descending portion of the curve, at least where it is steep, behavessomething like exponential decay. In a similar way we can show that the risingportion of the curve exhibits some characteristics of exponential growth.Why use a catenary for the St.Louis Arch?With the hanging chain, the weight of the links gets resolved into tensions thatalways act along the curve, and never at right angles to it. There is pure tensionthroughout. Similarly for the catenary arch, the weight of the arch acts along thecenterline of the arch, and there are no shear forces perpendicular to the centerline.Why is a hanging chain described by the catenary equation?We glibly stated that a hanging chain follows the catenary curve, but why? Theproof of that statement is a standard problem in many mechanics or differentialequation textbooks. This one is from Murray Spiegel’s Applied DifferentialEquations, Prentice-Hall, 1958.We start with a bit of chain or rope with one end at the low point C of thecurve. It is acted on by three forces, H, W, and T (fig. 9).Fig. 9.NEXUS NETWORK JOURNAL – VOL. 8, NO. 2, 2006 61
From the equations of equilibrium,T sin θ WT cosθ HDividing givessin θWdy tan θ slope at P cosθHdxTaking the derivative, noting that H is a constantd2ydxHere2 1 dWH dx(1)dWis the change in load per unit horizontal distance. We will do twodxderivations: one for the suspension bridge and another for the catenary.For a suspension bridge for which the weight of the cable is negligible comparedto the weight of the roadway, this change in load is constant, and equal to theweight per foot of the roadway, which I’ll call w (fig. 10). Then Eq. (1) becomesd2ydx2 wHFig. 10.Integrating givesdy wx C1 dx HBut dy/dx 0 at x 0, so C1 0. Integrating again,y w 2x C22HWe can now shift the y axis so that y 0 at x 0. Then C 2 will be zero. So,replacing the constant w/2H by k, we get the equation of a parabola62PAUL CALTER – Gateway to Mathematics: Equations of the St. Louis Arch
y kx 2Turning now to the catenary, the load per unit distance along the curve, dW/ds, isconstant, and has the value w, but the load per unit horizontal distance is notconstant. For the steeper parts of the curve, the load per unit horizontal distance isgreater than for less steep portions.So we must write an expression for dW/dx as a function of x.dW dW dx w ds dx ds So,dsdW wdxdx(2)Now let us look at a section of the curve so small that it can be consideredstraight (fig. 11).Fig. 11.By the Pythagorean theorem,22 ds dy dx dx dx dx 2from which, with dx/dx 1,ds dy dx dx 2So from (2),dW dy w 1 dx dx 2Substituting into (1) givesd2yw dy 1 2H dx dx2(3)NEXUS NETWORK JOURNAL – VOL. 8, NO. 2, 2006 63
Here we have a second-order differential equation which we now solve for y. LetdpH p and CdxwSo (3) becomesdp 1 1 p2dx CSeparating variables,c dp1 p2 dxIntegrating, using a rule from a table of integrals,xp 2 1 C3 CIn p But p dy 0 at x 0, so C3 0. Going to exponential form,dxp2 1 ex Cp We now solve this equation for p. First we isolate the radical:p2 1 ex C pSquaring both sides,p 2 1 e 2 x C 2 pe x C p 22 pe x C e 2 x C 1p 1 e 2 x C x C e 2 e x C p 1 xCdye e x C 2dx()Replacing p by dy/dx and integrating again,y C x C dx C x C dx e e 2 2 C C y 64()C xCe e x C C42PAUL CALTER – Gateway to Mathematics: Equations of the St. Louis Arch
We can shift the y axis so that C4 0. Our equation then becomes e x C e x Cy C 2 , the equation of the catenary.Catenary and parabola comparedIf we draw a parabola that has the same height and width as the St. Louis archwould have the equationy 0.00699 x 2Fig. 12 shows this equation plotted together with the actual arch equation.Fig. 12.Notice that the catenary is flatter than the parabola. This is due to the weightdistribution for each.The suspension bridge has the same weight per horizontal foot, while thecatenary does not. There is relatively more weight away from the centerline, wherethe curve is steeper. Thus there is more chain in each one-foot interval towards theends than at the center. This tends to make the catenary lower away from thecenterline.NEXUS NETWORK JOURNAL – VOL. 8, NO. 2, 2006 65
About the authorPaul A. Calter is Professor Emeritus of Mathematics at Vermont Technical College. He has interestsin both the fields of mathematics and art. He received his B.S. from Cooper Union and his M.S.from Columbia University, both in engineering, and his Masters of Fine Arts Degree at VermontCollege of Norwich University. Calter has taught mathematics for over twenty-five years and is theauthor of ten mathematics textbooks and a mystery novel. He has been an active painter and sculptorsince 1968, has participated in dozens of art shows, and has permanent outdoor sculptures at anumber of locations in Vermont. Calter developed the Mathematics Across the Curriculum course"Geometry in Art & Architecture" and has taught it at Dartmouth and Vermont Technical College,as well as giving workshops and lectures on the subject. He presented a paper on the survey of adoorway by Michelangelo in the Laurentian Library in Florence at the Nexus 2000 conference onarchitecture and mathematics. Calter developed a trigonometric method for non-contactmeasurements of facades and presented his method at the first Nexus conference in 1996. His book,Squaring the Circle: Geometry in Art and Architecture, is due out in January 2007.66PAUL CALTER – Gateway to Mathematics: Equations of the St. Louis Arch
54 PAUL CALTER - Gateway to Mathematics: Equations of the St. Louis Arch An equation of the arch will give the height y of any point on the arch at a given horizontal distance x. Both distances are measured from chosen axes. An equation is, of course, meaningless unless one knows the x and y axes, and the origin, the point where they intersect.