Transcription
8EnglishQuarter 2 - Module 1:Visual-Verbal Relationship0
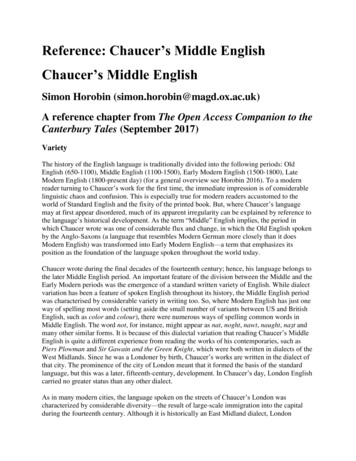
What I Need to KnowThis module was designed and written with you in mind. It is here to helpyou explain visual-verbal relationships illustrated in tables, graphs and informationmaps found in expository texts. The scope of this module permits it to be used indifferent learning situations. The language used recognizes the diverse vocabularylevel of students. The lessons are arranged to follow the standard sequence of thecourse. But the order in which you read them can be changed to correspond with thetextbook you are now using.Learning Objectives:At the end of this module, the learners are expected to:1. identify the importance of graphical representation of data;2. interpret data presented in a table, graphs and information map;3. present information using a diagram; and4. explain the importance of visual-verbal relationships in a table, graph, andinformation map found in expository texts.What’s InActivity 1: What’s ThisDirections: Identify the diagrams below whether a table, graph, chart, orinformational map. Then write your answer on the blank provided.10Average per Subject0Grade 7“image: Freepik.com”.1EnglishGrade8ScienceMathGrade 9 Grade 10Filipino
10Three Favorite colors ofJNHS students50Grade 7Grade 8GreenGrade 9RedGrade 10BlueImage: Freepik.comImage: Freepik.comWhat’s NewActivity 2: Search and WinDirections: Look for the hidden words listed below the puzzle, written in all directions,from left to right, right to the left, horizontally and vertically.Hidden sitoryTableTextGraph2
Search and ZKHIVCCLSMRYWDTDCIMW HATADFFUNGADLOBGFNVYTM ITEXTTUW W VCTCSFZPWECPECUAIHTNAKEIOIRRXAFRDUFXPBNLFWEXXM SVOQFSLBPNFKPTYXHQKW PIJUJIYOUASOTSXOQOGCUCVEWVASJNWLCSXOQ KVXEAW IAVPHMASGKYLPAOFW BKDPVOPQLYZYHBYQQOQLIRWSKTLCWhat is itThere are many different ways to present information and to convey ideascreatively. The use of data, graphical representations, and informational maps aresome of the most commonly used graphics to compare and show the relationshipbetween figures and the text used.What is expository text?It presents facts and information on specific topic. Expository texts are designedto explain, inform or describe.Why do authors use graphics in expository text?Authors use graphics to help readers understand the concept presented.3
Ways to interpret graphics in expository text:1. Photographs and illustrationsA photograph will provide a literal snapshot of the person, place, or thing beingdiscussed. An illustration is a drawing or sketch. Both provide visual interpretations ofconcepts and facts that serve to increase overall understanding of the material.It is important to use the photographs and illustrations in a text to deepenengagement with the material. It also requires paying attention to any captions or titlesadded to the picture.2. Charts and GraphsThey are usually used to present data. Charts and Graphs also allow uniqueorganization of data being presented.It is important to understand what data is included (type, amount, etc.) Knowingwhat is included in the chart helps readers understand the material more effectively.3. Diagrams and TimelinesDiagrams and timelines are useful to demonstrate processes (How plant goesfrom a seed to a seedling to a full-grown plant.) Timelines are important in thepresentation of events throughout time because they can show the passage of manyyears on a continuum.They are useful because they help to illustrate the facts and information. It isimportant to use captions and labels to decipher exactly what information is includedin the graphic.What is Visual-Verbal Relationship?When visual literacy was coined as a term, an early outcome was to suggestthe existence or possibility of a visual language(s). From the beginning, comparisonshave been made as if by second nature. Once we began to compare thecommunication aspects of imagery with written language, it was inevitable that therelationship between traditional verbal language and visuals would be explored.Visuals are considered to be things that can be seen, visible things other than printedwords that are used in a communication process. The term verbal applies to written orspoken words.4
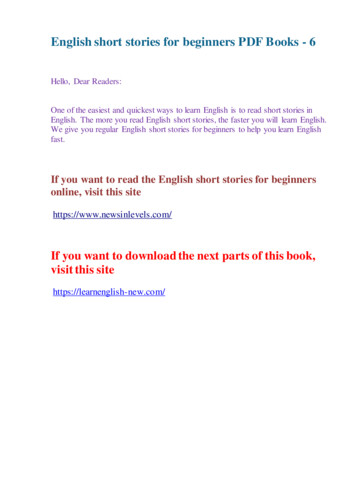
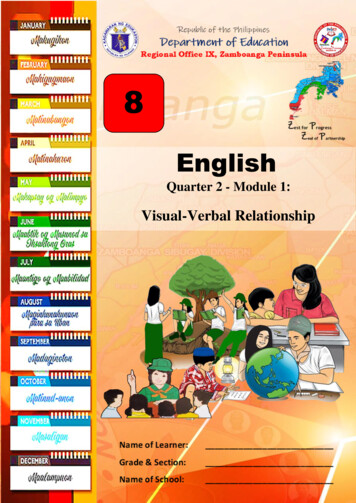
What’s MoreActivity 3: Let’s figure it out!Directions: Read the text and interpret the table. Answer the questions based fromthe data in the table.Tara’s New GardenTara couldn’t wait to make a new flower garden in her backyard.She got the soil ready for the new plants. Here is a table of whatshe planted in the new garden.Image: Freepik.comFlowerDaffodilsIrisDay 1295Source: Super Teacher Worksheets, accessed July 13, tor-word-search.html1. What is the total number of Iris bulbs Tara planted?2. How many roses did Tara plant all together?3. What did Tara plant the most?4. What is the total number of purple flowers Tara planted?5. How many purple Azaleas did Tara plant more than pink Azaleas?Activity 4: Match MeDirections: Which leisure activity matches each description from the table below?Reveal your answer by matching each statement in column A to theleisure activities listed in column B.Community Leisure ActivitiesSwimming13%Social Media29%Online Games28%Reading Books7%Playing Sports13%Picnic10%Social MediaReading BooksPlaying SportsPicnicSwimmingOnline Games5
Column AColumn B1. It is the leisure activity mostlyenjoyed by the youths.2. Activities with almost have the samelevel of youths’ enjoyment.3. The least enjoyed activity by theyouths.4. The activities which have the sameweight of enjoyment.5. Rank fourth in the list of activitiesenjoyed by the youths.a. Social Mediab. Picnicc. Sports and swimmingd. Social Media andonline gamese. ReadingActivity 5: Fill Me InDirections: Read and understand the text well. Write the cause and effects of Brad’scoming to school late.Brad woke up late today. The electricity went out the night before, whichcaused his alarm to not go off at the right time. As Brad was getting dressed, hisbelt broke. He also noticed there was a small stain on the front of his shirt. He didn’thave time to fix either of the problems. Since Brad had slept through his alarm, thebus had left without him and he was forced to ride his bike to school. Luckily, hewas able to jump into his first period seat right when the bell rang. As he began toask the girl in the desk next to him for a pencil, his teacher reprimanded him for nothaving the warm-up for that day’s class finished. She then noticed that his shirt wasuntucked. The teacher began to fill out a referral for Brad not following dress-code.Seeing this, Brad pushed back his chair and stormed out of the classroom.Source: Cause and Effect: Using Expository writing to Problem-Solve, accessedSeptember wcontent.cgi?article 1166&context educ understandingsImage: Freepik.com6
Activity 6: Let’s InvestigateDirections: Study the chart and answer the questions below.Food1%Water4%Air5%Basic Human NeedsInternet90%Process Questions:FoodWaterAirInternet1. What would most likely happen if the chart has no labels on it?2. How does the chart help you understand the idea?3. Based on the graphic, what do the partitions represent?4. What are the things you consider in interpreting the chart?Activity 7: Think and Write!Directions: Read and understand the text carefully. Study the table and write yourinterpretation based on the data presented in the table.Infrastructure spending surged to 6.3% of GDP in 2017 and is projected tohit 6.2% of GDP in 2018, almost tripling the average of 2% of GDP spent from 1986to 2016. This is in line with the Duterte administration’s target of increasinginfrastructure spending to more than 7.0% of GDP by 2022.Compared to the initial two years of every president when he or she was stilllearning the ropes of the presidency, President Duterte has shown a much betterjob than his peers.This fast-tracked spending performance addresses the country’sunderinvestment in infrastructure, which has severely dragged the Philippines’economic performances in the past.Notably, according to latest data on government disbursements,infrastructure also remains as one of the primary spending drivers as of November2018. Year-to-date actual disbursements also stand at Php 3.1 Trillion, increasingthe likelihood of zero underspending for 2018.infrastructure rank has sharply fallen from 94th in 2009 to 112th in 2017.With subpar road networks and transport systems, traffic congestion in MetroManila alone costs as high as Php 3.5 Billion daily, according to recent JICAestimates. This does not even reflect the social cost to the health and well-being ofcommuters.With the Build, Build, Build Program in full swing, infrastructure outlays areexpected to increase from 4.7% in 2019 to 7.0% in 2022. So far, 44 out of the 75major projects have already began implementation. And this year, the Php 356Billion Metro Manila Subway Project, the Philippines’ first-ever subway system, willcommence construction.7
Source: Department of Budget and Management, accessed August 5, trationActivity 8: Read, Think and ShareDirections: One way of showing understanding the text is the ability to extract the ideasor information embedded in the material read in a graphical presentation. Read thearticle and fill in the needed information called for in the graphic organizer below.Traveling is one of the favorite hobbies almost all people have. There are severalways for traveling around the world, and they all include some good things andsome bad things. Backpacking and staying in hotels are two of the most commonways of traveling, that’s why they are used by most people. The major differencesthat could be discussed between these two ways of traveling are the costs, thesafety of the staying, and the availability of plans. Backpacking has been used byteenagers for a long time, and it has become really famous among young peoplewho don’t have a lot of money for traveling. By backpacking people could save alot of money and travel with less money than what they would need for paying ahotel. As the travelers will need to sleep in a hostel, there will always be the issueof insecurity, as any kind of people could enter and sleep in a hostel. Hostels arenot always available as there are a lot of people who use them, so change of planswill always be a possibility in this way of traveling. People who rely on backpackingfor their trips should always have a backup plan. In contrast, hotels are one of themost comfortable ways of traveling, but only if you have enough money. This wayof traveling is mostly used by families and people who are wealthy enough to payfor good hotels. By staying at a hotel people will spend more money than theywould spend in a hostel; of course a hotel will provide a high level of security tothe traveler. However, to stay at most hotels, you need reservations, and once youhave them you can rely on a place to sleep every night. In this way of traveling nobackup plan is texamples8
Staying in hotelsBackpackingProcess Questions:1. What are the things you consider in filling in the Venn diagram?2. Why a graphic material necessary to understand the idea presented in the text?What I Have LearnedActivity 9: Fill the GapDirections: Complete the statement by filling in the blanks with the correct answerfrom the box to complete the idea.toolsunderstandpicturerelationshipverbalwords datathink1. Visual aids are to aid in the understanding of a text.2. applies to written or spoken words.3. Graphics show the between figures and the text used.4. Graphics are illustrations that give a specific of the figures presentedin the text.5. Authors use graphics to help readers the concept presented in a text.9
What I Can DoActivity 10: My PrioritiesDirections: Present your priorities in life using the chart and write at least 2 activitiesto make it happen.MyPrioritiesin lifeAssessmentMultiple Choice: Choose the letter of the best answer. Write the chosen letter on aseparate sheet of paper.1. What kind of diagram presents data in rows and columns, and is best used toshow comparison?A. GraphB. Information MapC. TableD. Expository text2. Which of the following is used to show a distribution of things by percent?A. TableB. GraphC. Expository textD. Information Map3. What diagram is shown by the picture below?Image: Freepik.comA. Information MapB. GraphC. Expository textD. Table4. Why diagrams are useful in presenting factual data?A. It shows the connection of data.C. It is a creative representation of text.B. It is a creative way of presenting data.D. It modifies the text.10
For 5-6. Study the table and answer the questions below.InstagramtwitterFacebookTikTokDislike all social mediaDon’t careTotal18 t024241750383013225 t0 3940 t0 4950 t0 6465 or 8366120766103615. What is most likely the title of the table?A. Social Media DataC. Data of People who like social mediaB. Social Media PlatformsD. Preferred Social Media by Age6. What is implied in the table?A. People have different choices for social media.B. TikTok is preferred by many.C. Facebook is the favorite social medium.D. Using social media makes someone healthy.7. What is the comparison of the graphs below?A. Favorite subjects for boysB. The distribution of interest of boysC. favorite color for boysD. The different subjects in school8. How should one interpret data presented in a graph?Jossy's Daily Expenses in Snacks10%A. One should make it sure that the data is complete.B. Make sure to calculate the data to determine entry errors.C. Analyze the data in order to understand what it showsD. Read the data and always find the lowest and the highest entry.11
9. Which sentence is correct about the data presented on the graph in number 8?A. Electricity and Veterans are entries with different budget allocation.B. Roads have the highest allocation of funds for 2016.C. Social security has the least budget allocation for 2016.D. Education is given great importance in the allocation of budget in 2016.10. Why should a visual-verbal relationship be determined in tables, charts andmaps?A. To know the similarities between the figures and the ideas of the text.B. To create artistic representations of the data found in the text.C. To easily understand the ideas presented in the text.D. To quickly contrast ideas in the diagrams and the text used.ReferencesOnline BookBraden, Roberts A. Examining Visual Verbal Relationships. ERIC, 1993. https://eric.ed.gov/?id ED363308.JournalHussein, Ali Ahmed. “The Impact of Visual-Verbal Relationships On Adult Readers’ Purposes.” RELC Journal 29, no. 2(December 1998): 152–65. Department of Budget and Management. “Infra Spending Surges in First Two Years of Duterte Administration, Better than AnyPost-Marcos Administration.” Department of Budget and Management. Accessed August 21, stration.“Evaluating Data in Tables, Graphs and Charts (English 3 Reading and Research) Texas Gateway.” Texasgateway.org, g-and-research.Evaluation, Centre for Education Statistics and. “Stage 3 - Data – Interpreting Information in a Table.” education.nsw.gov.au.Accessed June 16, 2020. .“Expository Text Examples.” Nebo School District. Accessed August 7, 2020. nterpreting Graphics in Expository Texts.” www.kohkaf.com. Accessed August 10, 2020. .ReportKnapp, Mollie. “Digital Commons @ Trinity Cause and Effect: Using Expository Writing to Problem-Solve,” ntent.cgi?article 1166&context educ understandings.ImageFreepik.com. Business infographics with pie chart and bar graph. editable presentation slide template Free VectorFreepik.com. Flat design tourism day with landmarks Free VectorFreepik.com. Pricing the table Free VectorFreepik.com. Scene with kid planting trees in the garden Free VectorDevelopment TeamWriter:Editors/QA:Lynard Cristopher M. DeroyGaulan National High SchoolJessamae A. ColanggoMarjorie R. DaligdigGarend E. TemporadaReviewer:Evelyn F. ImportanteOIC-CID Chief EPSIllustrator:Layout Artist:Management Team:Raymond M. SalvadorOIC-Assistant SDSJerry C. BokingkitoOIC-Assistant SDSJeanelyn A. Aleman, CESEOIC-Schools Division Superintendent12
My Final FarewellAnd when the dark night wraps the graveyardaround With only the dead in their vigil to seeBreak not my repose or the mystery profoundAnd perchance thou mayst hear a sad hymnresound 'T is I, O my country, raising a songunto thee.Farewell, dear Fatherland, clime of the suncaress'd Pearl of the Orient seas, our Eden lost!,Gladly now I go to give thee this faded life'sbest, And were it brighter, fresher, or moreblestStill would I give it thee, nor count the cost.And even my grave is remembered nomore Unmark'd by never a cross nor astoneLet the plow sweep through it, the spade turn ito'er That my ashes may carpet earthly floor,Before into nothingness at last they are blown.On the field of battle, 'mid the frenzy of fight,Others have given their lives, without doubt orheed; The place matters not-cypress or laurel orlily white, Scaffold or open plain, combat ormartyrdom's plight, T is ever the same, to serveour home and country's need.Then will oblivion bring to me nocare As over thy vales andplains I sweep;Throbbing and cleansed in thy space andair With color and light, with song andlament I fare, Ever repeating the faith that Ikeep.I die just when I see the dawn break,Through the gloom of night, to herald theday; And if color is lacking my blood thoushalt take, Pour'd out at need for thy dearsakeTo dye with its crimson the waking ray.My Fatherland ador'd, that sadness to mysorrow lendsBeloved Filipinas, hear now my last good-by!I give thee all: parents and kindred and friendsFor I go where no slave before the oppressorbends, Where faith can never kill, and Godreigns e'er on high!My dreams, when life first opened to me,My dreams, when the hopes of youth beat high,Were to see thy lov'd face, O gem of the Orientsea From gloom and grief, from care and sorrowfree; No blush on thy brow, no tear in thine eye.Dream of my life, my living and burningdesire, All hail ! cries the soul that is now totake flight; All hail ! And sweet it is for thee toexpire ;To die for thy sake, that thou mayst aspire;And sleep in thy bosom eternity's longnight.Farewell to you all, from my soul torn away,Friends of my childhood in the homedispossessed ! Give thanks that I rest from thewearisome day !Farewell to thee, too, sweet friend thatlightened my way;Beloved creatures all, farewell! In death there isrest!If over my grave some day thou seestgrow, In the grassy sod, a humble flower,Draw it to thy lips and kiss my soul so,While I may feel on my brow in the cold tombbelow The touch of thy tenderness, thy breath'swarm power.Let the moon beam over me soft andserene, Let the dawn shed over me itsradiant flashes, Let the wind with sadlament over me keen ; And if on my cross abird should be seen,Let it trill there its hymn of peace to myashes. Let the sun draw the vapors up tothe sky,And heavenward in purity bear my tardyprotest Let some kind soul o 'er my untimelyfate sigh, And in the still evening a prayer belifted on high From thee, 0 my country, that inGod I may rest.(This is the 1911 translation by CharlesDerbyshire of the Spanish original of JoséRizal's poem, Mi Ultimo Adiós)Pray for all those that hapless have died,For all who have suffered the unmeasur'd pain;For our mothers that bitterly their woes havecried,For widows and orphans, for captives by torturetried And then for thyself that redemption thoumayst gain.13
5 Tara's New Garden Image: Freepik.com What's More Activity 3: Let's figure it out! Directions: Read the text and interpret the table. Answer the questions based from the data in the table. _1. What is the total number of Iris bulbs Tara planted?