Transcription
International Journal of Business and Social ScienceVol. 4 No. 4; April 2013Psychometric Properties of the Icelandic Version of the Denison Organizational Culture SurveyGudmundur Skarphedinsson, PhD Fellow, PsychologistThe Center for Child and Adolescent Mental HealthEastern and Southern Norway (RBUP)Gullhaug Torg 4B, 0484 Oslo, NorwayThorhallur Gudlaugsson, PhDAssociate ProfessorUniversity of IcelandSchool of BusinessGimli v/Saemundargata, 101 Reykjavík, IcelandAbstractThe aim of the study was to evaluate psychometric properties of the Icelandic version of the DenisonOrganizational Culture Survey. It consists of four factors; involvement, consistency, adaptability and mission.Each factor is further divided into three sub-factors derived from five items each. The sample included 1,132managers and employees in 13 Icelandic firms. The majority of the participants were males or 59.3% (n 658),and 40.7% (n 452) were females. The factors and sub-factors showed good internal consistency and item-totalcorrelation was within an acceptable range for all but two items. Factor structure was evaluated by conductingconfirmatory factor analysis. Results showed acceptable goodness of fit of the original structure withininvolvement and consistency but not adaptability and mission. Factor analysis of the 12 sub-factors showedacceptable goodness of fit for the original four factor model, which were in line with previous studies. Thepsychometric properties of the survey are satisfactory.Keywords: Organizational culture, Psychometric properties, Factor analysis.1. IntroductionResearch on organizational culture has been ongoing since the early 80s with the advent of Japanesecompetitiveness in sectors such as car manufacturing and electronics (Morgan, 2006; Ouchi, 1981; Peters &Waterman, 1982). As a consequence, the main objective of research has been to identify factors of organizationalculture that are associated with competitiveness and performance (Ashkanasy, Wilderom, & Peterson, 2010;Denison, 1984, 1990; Fey & Denison, 2003). Qualitative assessment of organizational culture has been thedominant trend within the field (Davey & Symon, 2001; Schein, 2004; Yauch & Steudel, 2003). However severalquantitative measures have been designed such as Organizational Culture Survey (Cooke & Lafferty, 1989;Cooke & Rousseau, 1988) and the FOCUS questionnaire (van Muijen et al., 1999). Ashkanasy, Broadfoot &Falkus (2000) and Jung, Scott, Davies, Bower, Whalley, McNally & Mannion (2007, 2009) have provided anextensive review of quantitative measures.Denison Organizational Culture Survey (DOCS) was designed to evaluate the relationship between organizationalculture and effectiveness (Denison, 1984, 1990). The measure is based on two premises. First cultural traits thatare associated with organizational performance are identifiable (Denison, 1990; Denison, Janovics, Young, &Cho, 2006). Second the common pattern of beliefs and assumptions are fundamental to organizational culture, andthey are not easily accessible. However they create other components such as rules, rituals, values and behaviorthat are more easily accessible (Schein, 2004) and possible to measure (Denison, 1990; Denison, Haaland, &Goelzer, 2004; Denison & Mishra, 1995). The survey consists of four factors, involvement, consistency,adaptability and mission.13
Centre for Promoting Ideas, USAwww.ijbssnet.comAll factors are associated with organizational performance (Denison, et al., 2004; Denison & Mishra, 1995;Denison & Neale, 2002; Kotter & Heskett, 1992; Mobley, Wang, & Fang, 2005). Each factor consists of threesub-factors that are derived from five items (See measures in methods).Psychometric properties of the original and translated versions of the survey have been deemed acceptable(Bonavia, Prado Gasco, & Barberá Tomás, 2009; Carter, Diab, Lin, Pui, & Zickar, 2007; Denison, et al., 2006).The largest evaluation of psychometric properties of the survey was conducted in a sample of 35,474 employeesfrom 300 firms and institutions in various sectors. The vast majority of the firms were from USA or Canada,(74%) but other firms were from Europe, Asia and the Middle East. Internal consistency was deemed acceptable,and both factors and sub-factors correlated highly which indicates a strong relationship between different aspectsof organizational culture. Item-total correlation was satisfactory except for low correlation (r .23) on the item no.15 which is one of the eight negatively worded items. The investigators used this low correlated item in furtheranalysis, but they remarked that the item will perhaps be excluded in the future. Confirmatory factor analysis wasconducted on the first-order factor structure where 15 items of each factor loaded on the relevant sub-factor andthe second-order factor structure. Both resulting in acceptable goodness-of-fit (Denison, et al., 2006). Similarresults have been shown on the Spanish version (Bonavia, et al., 2009).The Institute of Business Research within University of Iceland Business School started in 2006 to studyorganizational culture within Icelandic firms that operate on international markets by finding traits that could beassociated with their performance (Aðalsteinsson & Guðlaugsson, 2007). A part of the project was to implementinstruments to measure organizational culture. The Denison Organizational Culture Survey was chosen as themain instrument due to its focus on cultural traits that lead to and/or explain organizational performance. Thepsychometric properties of the Icelandic version have been published previously in two studies both usingexploratory factor analysis. The first study was conducted in a sample of 393 participants from six Icelandiccompanies. The sample that was used is a part of the same database as used in the current study, but it has beenenlarged since then. Results showed that the 60 items loaded on three factors. Factor analysis of 15 items withineach factor did not reveal a clear three factor structure except for consistency (Bjarnadóttir, 2010). The secondstudy consisted of 226 employees from seven Icelandic companies. Factor analysis of all 60 items revealed twofactors. The first factor represented of empowerment of employees, consistency and adaptability and the secondfactor consisted of almost all of the mission items, one third of items within adaptability as well as all itemswithin the sub-factor coordination and integration that belongs to consistency. The investigator proposed that thefactor analysis results were perhaps different because all items were only administered in Icelandic but notIcelandic and English as the former study and the current study (Norðdahl, 2010).Previous studies on the Icelandic version of the survey were conducted with a small sample and showedcontradictory results. The aim of this study is primarily to study the factor structure of the survey withconfirmatory factor analysis. The following research questions have been designed.1. Is the factor structure within each factor compatible with the original version?2. Is the factor structure of all 60 items compatible with the original version?Moreover, a traditional psychometric evaluation will be conducted as well as comparing the means and variationbetween the Icelandic sample and the original one.2. MethodThe data is derived from a total of 1,132 participants in 13 different Icelandic firms. The largest group consistedof employees in telecommunication (27.8%, n 337), followed by 14.8% (n 168) working in financial services.Other sectors comprising between 5-10% of the sample were cleaning services, soft drink production, energy,printing services, health care manufacturing, security, automobile dealing and pharmaceutical. Advertisementcomprised of 1.9% (n 22) of the sample. Males were 59.3% (n 658), females 40.7% (n 452) and 22 participantsdid not report their gender.As mentioned in introduction the survey consists of 60 items that are divided into four factors. Each factorconsists of three sub-factors. Involvement consists of 1) empowerment, 2) team orientation and 3) capabilitydevelopment. Consistency includes 1) core values, 2) agreement and 3) coordination and integration. The subfactors of adaptability are 1) creating change, 2) customer focus and 3) organizational learning.14
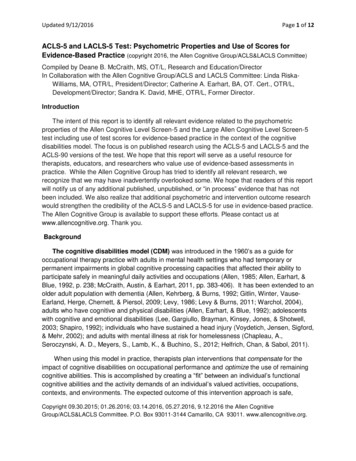
International Journal of Business and Social ScienceVol. 4 No. 4; April 2013The last factor consists of 1) strategic direction and intent, 2) goals and objectives and finally 3) vision. Responsesare measured on a 5-point Likert scale that ranges from 1 strongly disagree to 5 strongly agree. Eight items arenegatively worded, and are reversed in the analysis. The survey includes seven additional items that measureorganizational effectiveness; 1) sales/revenue growth, 2) market share, 3) profitability/ROA, 4) quality of goodsand services, 5) new product development, 6) employee satisfaction and 7) total organizational effectiveness.A traditional psychometric evaluation was conducted such as calculating internal consistency (Chronbach’salpha), item-total correlation and correlation between factors and sub-factors respectively. Moreover,confirmatory factor analysis was conducted with the aid of EQS 6.2 (Bentler & Wu, 2005; Byrne, 2006). Methodof estimation was maximum likelihood (ML), which is widely used, and provides robust parameter estimates(Anderson & Gerbing, 1988; Chou & Bentler, 1995). Several goodness-of-fit indices have been designed to assessthe fit between data and structure (Hu, Bentler, & Hoyle, 1995; Shevlin, Miles, Davies, & Walker, 2000). First,Satorra-Bentler (S-B) chi-square that provides a scaling correction for the chi-square statistics if assumptionsabout distribution are violated. Data in this study were not normally distributed when assessed with the Mardiaindex (Bentler & Wu, 2005). Results indicate unacceptable goodness-of-fit if the p-value is low (p .05). Howeverit is quite common that the index reports unacceptable fit although data and structure are highly compatible.Therefore, other indices should be reported as well (Bentler & Wu, 2005; Byrne, 2006; Floyd & Widaman, 1995).In this study, the following goodness-of-fit indices were used. CFI (comparative fit index (Bentler, 1990)), NNFI(non-normed fit index) which incorporates a correction for non-normal distribution (Bentler & Bonett, 1980), GFI(goodness-of-fit (Jöreskog & Sörbom, 1989)), AGFI (adjusted-goodness-of-fit (Jöreskog & Sörbom, 1996)) andRMSEA (root mean square error of approximation (Browne, Cudeck, Bollen, & Long, 1993; Steiger & Lind,1980)). Results from CFI, GFI and AGFI range from 0 to 1 , whereas .90 is deemed acceptable fit. NNFI can behigher than 1, but .90 is deemed acceptable. RMSEA has repeatedly shown high sensitivity of unacceptablefactor structure and .05 indicates a good fit, an acceptable fit is between .05-.08 but everything above .10 ishighly unacceptable (Browne, et al., 1993).3. ResultsDescriptive statistics of items, internal consistency and item-total correlation is reported in table 1a and table 1b.15
Centre for Promoting Ideas, USA16www.ijbssnet.com
International Journal of Business and Social ScienceVol. 4 No. 4; April 2013Results showed good internal consistency for all the factors. All sub-factors showed acceptable to good internalconsistency, except core values within consistency and creating change and customer focus within adaptability.Their internal consistency was marginally acceptable.17
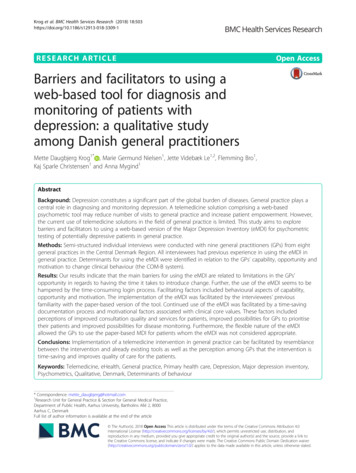
Centre for Promoting Ideas, USAwww.ijbssnet.comItem reliability was evaluated by item-total correlation. All items showed acceptable correlation (r .30) (Brooks& Kutcher, 2001; Fabrigar, Wegener, MacCallum, & Strahan, 1999) except item no 15 “Problems often arisebecause we do not have the skills necessary to do the job” and item no 17 “There is a characteristic managementstyle and a distinct set of management practices”. As mentioned in introduction, item no. 15 correlated belowacceptable range in Denison et al. (2006). However it was decided to withhold these items in further analysis. Theinternal consistency of the sub-factor derived from item no. 15 was within an acceptable range, and the item’scontent is highly compatible with the sub-factor. Item no. 17 was also used in further analysis. However the itemshould be reviewed in forthcoming studies.Confirmatory factor analysis was first conducted on 15 items within each factor of the DOCS. Two structureswere compared in each turn. Three factors compared to one individual factor. In all cases, three factor modelshowed superior goodness of fit except the structures in mission showed similar goodness of fit. Thus, goodnessof fit is only reported for the three factor model of each factor (See table 2).Goodness of fit indices was deemed satisfactory for the involvement structure but below or marginally acceptablefor the factor structure of consistency, adaptability and mission.Second confirmatory factor analysis was conducted on all 60 items of the DOCS by comparing three differentmodels. First second-order factor structure whereas each item loaded on its sub-factor and each sub-factor loadedon its factor. Second a four factor structure whereas 15 items on each factor where grouped together.Confirmatory factor analysis creates several constraints. One critical constraint concerns the risk of automaticinacceptable goodness of fit when dealing with large and complicated models that require excessive parameterestimation (indicated by a large number of degrees of freedom). The factor structure of the DenisonOrganizational Culture Survey is complicated and consists of a large number of parameters. These kinds ofmodels may be rejected because of statistical limitation but not incompatibility between data and a prioristructure. One method to overcome the problem is to group items together in a composite score or parcels and touse these composite scores as the basis of the analysis. Beside the advantage in reducing the number ofparameters to be estimated, response bias in individual items is reduced (Floyd & Widaman, 1995; Kishton &Widaman, 1994; Little, Cunningham, Shahar, & Widaman, 2002; Yuan, Bentler, & Kano, 1997). Thus for thethird structure it was decided to group five items of each sub-factor together in a composite score. A necessaryrequirement for grouping is an acceptable internal consistency of items grouped together. Nine of the 12 subfactors showed acceptable internal consistency as reported in table 2. The internal consistency of the other threesub-factors was marginally acceptable (.67-.69) so they were grouped together as well. The factor structureconsisted of four factors with three composite scores of sub-factors (See table 3).18
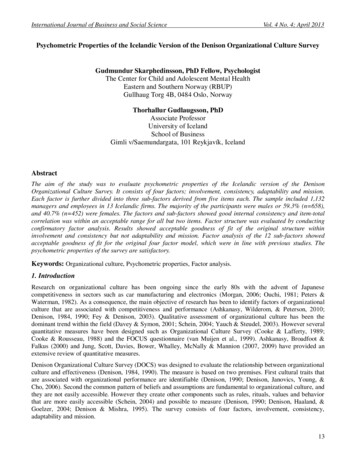
International Journal of Business and Social ScienceVol. 4 No. 4; April 2013Results of the two first models indicate inacceptable goodness-of-fit for all indices except RMSEA. This wasexpected due to an excessive number of parameters that needed to be estimated. The third model had much lowernumber of parameter estimation (df 48), and all indices showed acceptable goodness of fit.Next the correlation between factors was calculated (see table 4). The correlation was in most cases high thatindicates little divergence between factors.The Culture and Effectiveness Model describes that the four factors of the survey are interconnected by twodifferent axis (Denison, 1990; Denison, et al., 2006). First, external versus internal focus and second, flexibleversus stable orientation. Each factor is compatible with two other factors either due to external vs. internal focusor flexible vs. stable orientation but it is incompatible with the third factor. For example, adaptation relates tomission through external focus and involvement through flexible orientation but it is not compatible withconsistency (internal focus and stable orientation). Thus, it is expected that each factor correlates more stronglywith two compatible factors but less with the incompatible factor. This was evaluated statistically by comparingcorrelation coefficients of each factor with related factors with coefficient between same factor and an unrelatedfactor. The method of Meng et al. (1992) was used to evaluate statistical significant differences betweencorrelation coefficients. If the correlation of related factors turns out to be higher, than the correlation of unrelatedfactors then it indicated convergent and divergent validity of the respective factor. Results showed significantlyhigher correlation for related factors, than unrelated factor for involvement and mission, but not for adaptation andconsistency. This indicates acceptable convergent and divergent validity for involvement and mission but not foradaptation and consistency. Correlation between sub-factors is shown in table 5.19
Centre for Promoting Ideas, USAwww.ijbssnet.comConvergent and divergent validity of the sub-factors was also evaluated by comparing the correlation coefficientsof sub-factors within the same factor vs. correlation coefficients of sub-factors within other factor. Forinvolvement and mission, correlation coefficients between sub-factors were significantly higher than thecorrelation coefficients between sub-factors of other factors. For adaptation and consistency only half of thecorrelation coefficients between sub-factors within the same factor were significantly higher than coefficients ofsub-factors within other factors. This indicates acceptable convergent and divergent validity for sub-factors ofinvolvement and mission but in a less degree for adaptation and consistency.The mean and standard deviation of each factor and sub-factor in the Icelandic sample can be viewed in table 6and compared to the sub-factors from Denison et al. (Denison, et al., 2006) but not the factors as they were notreported.20
International Journal of Business and Social ScienceVol. 4 No. 4; April 2013The mean difference between the Icelandic sample and the Denison et al. sample was compared with independentsample t-test. In all cases, the Icelandic mean was significantly higher.4. DiscussionThe primary aim of the study was to study the factor structure of the Icelandic version of the DenisonOrganizational Culture Survey. Main results indicate that the structure is similar as in other versions of the survey(Bonavia, et al., 2009; Denison, et al., 2006) Internal consistency of all factors and nine sub-factors was within anacceptable range. The three remaining sub-factors showed marginally acceptable internal consistency. Two itemshad unacceptable item-total correlation, item no. 15 and 17. Item no. 15 has previously shown low correlationwith the total scale (Bonavia, et al., 2009; Denison, et al., 2006) and item no. 17 has been in the lower range ofacceptable item-total correlation (Denison, et al., 2006). It is possible that these items show less covariation acrosslanguages. Another explanation is for low item-total correlation is slightly different meaning in the translatedversion. In the light of the fact that no back translation was done on the Icelandic version it is not inconceivablethat the meaning is different. This doubt can be excluded by producing a back translation and/or conducting adifferential item functioning analysis by comparing the original version with the Icelandic version (Carter, et al.,2007).When the factor structure of the four main factors were evaluated individually, a original three factor structurewas superior to a one factor structure. However only the three factor structure for the involvement items showedacceptable goodness of fit. Similar factor analysis was not done by Denison et al. (Denison, et al., 2006) butidentical results were reported in a Spanish version of the DOCS (Bonavia, et al., 2009). Moreover the factorstructure of the whole survey was evaluated by comparing three different models. The first two models that werederived from all the 60 items showed unacceptable goodness of fit.21
Centre for Promoting Ideas, USAwww.ijbssnet.comExcessive number of parameters to be estimated is a probable explanation for these results (Raykov &Marcoulides, 2006). The third model was based on the 12 sub-factors of the DOCS that loaded on its respectivefactor. This model showed satisfactory goodness of fit. The convergent- and divergent validity of the survey wasevaluated by calculating correlation between factors and sub-factors. Overall factors correlated highly but in a lessdegree than in other studies (Denison, et al., 2006). Moreover involvement and mission showed higher correlationbetween similar factors than dissimilar but not adaptability and consistency. Same pattern was revealed whencorrelation between sub-factors within the same factor was compared to correlation to other sub-factors. Subfactors of involvement and mission correlated stronger with sub-factors within the same factor but not sub-factorswithin adaptability and consistency. Same analysis has not been done in previous studies of the survey (Bonavia,et al., 2009; Denison, et al., 2006) thus it would be interesting to repeat the analysis in other versions. Overallresults indicate satisfactory psychometric properties of the Icelandic version of the survey. Moreover thepsychometric properties are similar as in other versions (Bonavia, et al., 2009; Denison, et al., 2006).The survey could, therefore be used to evaluate organizational culture within Icelandic companies. However,further studies are recommended. For example, the survey was designed originally to measure culture incompanies operating in highly competitive markets (Denison, 1984, 1990). Thus, the survey should not beimplemented in other sectors that operate differently such as public institutions unless psychometric propertieshave been reported and compared across different sectors. Data has been collected but it has not been analyzedindependently to the knowledge of the authors (Denison, et al., 2006). There exist a study on the Icelandic versionof the survey that investigated organizational culture in the University of Iceland that is a state owned university.However no psychometric evaluation was conducted (Björnsdóttir, 2009). Moreover, it is recommended thatfurther studies on its concurrent validity will be conducted. For example by studying the relationship between thesurvey and other measures of organizational culture, as well as independent measures of organizationalperformance.5. ReferencesAðalsteinsson, G. D., & Guðlaugsson, Þ. (2007). Fyrirtækjamenning og leiðir til að leggja mat á hana [OrganizationalCulture and Methods for Assessment].Unpublished manuscript, Reykjavik.Anderson, J. C., & Gerbing, D. W. (1988). Structural equation modeling in practice: A review and recommended two-stepapproach. Psychological Bulletin, 103(3), 411-423.Ashkanasy, N., Broadfoot, L. E., & Falkus, S. (2000). Questionnaire measures of organizational culture. In N. M. Ashkanasy,C. P. M. Wilderom & M. F. Peterson (Eds.), Handbook of Organizational Culture and Climate (pp. 131-146).Thousand Oaks, CA: Sage Publications.Ashkanasy, N., Wilderom, C. P. M., & Peterson, M. F. (2010). The Handbook of Organizational Culture and Climate.Thousand Oaks, CA: Sage Publications.Bentler, P. M. (1990). Comparative fit indexes in structural models. Psychological Bulletin, 107, 238-246.Bentler, P. M., & Bonett, D. G. (1980). Significance tests and goodness of fit in the analysis of covariance structures.Psychological Bulletin, 88(3), 588-606.Bentler, P. M., & Wu, E. J. C. (2005). EQS 6.1 for Windows: User s guide. Encino, CA: Multivariate Software.Bjarnadóttir, Þ. A. (2010). Íslensk fyrirtækjamenning: Próffræðilegir eiginleikar Denison spurningalistans og notagildi hansvið mælingar á markaðshneigð [Diagnosing Icelandic organizational Culture: Validating a model and it’s link tomarket orientation]. University of Iceland.Björnsdóttir, B. S. (2009). Vinnustaðamenning Háskóla Íslands [The Organizational Culture of the University of Iceland].University of Iceland, Reykjavik.Bonavia, T., Prado Gasco, V. J., & Barberá Tomás, D. (2009). Adaptación al castellano y estructura factorial del DenisonOrganizational Culture Survey. Psicothema, 21(4), 633.Brooks, S. J., & Kutcher, S. (2001). Diagnosis and measurement of adolescent depression: a review of commonly utilizedinstruments. Journal of Child and Adolescent Psychopharmacology, 11(4), 341-376.Browne, M. W., Cudeck, R., Bollen, K. A., & Long, J. S. (1993). Testing structural equation models. Newbury Park, CA:Sage Publications.Byrne, B. M. (2006). Structural Equation Modeling with EQS: Basic concepts, applications, and programming. New Jersey:Lawrence Erlbaum Associates.Carter, N. T., Diab, D. L., Lin, B. C., Pui, S. Y., & Zickar, M. J. (2007). Denison Consulting Measurement Equivalence of theDeniosn Organizational Culture Survey (DOCS) Across Language Adaptations. Denison Consulting .aspx22
International Journal of Business and Social ScienceVol. 4 No. 4; April 2013Chou, C. P., & Bentler, P. M. (1995). Estimates and tests in structural equation modeling. In H. Rick (Ed.), Structuralequation modeling: Concepts, issues, and applications. . Thousand Oaks, CA: Sage Publications.Cooke, R. A., & Lafferty, J. C. (1989). Organizational Culture Inventory. Plymouth, MI: Human Synergistics.Cooke, R. A., & Rousseau, D. M. (1988). Behavioral norms and expectations. Group & Organization Management, 13(3), 245.Davey, K. M., & Symon, G. (2001). Recent approaches to the quality analysis of organizational culture. In C. L. Cooper, S.Cartwright & P. C. Earley (Eds.), The International Handbook of Organizational Culture and Climate (pp. 123-141).New York: John Wiley & Sons.Denison, D. R. (1984). Bringing corporate culture to the bottom line. Organizational Dynamics, 13, 4-22.Denison, D. R. (1990). Corporate Culture and Organizational Effectiveness. New York: John Wiley & Sons.Denison, D. R., Haaland, S., & Goelzer, P. (2004). Is Asia different from the rest of the world? Organizational Dynamics,23(1), 98-109.Denison, D. R., Janovics, J., Young, J., & Cho, H. J. (2006). Diagnosing organizational cultures: Validating a model andmethod. . Working Paper, Denison Consulting Group Retrieved 10.09, 2011, enison, D. R., & Mishra, A. K. (1995). Toward a theory of organizational culture and effectiveness. Organization Science,6(2), 204-223.Denison, D. R., & Neale, W. S. (2002). Linking corporate culture and customer satisfaction. Two empirical studies. Paperpresented at the 17th Annual Society of Industrial Organizational Psychologists Conference.Fabrigar, L. R., Wegener, D. T., MacCallum, R. C., & Strahan, E. J. (1999). Evaluating the use of exploratory factor analysisin psychological research. Psychological methods, 4, 272-299.Fey, C., & Denison, D. (2003). Organizational culture and effectiveness: can American theory be applied in Russia?Organization Science, 686-706.Floyd, F. J., & Widaman, K. F. (1995). Factor analysis in the development and refinement of clinical assessment instruments.Psychological Assessment, 7(3), 286-299.Hu, L. T., Bentler, P. M., & Hoyle, R. H. (1995). Evaluating model fit. In H. Rick (Ed.), Structural equation modeling:Concepts, issues, and applications (pp. 76-99). Thousand Oaks, CA: Sage Publications.Jung, T., Scott, T., Davies, H. T. O., Bower, P., Whalley, D., McNally, R., et al. (2007). Instruments for the Exploration ofOrganisational Culture, Working Paper,. from g, T., Scott, T., Davies, H. T. O., Bower, P., Whalley, D., McNally, R., et al. (2009). Instruments for exploringorganizational culture: A review of the literature. Public Administration Review, 69(6), 1087-1096.Jöreskog, K. G., & Sörbom, D. (1989). LISREL 7: A guide to the program and applications. Chicago: SPSS.Jöreskog, K. G., & Sörbom, D. (1996). LISREL 8 user's reference guide. Chicago: Scientific Software International.Kishton, M., & Widaman, K. F. (1994). Unidimensional versus domain representative parceling of questionnaire items: Anempirical example. Educational and Psychological Measurement, 54(3), 757-765.Kotter, J. P., & Heskett, J. L. (1992). Corporate Culture and Performance. New York: Free Press.Little, D., Cunningham, W. A., Shahar, G., & Widaman, K. F. (2002). To parcel or not to parcel: Exploring the question,weighing the merits. Structural Equation Modeling: A multidisciplinary journal, 9(2), 151-173.Meng, X. L., Rosenthal, R., & Rubin, D. B. (1992). Comparing correlated correlation coefficients. Psychological Bulletin,111(1), 172-175.Mobley, W. H., Wang, L., & Fang, K. (2005). Organizational culture: Measuring and developing it in your organization.Harvard Business Review China, 3, 128-139.Morgan, G. (2006). Images of organization. Thousand Oaks, CA: Sage Publications.Norðdahl, R. M. (2010). Fyrirtækjamenning: Próffræðileg athugun á spurningalista Denison um fyrirtækjamenningu[Organizational Culture: Psychometric evaluation of the Denison Organizational Culture Survey]. University of Iceland.Ouchi, W. G. (1981). Theory Z: how American business can meet the Japanese challenge. Reading, Massach: Addison-Wesley.Peters, T. J., & Waterman, R. H. (1982). In Search of Excellence: Lessons from America's best-run companies. New York: Harper & Row.Raykov, T., & Marcoulides, G. A. (2006). A First Course in Structural Equation Modeling. Hillsdale, NJ: Lawrence Erlbaum Associates.Schein, E. H. (2004). Organizational Culture and Leadership. San Francisco: Jossey-Bass.Shevlin, M., Miles, J. N. V., Davies, M. N. O., & Walker, S. (2000). Coefficient alpha: a useful indicator of reliability?Personality and Individual Differences, 28(2), 229-237.Steiger, J. H., & Lind, J. C. (1980, Maí 1980). Statistically based tests for the nu
Denison Organizational Culture Survey (DOCS) was designed to evaluate the relationship between organizational culture and effectiveness (Denison, 1984, 1990). The measure is based on two premises. First cultural traits that are associated with organizational performance are identifiable (Denison, 1990; Denison, Janovics, Young, & Cho, 2006 .