Transcription
Bellouze et al. Molecular Neurodegeneration (2016) 11:43DOI 10.1186/s13024-016-0111-6RESEARCH ARTICLEOpen AccessStathmin 1/2-triggered microtubule lossmediates Golgi fragmentation in mutantSOD1 motor neuronsSarah Bellouze1†, Gilbert Baillat1†, Dorothée Buttigieg1, Pierre de la Grange2, Catherine Rabouille3and Georg Haase1*AbstractBackground: Pathological Golgi fragmentation represents a constant pre-clinical feature of many neurodegenerativediseases including amyotrophic lateral sclerosis (ALS) but its molecular mechanisms remain hitherto unclear.Results: Here, we show that the severe Golgi fragmentation in transgenic mutant SOD1G85R and SOD1G93A mousemotor neurons is associated with defective polymerization of Golgi-derived microtubules, loss of the COPI coatsubunit β-COP, cytoplasmic dispersion of the Golgi tether GM130, strong accumulation of the ER-Golgi v-SNAREs GS15and GS28 as well as tubular/vesicular Golgi fragmentation. Data mining, transcriptomic and protein analysesdemonstrate that both SOD1 mutants cause early presymptomatic and rapidly progressive up-regulation of themicrotubule-destabilizing proteins Stathmins 1 and 2. Remarkably, mutant SOD1-triggered Golgi fragmentation andGolgi SNARE accumulation are recapitulated by Stathmin 1/2 overexpression but completely rescued by Stathmin1/2 knockdown or the microtubule-stabilizing drug Taxol.Conclusions: We conclude that Stathmin-triggered microtubule destabilization mediates Golgi fragmentation inmutant SOD1-linked ALS and potentially also in related motor neuron diseases.BackgroundStructural alterations of the Golgi apparatus are amongthe earliest and most constant pathological features inneurodegenerative diseases and have been widely studiedin the motor neuron disease amyotrophic lateral sclerosis(ALS) [16, 23, 57]. The Golgi alterations are detectable indegenerating ALS motor neurons of spinal cord and cerebral motor cortex [20, 36], are common to both sporadic[22] and familial forms of the disease [21, 24, 31, 36, 58],and manifest at presymptomatic stage [36, 65, 66].The Golgi apparatus of normal motor neurons is madeof stacked membrane-bound cisternae that are laterallyconnected to form the Golgi ribbon [5]. Earlier studies inparticular by Gonatas and colleagues have characterizedthe structural Golgi alterations in ALS motor neurons as* Correspondence: georg.haase@univ-amu.fr†Equal contributors1Institut de Neurosciences de la Timone, UMR 7289, Centre National de laRecherche Scientifique (CNRS) and Aix-Marseille Université, 27 bd JeanMoulin, 13005 Marseille, FranceFull list of author information is available at the end of the articlefragmentation [22], i.e. transformation of the Golgi ribboninto disconnected stacks or into tubules and vesicles [5],and as atrophy [22, 36], i.e. loss or dispersion of Golgimembranes. In the most widely studied ALS mousemodel, transgenic mutant SOD1G93A mice, Golgi fragmentation can affect up to 75 % of spinal cord motor neurons at symptomatic stage [36, 65].The Golgi apparatus is a highly dynamic cellular organelle that ensures the processing and sorting of proteinsform their site of synthesis in the endoplasmic reticulum(ER) en route to their final destination, which is reflectedby its functional division into a cis(entry) side and atrans(exit) side. Intra-Golgi transport involves COPI-coatedvesicles [2] which are formed through recruitment ofcoatomers α-ζ [43], tethered by Rabs and Golgins [37] andfused/docked to target membranes by Golgi SNAREs [29].While the molecular mechanisms of Golgi fragmentation in ALS remain largely to be deciphered, at least twomechanisms can been proposed. The first mechanisminvolves an impairment in transport from endoplasmicreticulum (ER) to Golgi [4, 52] and from Golgi to plasma 2016 The Author(s). Open Access This article is distributed under the terms of the Creative Commons Attribution 4.0International License (http://creativecommons.org/licenses/by/4.0/), which permits unrestricted use, distribution, andreproduction in any medium, provided you give appropriate credit to the original author(s) and the source, provide a link tothe Creative Commons license, and indicate if changes were made. The Creative Commons Public Domain Dedication o/1.0/) applies to the data made available in this article, unless otherwise stated.
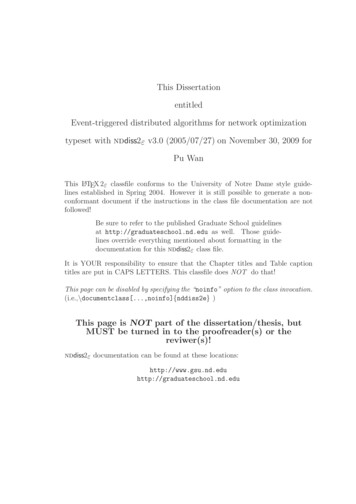
Bellouze et al. Molecular Neurodegeneration (2016) 11:43membrane [54]. Both could in turn affect Golgi structure.The second mechanism involves potential microtubule alterations [36]. Microtubules are indeed closely associatedwith the Golgi [30, 50] and nucleated at its membrane[8, 14] in motor neurons [5]. Furthermore, pharmacological microtubule disruption with colchicine or nocodazole causes reversible Golgi fragmentation and dispersal[15, 47, 61]. Finally, we have recently demonstrated thatdefective polymerization of Golgi-derived microtubulescauses Golgi fragmentation in motor neurons of pmnmice with progressive motor neuronopathy which are mutated in the tubulin-binding cofactor E (Tbce) gene [5].The role of microtubules in mutant SOD1-linked Golgifragmentation remained however unclear. Indeed, microtubules appeared normal in motor neuron cell bodieswith a fragmented Golgi [53] despite their early alterations in axons [17, 70]. In addition, dys-regulation of amicrotubule-severing protein (Stathmin-1) was seen onlyin a fraction of motor neurons with Golgi fragmentationand only at late disease stage [55], suggesting that it mayrepresent a compensatory event.To analyze the mechanisms of Golgi pathology in ALS,we here investigated two transgenic mouse lines with similar disease course due to either dismutase active (G93A) orinactive (G85R) human SOD1. Mutant SOD1G93A mice(line G1del) develop limb weakness between day 165 to240 and fatal paralysis about 40 days later [1]. MutantSOD1G85R mice (line 148) develop limb weakness betweenday 240 to 280 and die about 15 days later [6]. As controls,we used non-transgenic litter mice and mice expressingwild type human SOD1 (SOD1wt, line 76) at a similar levelas in the mutants. In addition, we used NSC-34 cells transfected with mutant or wildtype SOD1 as in vitro system. We show that the early Golgi pathology observedin mutant SOD1G85R and SOD1G93A motor neurons involves disruption of the Golgi-nucleated somatic microtubule network due to up-regulation of the twomicrotubule-severing proteins Stathmin 1 and 2. Thisin turn leads to Golgi fragmentation with early presymptomatic and rapidly progressive accumulation ofthe ER-Golgi v-SNAREs GS28 and GS15. These data,together with our findings in ALS-like pmn mice [5],lead us to propose that a disruption of Golgi-nucleatedmicrotubules underlies Golgi fragmentation in humanSOD1-linked ALS and related degenerative motorneuron diseases.ResultsTo confirm the reported Golgi alterations in mutantSOD1 motor neurons [36, 65, 66], we first examined lumbar spinal cord cryosections from 240-day-old mice byconfocal microscopy using GM130 antibodies. We demonstrate that Golgi membranes form a dense ribbon inthe cell bodies of control and SOD1wt motor neurons, butPage 2 of 20appear fragmented or atrophied in motor neurons ofmutant SOD1G85R and SOD1G93A mice (Fig. 1a). Golgifragmentation was confirmed by GM130 membrane modeling demonstrating an 4 fold increase in the number ofindividual Golgi profiles in SOD1G85R and SOD1G93Amotor neurons when compared to control (Fig. 1a,b). Lossof Golgi area in SOD1G85R and SOD1G93A motor neuronswas quantified by a reduction in its cross-sectional areato 35 % of normal (Fig. 1a,c, Additional file 1: Figure S1A).To confirm that Golgi fragmentation precedes diseaseonset in ALS [36, 65, 66], we analyzed mutant SOD1G93Amice and SOD1G85R mice, respectively one month before(age 130 days) and two months before (age 180 days) theonset of first clinical symptoms and before any reportedloss of motor neurons. Up to 19 % of mutant SOD1 motorneurons displayed signs of Golgi fragmentation labelled byGM130, as compared to 1 % of motor neurons in nontransgenic and SOD1wt mice (Fig. 1d and Additional file 1:Figure S1B). This compares very well with published results at least in mutant SOD1G93A mice, where Golgifragmentation is scored in 25-30 % of motor neuronsabout 10 days later at 20 weeks of age [65].To confirm and characterize the changes of the Golgiarchitecture, we analyzed presymptomatic mutant SOD1mice aged 140 days at the ultrastructural level by electronmicroscopy. In control mice (Fig. 1e, upper left panel) andin transgenic SOD1wt mice (not shown), the Golgi apparatus exhibits the typical morphology of stacked cisternaeas described in [5]. Conversely, in motor neurons of mutant SOD1 mice, we observe a fragmentation of the Golgiribbon into many disconnected Golgi stacks, small tubulesand vesicles that appear uncoated as well as unlinked(Fig. 1e, arrows in lower left panels).To analyze the molecular basis of the observed Golgifragmentation in mutant SOD1 motor neurons, we investigated the status of Golgi vesicle coats, tethers andSNAREs using biochemical methods. We found that thelevel of the COPI vesicle subunit β-COP is lower inmutant SOD1G85R and SOD1G93A spinal cords than incontrol spinal cords, whereas the level of the COPII vesiclesubunit Sec23 remains normal (Fig. 1f, upper panels).The Golgi tethering protein GM130 is normally associated with the cytoplasmic face of cis-medial Golgi membranes and binds the Golgi tether p115 present onincoming vesicles [38]. We found that the total levels ofGM130 and p115 are unchanged in mutant SOD1 spinalcords when compared to control (Fig. 1f, lower panels).Since the membrane association of GM130 and p115 iscritical for their function [37], we investigated a potentialsubcellular redistribution of both Golgi tethers in mutantSOD1 mice by biochemical fractionation of spinal cordsinto membrane (P10), vesicle (P100) and cytosol (S100)fractions. We found that GM130 is significantly redistributed from its typical Golgi membrane localization in
Bellouze et al. Molecular Neurodegeneration (2016) 11:43Fig. 1 (See legend on next page.)Page 3 of 20
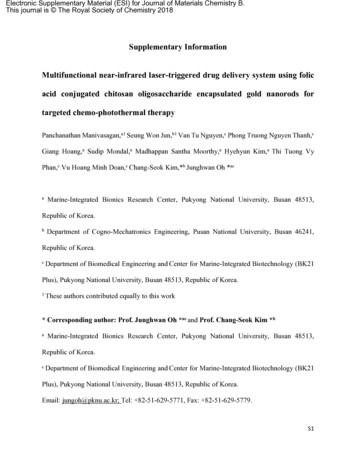
Bellouze et al. Molecular Neurodegeneration (2016) 11:43Page 4 of 20(See figure on previous page.)Fig. 1 Morphological and molecular Golgi alterations in motor neurons of mutant SOD1 mice. a. Confocal z-stacks (upper panels) show fragmentation ofGM130-labeled Golgi membranes in lumbar motor neurons of 240-day-old mutant SOD1G85R and SOD1G93A mice as compared to non-transgenic miceand transgenic SOD1wt mice. Motor neurons are identified by expression of VaChT (vesicular acetylcholine transporter). 3D-modeling (lower panels) ofGM130-labelled Golgi membranes in entire motor neurons confirms Golgi fragmentation. Scale bars 10 μm. b. Increased number of GM130-stained Golgielements in mutant SOD1G85R and SOD1G93A motor neurons determined by 3D modeling of Golgi membranes in entire cells (mean sd, n 12 motorneurons from three mice per genotype, *** p 0.0001 by student’s t-test, unpaired. c. Decreased cross-sectional area of GM130-labeled Golgiarea in mutant SOD1G85R and SOD1G93A motor neurons as compared to control motor neurons (mean sd, *** p 0.001, n 50 motor neurons fromthree mice per genotype, student's t test). See also Additional file 1: Figure S1. d. Percentage of motor neurons with GM130-labeled Golgi fragmentationat presymptomatic stage (mean sd, *** p 0.001 by student’s t-test, n 250 motor neurons from four mice per genotype were analyzed atpresymptomatic stage corresponding to age 130 days (SOD1G93A, non Tg) or 180 days (SOD1G85R, SOD1wt). e. Electron microscopy of a lumbarmotor neuron from a non-transgenic mouse aged 140 days showing a typical Golgi apparatus (upper panel) that is easily distinguished fromunlinked, partially swollen and vesiculated Golgi profiles observed in mutant SOD1G93A motor neurons (arrows in lower panel, magnificationson the right). n: nucleus, m: mitochondria. Scale bars 500 nm (left panels), 200 nm (right panels). f. Western blots showing decreased levels ofβ-COP in mutant SOD1 mice, and normal levels of Sec23, GM130 and p115. Loading control β-actin. Shown is one representative blot per genotype out offour. The diagram below shows that β-COP levels (normalized to β-actin) are reduced to 25 7.7 % and 42.5 9.6 % of non Tg (mean sd, n 4 pergenotype, * p 0.01 by Mann Whitney test). g. Subcellular fractionation of spinal cords. Western blot analyses show redistribution of GM130 in mutantSOD1 mice, as indicated by shift from its normal membrane localization in control and SODwt mice into fragmented membranes and vesicles in SOD1G85Rand SOD1G93A mice and cytosol. P115 is not redistributed. Each blot is representative of three independant experiments on mice of the indicatedgenotypes. The diagram below shows densitometric determination of protein distribution (mean sd, n 3 per genotype, * p 0.01 by Mann Whitneytest). h. Confocal imaging reveals accumulation of Golgi v-SNARE protein GS28 (upper panels) and GS15 (lower panels) in small vesicle-like punctae ofmotor neurons in mutant SOD1 mice, as compared to controls. Scale bars 10 μm. i. Western blots (upper two panels) demonstrating massivelyincreased levels of Golgi v-SNAREs GS28 and GS15 in mutant SOD1G85R and SOD1G93A lumbar spinal cords, as compared to non-transgenicand SOD1wt spinal cords. Western blots (lower three panels) showing normal expression of the Golgi t-SNARE Syntaxin-5a and the endosomalv-SNARE Vti1a. β-actin indicates equal protein loading. Each blot is representative of three independant experiments on mice of theindicated genotypes. The diagrams show increased spinal cord protein levels of GS28 by 4 1.6 (SOD1G85R) and by 3.7 1.3 (SOD1G93A) fold and ofGS15 by 3.7 0.7 (SOD1G85R) and by 3.2 1 (SOD1G93A) as compared to non Tg control (mean sd, * p 0.001 by Mann Whitney test)control mice to vesicles, membrane fragments and cytosolin SOD1G85R and SOD1G93A mice (Fig. 1g, blots anddiagram). Interestingly, this subcellular redistribution isspecific for GM130 since p115 remains associated withthe vesicle fraction as in control mice (Fig. 1g). The purityof the P10, P100 and S100 fractions was confirmed byanalysis of molecular markers L1, Vt1a and GAPDH(Additional file 1: Figure S2). These data suggest thatmutant SOD1 expression leads to defective tethering ofGolgi vesicles due to redistribution of GM130.Last, Golgi SNAREs mediate vesicle fusion throughinteraction of v-SNAREs (present on vesicles) andt-SNAREs (present on target membranes) [26, 29]. Usingimmunofluorescence, we found that the ER-Golgi vSNAREs GS28 [56] and GS15 [71] are present in smalldispersed profiles in mutant SOD1G85R and SOD1G93Amotor neurons when compared to control motorneurons (Fig. 1h). Furthermore, Western blots showedthat the total spinal cord levels of GS28 and GS15 areincreased by 4 fold and 3 fold respectively in mutantSOD1G85R mice and SOD1G93A mice when compared tocontrol mice (Fig. 1i, upper panels and diagrams). Thisis specific for GS15 and 28 because, by contrast, thelevels of Syntaxin5a, the major Golgi t-SNARE cognate ofGS28 and GS15, and of the endosomal v-SNARE Vti1a,are unchanged in mutant SOD1 mice (Fig. 1i, lowerpanels). Importantly in SOD1wt spinal cords, the levels ofall tested SNARE proteins are identical to those in nontransgenic mice (Fig. 1h, upper panels), indicating aspecific and significant increase of Golgi v-SNAREsGS28 and GS15 in mutant SOD1 spinal cords.In order to set up a tractable in vitro model, we reproduced these Golgi alterations in cultured NSC-34 motorneurons [7] expressing mutant SOD1 (Fig. 2). UsingMannII-GFP or GM130 as Golgi markers, the Golgiappears as a compact juxtanuclear structure in control cellstransfected with empty or SOD1wt plasmids but is fragmented in cells transfected with SOD1G85R or SOD1G93Aplasmids (Fig. 2a,b and Additional file 1: Figure S1C).Expression of both SOD1 mutants also triggers dispersal ofGS28, as shown by IF (Fig. 2a,c) and a 2 fold increase inprotein levels of GS28 and GS15, as shown by Western blot(Fig. 2d).Taken together, these results show that both in spinalmotor neurons and in NSC-34 cells, expression of mutantSOD1G85R and SOD1G93A causes loss of β-COP, redistribution of GM130 and strong accumulation of GolgiSNAREs GS28 and GS15, in line with the observed Golgifragmentation. Importantly, these alterations closely resemble those that we previously observed in pmn mice [5].Mutant SOD1 proteins localize to the Golgi and impedethe polymerization of Golgi-derived microtubulesGiven that the molecular features observed in pmn miceare triggered by a point mutation in Golgi-localized TBCEthat affects the Golgi microtubule network, we wondered whether mutant SOD1 also impairs Golgi-derivedmicrotubules.
Bellouze et al. Molecular Neurodegeneration (2016) 11:43Page 5 of 20Fig. 2 Golgi alterations in mutant SOD1-transfected NSC-34 motor neurons. a. Confocal images (upper panels) showing Golgi fragmentation withthe marker MannII-GFP in NSC-34 cells transfected for 4 DIV with mutant SOD1, as compared to the situation in control or wildtype SOD1-transfectedcells. Confocal images (lower panels) showing GS28 dispersal after transfection with mutant SOD1, as compared to the situation in control or wildtypeSOD1 cells. Scale bar 10 μm. b. Percentage of cells (mean sd) with Golgi fragmentation labeled for MannII-GFP. More than 300 cells per conditionwere analyzed on quadruplicate wells per condition. Statistical significance * p 0.01 by Mann–Whitney test, as compared to mock and SODwt. Datarepresent one out of three experiments yielding similar results. c. Percentage of transfected cells with dispersal of GS28. More than 200 cellsper condition were analyzed on quadruplicate wells per condition. Statistical significance * p 0.01 by Mann–Whitney test, as compared tomock and SODwt. d. Western blot analysis of NSC-34 cells demonstrating that GS28 protein levels are increased to 2.7 0.7 and 2.9 0.8by SOD1G85R and SOD1G93A, respectively, as compared to those in control SODwt. GS15 protein levels are increased to 2.7 0.2 and 3.0 0.3 fold, respectively. The diagrams show densitometric quantification of protein levels relative to SODwt (mean sd). Cellular extractsfrom three independently transfected cultures were blotted and analyzed each in duplicate. Statistical significance * p 0.01 by MannWhitney testPrevious studies in non-motor neuronal cells havelocalized a significant fraction of SOD1 to Golgi membranes [63, 64]. To confirm this, we transfected RFPtagged forms of wildtype and mutant SOD1 togetherwith MannII-GFP in NSC-34 cells. After extraction ofsoluble proteins, co-localization and Pearson correlationanalysis showed that both RFP-tagged SOD1wt, SOD1G85Rand SOD1G93A indeed significantly co-localize withMannII-GFP-labeled Golgi membranes whereas RFP ismainly nuclear (Fig. 3a, upper three panels).Since the Golgi membrane is a major site of microtubule polymerization and nucleation in motor neurons
Bellouze et al. Molecular Neurodegeneration (2016) 11:43Fig. 3 (See legend on next page.)Page 6 of 20
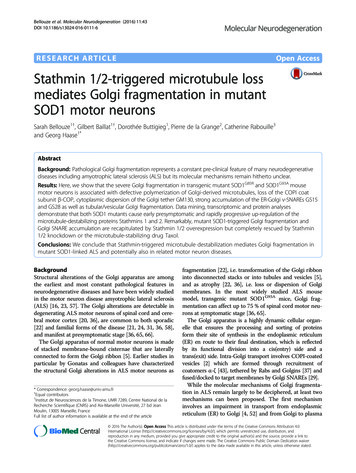
Bellouze et al. Molecular Neurodegeneration (2016) 11:43Page 7 of 20(See figure on previous page.)Fig. 3 SOD1 mutants impair polymerization of Golgi-derived microtubules. a. Images show NSC-34 cells expressing RFP or SOD1 variants taggedwith RFP after extraction for soluble proteins and labeling with MannII-GFP (Golgi) and antibodies against α-tubulin (microtubules). Merged RFP/MannII-GFP images show that both wildtype SOD1 (arrow) and mutant SOD1 (arrowheads) localize to Golgi membranes. This is confirmed byPearson’s correlation analysis (RFP-SOD1wt 0.74 0.09, RFP-SOD1G85R 0.72 0.09, RFP-SOD1G93A 0.77 0.14, RFP 0.13 0.14, statistical significanceSOD1 variants vs RFP : p 0.0006 by student’s t-test). Mutant SOD1G85R and SOD1G93A specifically cause rarefaction of microtubules around fragmented Golgi profiles (arrowheads in lower panel). b. Biochemical fractionation of total (T), soluble (S) and polymerized (P) tubulins. Cells expressing SOD1G85R or SOD1G93A display a decreased ratio of polymerized detyrosinated (detyr-) tubulin. The ratio of polymerized α-tubulin is alsodecreased. Polymerization of β-actin is not affected by mutant SOD1. % P is equivalent to P/(P S), * p 0.01 by Mann–Whitney test, n 3 experiments each. c. Flow cytometry of cellular microtubules in NSC-34 cells after extraction of soluble tubulins, microtubule stabilization and intracellular labeling with α-tubulin-FITC antibodies. Cells expressing SODwt (in grey, upper panel) display normal levels of α-tubulin-containingmicrotubules in comparison to cells expressing RFP (in black). Cells expressing mutant SOD1G85R (in green, middle panel) or mutant SOD1G93A (inblue, lower panel) show decreased levels of cellular microtubules. Median fluorescence signal per cell: 15.800 (RFP), 15.900 (SOD1wt), 11.600(SOD1G85R), 8.418 (SOD1G93A). Statistical significance by chi square test, * T(x) 200, ns T(x) 0. d. Images showing transfected NSC-34 cells thatwere treated with Nocodazole (left column) and restored to drug-free medium for 12 min (right four columns). Cells were identified by RFP expression (not shown), Golgi profiles were identified by MannII-GFP and growing microtubules with antibodies against α-tubulin (pseudocoloredin red). Mutant SOD1G85R and SOD1G93A impede regrowth of Golgi-derived microtubules (zoomed insets). Scale bar 5 μm. e. Diagrams showingreduced growth rate of Golgi-derived microtubules in cells expressing RFP- SOD1G85R (upper panel) or RFP- SOD1G93A (lower panel) as comparedto cells expressing RFP- SOD1wt or RFP. Microtubule length represents mean of mean of 12 cells per time point and condition and a total of1495 microtubules analyzed. Statistical significance **** p 0.0001 (RFP-SOD1G85R vs RFP or vs SOD1wt) and **** p 0.0001 (RFP-SOD1G93A vs RFPor vs SOD1wt) by ANOVA test and Tukey’s multiple comparison test. f. Diagrams showing Taxol-mediated rescue of MannII-GFP-labeled Golgi fragmentation in cells expressing mutant SOD1G85R or SOD1G93A each tagged to RFP. Statistical significance * p 0.01 (Taxol vs mock) by Mann–Whitney test, n 50 cells per well and 4 replicate wells were analyzed per condition[5, 8, 14], we then tested whether SOD1 mutants affectthe polymerization of microtubules. By IF, microtubulesappear disorganized and rarefied around MannII-GFP-labeled Golgi punctae in mutant SOD1 cells when comparedto control cells (Fig. 3a, lower panel). To confirm this, webiochemically analyzed detyrosinated tubulins, which aremarkers of Golgi-associated microtubules [50, 60], by determining their total, soluble and polymerized fractions(Fig. 3b). The ratio of polymerized versus total detyrosinatedtubulin is significantly lower in mutant SOD1G85R cells andSOD1G93A cells than in SOD1wt cells (Fig. 3b, upper panels).The ratio of polymerized versus total α-tubulin in mutantSOD1 cells is also decreased, albeit to a lower extent (Fig. 3b,middle panels). These data indicate that both SOD1 mutantsimpede the polymerization of Golgi-derived microtubules.To determine the microtubule content in individual cells,we extracted soluble tubulins, labeled polymerized microtubules with FITC-coupled antibodies against α-tubulinand performed flow cytometry. This method accuratelymeasures cellular microtubules since the flow cytometry signals of cells are increased after treatment withthe microtubule-stabilizing drug Taxol, decreased aftertreatement with the microtubule-disrupting drug Nocodazole and correlated with the amount of biochemicallyfractionated microtubules (Additional file 1: FigureS3A-B). Using this technique, we found significantlyless polymerized microtubules in cells expressing RFPtagged SOD1G85R or SOD1G93A than in cells expressingRFP-SOD1wt or RFP (Fig. 3c), confirming the mutantSOD1-triggered loss of cellular microtubules.To directly measure the polymerization rate of microtubules at the Golgi, we incubated control and mutantSOD1 NSC-34 cells with Nocodazole, restored the cellsto drug-free medium and measured the regrowth ofGolgi-derived microtubules over 12 min using αtubulin/MannII-GFP labeling (Fig. 3d). In control cells expressing RFP or RFP-SOD1wt, small microtubule astersform at Golgi profiles within few minutes after nocodazole washout. These microtubules then grow rapidly, confirming the capacity of Golgi membranes to nucleatemicrotubules [5, 8, 14]. In mutant SOD1 expressing cells,however, Golgi-derived microtubule asters are rare andgrow slowly. Their mean growth rate is reduced by over50 % in SOD1G85R and SOD1G93A cells in comparisonto RFP expressing cells (Fig. 3e). Wildtype SOD1 doesnot impede growth of Golgi-derived microtubules(Fig. 3e). Taken together, these data indicate that SOD1mutants decrease the growth rate and steady statelevels of Golgi-derived microtubules.Last, to test whether these microtubule defects are responsible for the observed Golgi alterations, we stabilizedmicrotubules in mutant SOD1- and control-transfectedcells by treating the cultures with Taxol (10 nM) from 0 to4 DIV. We found that Taxol significantly reduces thepercentage of mutant SOD1-transfected cells harboringMannII-GFP-labeled Golgi alterations (Fig. 3f), indicatingthat microtubule defects mediate the mutant SOD1triggered Golgi alterations.Mutant SOD1 causes up-regulation of Stathmin 1 and 2gene expressionTo identify the upstream triggers of microtubule loss andtubular/vesicular Golgi fragmentation in mutant SOD1motor neurons, we performed data mining and bioinformatic analyses. We first analyzed five studies comparingthe gene expression profiles of SOD1G93A and control
Bellouze et al. Molecular Neurodegeneration (2016) 11:43Page 8 of 20motor neurons isolated by laser capture microdissectionfrom adult spinal cord [19, 28, 33, 40, 42]. Two studiesshowed that cytoskeleton-related genes annotated tothe Gene Ontology (GO) terms “cytoskeletal part/GO:0044430” and “cytoskeleton/GO:0005856” are significantly dys-regulated: 14 genes at presymptomaticstage [33]), 76 genes at early disease stage [33]) and 42genes at end stage [42]). Among those, genes annotatedto the microtubule cytoskeleton (GO:0015630) displaysignificant dys-regulation [33].To identify individual dys-regulated genes linked tomicrotubules, we then compared by bioinformatics analysis the publically available gene expression profilesfrom mutant SOD1 G93A and control motor neuronsdeposited in the Gene Omnibus database by Ferraiuoloet al. as GSE10953 [19] and by Nardo et al. as GSE46298[40]. Given the similarities between pmn and SOD1, wefirst focused on tubulin binding co-factors but foundthat the six genes Tbca, Tbcb, Tbcc, Tbcd, Tbce andTbcel (Tbce-like) are not significantly dys-regulated inmutant SOD1 motor neurons at any time point (foldchange 1.5, p 0.05, Table 1).By contrast, we found three Stathmin genes whose expression was significantly modulated in presymptomaticmutant SOD1G93A motor neurons when compared to control. Stathmin 1 and Stathmin 2 were up-regulated by 1.87and 1.63 fold respectively, whereas Stathmin 3 was downregulated by 1.71 fold at P60 (p 0.05, Table 2). Stathmin 1up-regulation (by 1.68 fold) also tended to occur atend stage in an independent dataset of Perrin et al. [42],although not reaching statistical significance (p 0.06,Table 2).Table 1 Gene expression profiles of tubulin-binding cofactors in mutant SOD1 motor neuronsFerraiuolo et al. 2007Presymptomatic G93A vs. Ctrl (P60)Symptomatic G93A vs. Ctrl (P90)Gene 1,61 01up1,019,87E-01down1,079,18E-01Tbceldown1,079,21 E-01down1,127,91 E-01up1,108,09E-01Nardo et al. 2013Presymptomatic C57 G93A vs. 231,81 01down1,155,21 E-01down1,048,46E-01Tbccup1,162,81 1,172,70E-01up1,101,05E-02Tbcelup1,066,01 E-01up1,104,47E-01down1,096,51E-01Onset C57 G93A vs. CtrlEndstage G93A vs. Ctrl (P120)Symptomatic C57 G93A vs. CtrlNardo et al. 2013Presymptomatic 129sv G93A vs. CtrlGeneRegulationFold-ChangeP-ValueOnset 129sv G93A vs. CtrlRegulationFold-ChangeP-ValueSymptomatic 129sv G93A vs. down1,112,51 -01down1,028,61E-01Gene expression profiles from mutant SOD1 G93A and control motor neurons isolated by laser capture microdissection at different stage of disease [19, 40]respectively were downloaded from the Gene Omnibus database and analyzed with EASANA software based on FAST DB annotations [12, 13]. Gene dysregulationwas considered significant at fold changes 1.5 and p-values 5E-02Genes encoding tubulin-binding cofactors Tbca to Tbcel are not significantly dys-regulated in mutant SOD1 motor neurons at any time point in the datasetsGSE10953 [19] or GSE46298 [40]Note that mutant SOD1 G93A mice with genetic backgrounds C57BL/6 or 129sv and corresponding control mice were analyzed in the study of Nardo andcolleagues [40]. Here, onset of disease was defined when mice showed first signs of paw grip strength impairment and when body weight started to decline.Symptomatic disease was defined when mice displaye
Golgi SNARE accumulation are recapitulated by Stathmin 1/2 overexpression but completely rescued by Stathmin . Open Access This article is distributed under the terms of the Creative Commons Attribution 4.0 . and the source, provide a link to the Creative Commons license, and indicate if changes were made. The Creative Commons Public Domain .