Transcription
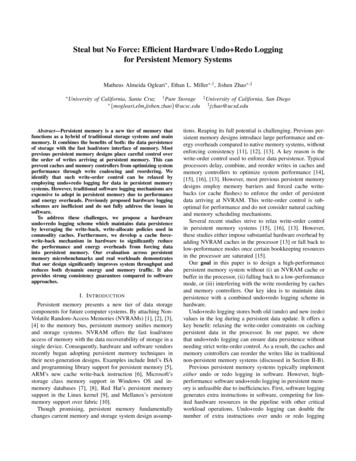
SPWLA 1st Annual India Regional Conference, 19-20 March, 2007Sonic Logging in Horizontal Wells – Applications, Challenges and Best PracticesJennifer Market and Wyatt Canady, Halliburton Energy Services, Houston, TexasCopyright 2007, held jointly by the Society of Petrophysicists and WellLog Analysts (SPWLA) and the submitting authors.(common for wireline acoustic data). Waveformreflection analysis and waveform attribute analysis arealso excellent tools for fracture identification. Finally,multi-azimuth tools allow for geosteering applications.stThis paper was prepared for presentation at the 1 Annual IndiaRegional Conference Symposium held in Mumbai, India, 19-20 March,2007.WELLBORE IMAGINGSonic imaging is an exciting developing field bothfor wireline and LWD. Simple radial profiling methodsprovide maps of the radial velocity gradient. Threedimension imaging allows for mapping of the azimuthalvelocity field.ABSTRACTHorizontal and high angle wells present specialchallenges to acquiring and interpreting sonic data.Some aspects, such as properly centralizing andorienting tools, require translating a thoroughunderstanding of tool physics into best practices fordata acquisition. Additionally, high angle wells presentsome special acoustic responses, such as compressionalanisotropy, that must be understood and accounted forwhen relating sonic well logs to seismic data.This paper presents a review of sonic tool physics inhorizontal wells and recommends best practices foracquiring high quality data. Examples of good and baddata acquired in high angle wells will be discussed,paying special attention to common processing pitfallswhich often lead to erroneous interpretation. Finally,we will review compressional and shear anisotropy, anunderstanding of which is essential to many high anglewells.INTRODUCTIONLogging high angle wells presents opportunities toexplore new applications, but also presents particularchallenges to acquiring good log data. This is definitelytrue with sonic tools. Anisotropy, imaging, fracturecharacterization, and geosteering are all particularlyapplicable in high angle holes. Centralization, boreholecompensation, compressional anisotropy, and loggingwhile-drilling (LWD) shear anisotropy all presentchallenges to data acquisition and interpretation andshould be handled carefully both at the data acquisitionand processing steps.Fig. 1. Example of a radial profile showing invasion. The colourindicated the slowness.ANISOTROPYThe velocity of acoustic waves in a formation is afunction of three properties: mechanical properties ofthe rock, nature of variations in the mechanicalproperties throughout the rock volume (intrinsicanisotropy), external stresses on the formation, andvariations in the stress field (stress related anisotropy).The compressibility of a material is characterized byits four moduli: Young’s modulus, Poisson’s ratio,shear modulus, and bulk modulus. The acousticproperties of the material are related to these moduli,with increased moduli being expressed as increasedresonance frequency and propagation velocity.APPLICATIONSHigh angle wells generally cross the intrinsic stressfield, providing opportunities for 3D applications.Wellbore imaging with sonic tools is a developing field,which allows the measurement of radial andcircumferential velocity. Shear anisotropy analysis isbecoming standard practice for wireline logging. Shearwave anisotropy analysis provides maximum andminimum shear velocity, anisotropy magnitude, anddirection. Anisotropy analysis is also an excellent toolfor fracture identification and characterization1
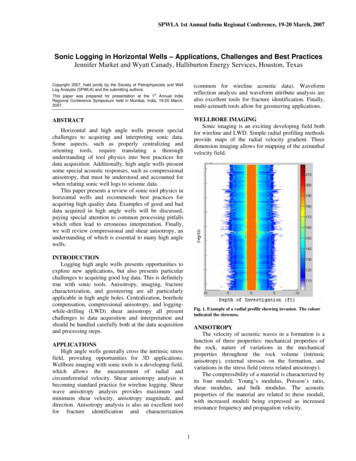
SPWLA 1st Annual India Regional Conference, 19-20 March, 2007The propagation of an acoustic wave though avolume of material is related to the uniformity of themoduli in that volume. Materials in which the moduliare uniform throughout their volume are deemedisotropic, and the velocity of an acoustic wavepropagating in an isotropic material is independent ofdirection. Variation in moduli though a volumeproduces a varied acoustic velocity in that volume;depending upon which direction we measure, we seedifferent velocities. Materials that exhibit this propertyare deemed to have intrinsic anisotropy. Mostformations exhibit some degree of intrinsic anisotropy.Examples of some sources of intrinsic anisotropyinclude porosity and lithology changes, bed boundaries,and cross bedding.External forces (stresses) on a volume of materialaffect the propagation of acoustic waves propagating byincreasing or decreasing the moduli of the material.Increasing stress increases the velocity of thepropagating acoustic wave. If the applied stresses areuniform throughout the volume of the material, thenvelocity changes are isotropic: the same in alldirections. If the applied stress field is non-uniform, theresulting velocity field is anisotropic. Common sourcesof stresses on formations include weight of overburdenmaterial and tectonic forces.Modern crossed-dipole logging tools measureazimuthal shear anisotropy by generating shear-likeflexure waves along the borehole wall. Excited in twoorthogonal axis (x and y), the wave are recorded byboth in-line and cross-line receivers.XXXYYXYYFig. 2. (Shear) Anisotropy example. A description of interpretingthis plot is found in the quality control section at the end of thispaper.X-axis source and record with theX-axis receiversX-axis source and record with theY-axis receiversY-axis source and record with theX-axis receiversY-axis source and record with theY-axis receiversFig. 3. Illustration of compressional anisotropy. In the sameformation, the compressional slowness in this example field studyranged from 78 to 88 us/ft, depending on the well trajectory.FRACTURE CHARACTERIZATIONFractures change the stress fields in formations.When the changes are sufficiently large, they can alsoalter the properties of the acoustic waves travelingthrough the formation. The effect of that change and itsmagnitude are related to the dimensions of the fracture,the angle at which the fracture crosses the acoustic path,the nature of the acoustic wave, and the mechanicalbonding of the fracture surfaces.The interaction of fractures and acoustic waves isusually a complex process and rarely produces effectson acoustic logs that uniquely identify the fracturesfrom other formation effects. Instead, factureidentification is a subjective process, usually involvinganalysis of several fracture indicators. The commonindicators for the acoustic family of tools include:Compressional anisotropy (P-wave anisotropy)cannot be measured with the method described abovefor dipole flexure waves. P-waves propagatelongitudinally (along the direction of the borehole)rather than transversely and are not sensitive to theazimuthal anisotropy. Both wireline and LWD acoustictools measure the compressional velocity along the axisof the wellbore, which may be neither aligned with thevertical nor horizontal velocity field of the formation.Vertical compressional velocity can be derived usingThomsen parameters measured either from high qualityseismic data or sonic data collected multiple welltrajectories through the formation of interest.2,62
SPWLA 1st Annual India Regional Conference, 19-20 March, 2007Monopole (and single-axis dipole) acoustic tools Reduction of energy of the shear wave Chevrons – reflections of shear wave Distortion of the shear envelope Reduction of Stoneley amplitude Chevrons – reflections of the Stoneley wave Comparison of measured Stoneley velocitywith modeled Stoneley velocityCrossed-Dipole Acoustic tools Reduction of flexural mode amplitude Presence of anisotropyCircumferential Acoustic Scanners and Imagingtools: Near wellbore images of fracturesLWD IN HIGH ANGLE WELLS (GEOSTEERING)LWD resistivity, density, and sonic derived imagesof the borehole are particularly useful guides forgeosteering in high angle wells. Geosteering with sonictools is complementary to the more common resistivitysteering because it depends less on bed contrast andmeasures velocities which are more easily matched toseismic surveys. Even with the narrow bandwidth ofLWD data transmission, multi-azimuthal velocityimages may be acquired in real-time for geosteeringpurposes.Open fractures appear as impedance contrasts toacoustic waves. Open fractures reduce the moduli of thevolumes of rock in which they are located.Compressional, shear, and flexure modes are stronglyaffected by open fractures if those fractures intersect thepaths of propagation. Generally, fractures orientedparallel to the direction of propagation exert littleinfluence on body waves. Open fractures–fractures thatpermit movement of fluids–can have a strong influenceon Stoneley waves, regardless of their orientationrelative to the direction of propagation.Healed or closed fractures tend to have very littleimpedance contrast, relative to the impedance of thehost rock. For that reason, healed fractures rarely affectthe propagation of acoustic waves.Vertical wells drilled into formations with normal,isotopic stresses generally show a vertical orientation tonatural and induced fractures. Wells drilled at an angleto the dominate stress field will generally exhibitnatural and induced fractures intersecting or crossingthe borehole at an angle. Horizontal sections ofdeviated wells, drilled in a normal, isotropic stress fieldwill show fractures crossing the borehole orthogonal tothe axis of the borehole.Fig. 5. Illustration of sonic geosteering. The main figure shows thewell trajectory while the inset (top) shows the radial profilemeasure by the LWD multi-axis tool. The blue (centre of inset) isthe mud velocity.SPECIAL CHALLENGES/TOOL OPERATIONHigh angle wells present logging conditions inwhich it can be particularly challenging to acquire andanalyse sonic data effectively. Wireline tools should becentralized to acquire high quality monopole data, but itis particularly critical that they be centralized pensation must also be considered in highlydeviated wells. Finally, dispersion effects on boreholemodes are affected by eccentering, both in the wirelineand LWD cases, and careful consideration of theuncertainty associated with dispersion is in order.High angle wells present particularly difficultchallenges to the acquisition of useable acoustic data.Tool centralization is extremely important in acoustictool field operations. Acoustic tool eccentricity cancause distortion and amplitude reduction of monopolewaveform data, severely reducing the quality measuredvelocity and semblance computations. Even a smallamount of eccentricity of the crossed-dipole tool canresult in total absence of measurable flexure modewaveforms.Borehole compensation must also be considered inhighly deviated wells.Fig. 4a. Illustration of detecting fractures using reflector analysis.3
SPWLA 1st Annual India Regional Conference, 19-20 March, 2007point. During the firing of the monopole source, thefour receivers at each depth station are summed tocompute the monopole waveform. During dipole firing,opposing pairs of receivers are summed to provide theXX, XY, YX and YY waveforms.Finally, dispersion effects on propagatingwaveforms are accentuated by tool eccentricity.MPXXXYYXYYFig. 6a. Ideal tool – centred and no tiltMA MB MC MDXA-XCXB-XDYA-YCYB-YDModern cross-dipole wireline tools consist of amonopole transmitter and two dipole transmitters whichare oriented perpendicular to each other. They also have(at least) four azimuthal receivers spaced 10ft from thetransmitters. The monopole source is omni directionaland is used at high frequencies (6 kHz) to excitecompressional and refracted shear arrivals (the mostcommon basic service for sonic tools) and at lowfrequencies ( 5 kHz) to excite Stoneley waves (notalways used).When we fire the source, the compressional wavesfrom the transmitter reach the borehole wall and arecritically refracted, splitting into compressional andshear waves. As they propagate in bulk rock along theborehole wall, they generate a disturbance at theborehole wall. It is this disturbance that sendscompression and shear energy back into the mudcolumn where it can be detected by the receivers in thearray.Fig. 6b. Off centred tool without tiltFig. 6c. Tilted toolFig. 6d. Hole washout – each receiver in the array sees a differenthole diameterFig. 6e. Tool sag – similar to tool tiltReceiver ArrayIsolatorTransmittersFig. 7. Modern wireline sonic tool diagram.Fig. 6f. Off-centre LWD tool – note the scale compared to (above)wireline examples.Tool Design/Operation. Before beginning a detaileddiscussion of logging issues and resolutions, it may behelpful to review modern wireline and LWD sonic tooldesigns and operation. The equipment of individualservice providers may differ in detail but will operateusing the following common acoustic mechanisms.Fig. 8. Illustration of a modern wireline tool source and receiverconfiguration.Wireline. Modern acoustic sondes rely on two or morearrays of receivers located along the length of thesonde. There are usually four to eight receivers in eacharray, four or more arrays to a sonde. Receivers at eachdepth are identified by their position relative to anazimuthal reference point. Typically the arrays aredesignated A, B, C, and D, starting at the reference4
SPWLA 1st Annual India Regional Conference, 19-20 March, 2007all of the methods make use of the fact that we can firethe x-axis transmitter and measure the response on thex- and y- axes, and also fire the y-axis transmitter andmeasure the response at the y- and x- axis receivers.These four sets of data are then processed to computethe shear velocity field azimuthally around the wellbore(at approximately 2 degree resolution).LWD. Commercial LWD tools in operation spanfrom the simple single monopole transmitter (shortreceiver array compressional/refracted shear tools) toadvanced multipole source, multiple long-spacedazimuthal receiver array tools. Acquiring compressionaland refracted shear data is similar to the monopolemethods described for wireline. However, becausecentralization is often impractical under LWDconditions, multi-azimuth tools may often process thedata for each receiver array separately (somethingwhich is generally only done in wireline when the toolis off-centre or the hole in poor condition). The data arethen combined by averaging (or semblance-weightedaveraging). Just as in the wireline case, LWD tools canmeasure shear velocities directly only when the shearvelocity is faster than the fluid velocity. In the case inwhich the shear is slower than fluid, the situation iscomplicated by the presence of the drill collar, a muchmore significant body of steel than the wirelinecounterpart. The dispersion section later in this paperdetails the various types of slow-shear LWD toolsavailable.Fig. 9. Critical refraction and wave propagation for fast and slowformations.However, when the shear velocity is slower than thefluid velocity or if we want to interpret anisotropicshear fields, the dipole sources are used to exciteflexural waves. Flexural waves (for wireline tools) aredispersive; when measured at low frequencies, theytravel at (or very near) to shear velocities, and at highfrequencies they travel at significantly slowervelocities. Dipole sources are also directional (whilewireline monopole sources generally are omnidirectional), meaning we can use them to determinevariation in shear velocity over azimuth (anisotropy).Centralization. Centralization should always be aconcern for wireline sonic tools, especially whenanalysing crossed-dipole data. Centralization can be anissue for LWD tools, but they are designed to operateeven when off-centre and do not rely as much oncombining azimuthal data.Wireline. If we return to our generic four receiver tool,we can examine the effects of centralization on modernwireline tools.Fig. 12. Ray paths for a simple, centralized tool.If we consider an ideal centralized case (Fig. 12),we would expect the ray paths from the source to eachreceiver to be the same. To enhance the quality of thedata, we could stack the waveforms from each of theazimuthal receiver arrays together to increase the signalto noise ratio as in Fig. 8. Older style tools do thiscombination downhole and only transmit the combinedFig. 10. Dispersion curve for a wireline flexural mode. At 1.8 kHz,the flexural mode travels at the shear speed of 240 us/ft.(Shear) Anisotropy is calculated by variousproprietary methods, such as using Alford rotation1 but5
SPWLA 1st Annual India Regional Conference, 19-20 March, 2007individually processed to calculate the correctformation velocity. A useful technique for processingsonic data that have been recorded by a poorly centredtool or by bad borehole is to process each individualreceiver array separately.waveforms to the surface, but more recent tools gain aconsiderable quality improvement by transmitting allfour (or eight) azimuthal sets of waveforms to surfacefor in-depth analysis.Fig. 13 – In a centralized case, refracted body wave will arrive ateach azimuthal receiver (at the same station) simultaneously,such that we can sum the individual receivers to enhance thesignal-to-noise ratio.If the tool is offset from the centre of the borehole,the path length from the borehole wall to the individualreceivers will vary (see Fig. 14). The result will be adisplacement of the peaks and valleys among therecorded waveforms. When the four waveforms areadded to create the monopole waveform (MP), thephase errors between the many peaks and valleyscauses distortion of the final summed MP monopolewaveform (see Fig. 15).Fig. 16. Processing individual receiver arrays instead of summingin the case of hole problems. From left to right: 4 arm-calliper,MA, MB, MC, MD, MP. Note that when hole condition is bad, theindividually processed results are sometimes better than thecombined results.Though centralization affects monopole dataquality, a more common issue that leads to incorrectdata interpretation is with the dipole data. Whenevershear velocities are slower than fluid velocities, we useflexural modes, generated by dipole sources, todetermine the shear velocity of the formation. While(monopole) Stoneley waves are in-phase arrivals (whenopposite receiver arrays are plotted together, they lineup), flexural wave are out-of-phase (when oppositereceiver waveforms are plotted together, they are 180degrees out of alignment). We take advantage of thisdifference when processing dipole data. Even when atool is centralized in a circular wellbore and we fire adipole source, the easiest mode to excite in the wellboreis the Stoneley wave. Generally, in the wireline case,the Stoneley wave is larger in amplitude than theflexural wave and dominates it in the semblanceprocessing (see Fig. 18a). However, just as addingazimuthal receiver will enhance the Stoneley wave, sosubtracting azimuthally opposed receiver arraysenhance the flexural and cancel the Stoneley wave. So,even though we can process separate receiver arrays toextract the flexural arrival, in centralized cases,combining opposite receiver arrays will greatly enhancethe signal-to-noise ratio,In poor hole conditions, subtracting oppositereceivers will not completely cancel the Stoneley waveFig. 14- Ray paths for an off-centre toolFig. 15 – (Left) Offset tool and paths of refracted acousticarrivals. (Right) Phase shifts (time delays) of acoustic arrivalsrecorded at four azimuthal receivers, as a function of tool offsetand orientation, and their sum.Rough or elongated boreholes can cause distortionto the waveforms, as well. Anything that causes delaysto the waveforms as recorded by the individualreceivers of the receiver array will cause distortion tothe final, summed waveform.As long as an eccentred tool is still parallel to thewellbore (as opposed to being tilted at an angle to theborehole wall), each azimuthal receiver array can be6
SPWLA 1st Annual India Regional Conference, 19-20 March, 2007from each azimuthal array separately, and then combinethe results through averaging. Some applications (suchas anisotropy and some slower-than-fluid shear modes)do indeed combine azimuthal receiver stations. In theselatter cases, all of the discussions presented above forwireline centralization apply. If we consider a typicalcase of a 6 ¾-in. LWD tool in an 8 ½-in. borehole, tooleccentricity is less than 1 in., which does limit theeffects of centralization on low frequency waveforms.and can actually diminish the flexural wave. One of themost common mistakes made in processing dipole datais identifying the Stoneley wave as the flexural arrival.Generally, this means that the shear velocities derivedfrom the dipole data are too slow – by as much as 20%!The quality control recommendations later in this paperdetail techniques to guard against this.Tool Tilt. When the tool is tilted such that it is nolonger parallel to the wellbore, it presents a somewhatmore complex problem than simple eccentricity. In thecase of simple eccentricity, when the tool is parallel tothe wellbore, but off-centre, the receiver arrays will stillsee the same move-out or velocity, and the primaryproblem only comes if the raw waveforms from eachside of the tool are combined. When the tool is tilted,however, each receiver array will observe apparentlydifferent velocities. The arrivals will be shifted(increased or decreased), according to the degree of tilt.Fig. 17. Left: Centralized tool, the flexural response is perfectlyout-of-phase and the monopole (Stoneley) is perfectly in-phase.Right: Severely off-centred tool.Fig. 18a. Dipole data showing the A(left, magenta) & C (right,red) receiver array data. The small out-of Stoneley wave (even ina centralized tool dipole firing-phase arrival visible in thewaveforms is the dipole (flexural) wave, while the large in-phasearrival is the Stoneley response.Fig. 19a. Illustration of tool tiltFig. 19b. Illustration of tool tiltFor example, if we take a single transmitter, singlereceiver array 6 ¾-in. diameter tool with two receiversspaced 3- and 5-ft from the transmitter and place it in a10-in. borehole filled with 200 us/ft mud and 100 us/ftcompressional velocity for the formation and take thetool to be centralized, we can calculate arrival times ofRcvr1 863 usRcvr2 1063 us.Slowness t/ x (1063us-863us)/(5ft-3ft) 100 us/ft.Now, if we take the same tool and tilt it 10 degreessuch that the transmitter is further from the boreholewall than the receivers (Fig. 19a), we would getRcvr1 949 usRcvr2 1206 usSlowness 128 us/ftFig. 18b. Results from processing the data of Fig. 18a such thatXX data XA-XC. When compared to Fig. 18a, note that theStoneley wave is now eliminated and we are left only with theenhanced flexural wave, as desiredCentralization and LWD sonic tools. Although all ofthe wireline centralization issues apply, if we weretrying to combine azimuthal receiver responses forLWD tools, most LWD tools are designed to beoperated on- or off-centre, because drilling constraintsdictate that fully centralizing a sonic tool is usuallyimpractical. Thus, LWD tools generally process data7
SPWLA 1st Annual India Regional Conference, 19-20 March, 2007precise or the tool is rotating between samples (as in theLWD case). This doubles the vertical resolution.In cases in which depth control is accurate, the toolis centralized, and rotation is minimal, such as isgenerally the case in wireline logging, we can increasethe vertical resolution (and signal-to-noise ratio) byusing common receiver processing which uses subarrays of each acquisition as they pass a depth interval.Vertical resolution can be achieved in the range of 1.5feet (0.5 meters) with this method. As centralizationand minimal rotation are essential for common receiverprocessing, comparing the results of common receivervs. common transmitter processing can indicatecentralization or hole condition issues.Now, if the source and receivers were on theopposite side of the tool (Fig. 19b), we would getRcvr1 768 usRcvr2 904.5 usSlowness 68.2 us/ftIf we average the results from each side, we have98.1 us/ft, which is quite close to the correct velocityeven for this extreme angle of tilt.Second generation tools dealt with the tilt issues byplacing a second transmitter above the receivers andaveraging the results of slowness calculated up-goingand down-going (Fig. 20a) or multiple azimuthalsources and receivers (Fig. 20 b).Summing receivers will lead to blurring of the dataand/or poor semblance in cases with considerable ( 5degree) tilt.Fig. 20a. Compensated single axis tool.Fig. 21. Common receiver vs. common transmitter processing.Common source processing is the primary standard method forsonic data velocity processing and is the best method to use in offcentred cases or when borehole condition is poor. Commonreceiver analysis can enhance the vertical resolution in thin bedcases and increase signal quality.Fig. 20b. Compensated multi-axis tool.Fortunately, it is unlikely to have more than a 3degree tilt over the length of the receiver array forLWD tools, which are large in diameter and restrainedin position by drill string stress limitations. Wirelinetools of smaller diameter and larger flexibility cansometimes operate at 10 degrees of tilt.The quality control section later in this paper willillustrate methods to check for tool tilt deration is the case in which the entire receiverarray is not in the same formation (thin beds) or if theborehole varies in size or shape over the length of thereceiver array (Fig. 6d). In such cases, the velocitycalculated over the entire length of the array (usingsemblance analysis) will not reflect accurately thevelocity of the formation. In such cases, we can eithersimply process the top and bottom halves of the arrayseparately in cases where depth control is not highlyFig. 22. Common source (left) vs. common receiver (right) in afinely layered zone.8
SPWLA 1st Annual India Regional Conference, 19-20 March, 2007do vary not only by velocity, but to a smaller degree areaffected by hole size, and mud properties. Thus, there isno way to quote the overall uncertainty due todispersion corrections, but each case must beconsidered individually. However, in general, theuncertainty as a result of the dispersion correction is inthe range of 1-3 us/ft.4,5DispersionWireline Dipole Tools. An essential (and oftenoverlooked) aspect of dipole shear logging is that weare not actually measuring the shear wave. We arerecording the flexural wave, which, at its low frequencylimit, travels at shear velocity. However, just firing adipole source is a guarantee that we will excite theflexural mode at the exact frequency which it travels atshear velocity.LWD monopole, dipole, and quadrupole tools.Dispersion of the borehole modes is a significantconsideration with LWD sonic tools, and one in whichwe cannot detail fully here.4,5 The presence of the drillcollar, which typically fills 50 to 80% of the wellbore,has a strong effect on the behaviour of the flexuralwave. It no longer converges to the shear velocity atlow frequency, but is dominated by the presence of thecollar. Modern LWD tools exploit various schemes ofdetermining shear velocities in slow formation usingmonopole, dipole, and quadrupole sources. Slowerthan-fluid shear logging with LWD tools is relativelyrecent technology (compared to wireline dipoletechnology), but hundreds of wells have successfullyused LWD tools to determine isotropic shear velocitiesin slow formations (when the shear is faster than fluid,monopole or refracted shear is measurable, just as withwireline tools). To date, LWD sonic tools do not yetdeliver anisotropic shear interpretations routinely,because the aforementioned influence of the drill collarat low frequencies makes designing an exact wirelineequivalent tool complex. One advantage tomonopole/dipole LWD tools at higher frequencies isthat the Stoneley and flexural waves are very close invelocity, so tool centralization (which would benecessary for adding/subtracting waveforms) is nothighly necessary.If the sources are fired at the appropriate frequency(the frequency at which the flexural mode needs nodispersion correction), we still must consider theexcitation function, which basically says “if we fired aninfinitely broad-band source, at what frequencies wouldthe flexural mode be excited?” The frequency range atwhich we actually record the flexural mode is acombination of the source we fire and the response ofthe formation. So, what we do in practice is to fire thesource at a frequency such that the dispersion correctionis small but the formation response amplitude is good.Thus, we may still need a small dispersion correction insome cases.Fig. 23. Dispersion correction display. The coloured plot on theright shows the flexural dispersion curve for a particularformation (see parameters on top left), while the blue curve onthe left shows the accompanying excitation function. If we were tofire a broad-band source, a majority of the energy would beexcited at 3.5 kHz, where the dispersion correction would be anon-negligible 15 us/ft (172-157us/ft). However, if we were to firea low frequency source at a centre frequency of 1.5 kHz, we couldget further down on the dispersion curve needing, for example,only 2 us/ft at 2 kHz. We then apply a dispersion correctionpoint-by point through the log section. The QC plots that showthe monopole and dipole shear comparisons are a good indicatorof the success of the dispersion corrections.Fig. 24. Dispersion example for a slow formation. Comparingcommon wireline and LWD modes used in commercial toolsRECOMMENDED PRACTICESData quality is best when acquired as soon aspossible after drilling with a centralized tool in a quietenvironment. However, because ideal conditions are notIn general, dispersion corrections for wireline dipoleflexural modes are less than 2%. Di
wireline examples. Too Design/Operation. Before beginning a detailed discussion of logging issues and resolutions, it may be helpful to review modern wireline and LWD sonic tool designs and operation. The equipment of individual service providers may differ in detail but will operate using the following common acoustic mechanisms. l Wireline.