Transcription
Policy ReportMarch 2016Non-Emergency Medical Transportationand the Iowa Health and Wellness PlanSuzanne BentlerAssitant Research Scientist*Brooke McInroySurvey Research Manager*Peter DamianoDirector*Professor, Preventive &Community Dentistry**Elizabeth MomanyAssistant Director, HealthPolicy Research Program,Associate Research Scientist*Tessa HeerenResearch Assistant*University of Iowa Public Policy Center 209 South Quadrangle, Iowa City, IA 52242-1192O - 319.335.6800 F - 319.335.6801 www.ppc.uiowa.eduPage 1Return to TOC
ContentsIndex of Tables and Figures . . . . . . . . . . . . . . . . . . . . . . . . . . . . . . . . . 3Background . . . . . . . . . . . . . . . . . . . . . . . . . . . . . . . . . . . . . . . . . . . . . . 4Methodology . . . . . . . . . . . . . . . . . . . . . . . . . . . . . . . . . . . . . . . . . . . . . 5Member Surveys . . . . . . . . . . . . . . . . . . . . . . . . . . . . . . . . . . . . . . . . . 5Survey Instruments . . . . . . . . . . . . . . . . . . . . . . . . . . . . . . . . . . . . . . . 5Survey Field Methods . . . . . . . . . . . . . . . . . . . . . . . . . . . . . . . . . . . . . . 5Response Rates . . . . . . . . . . . . . . . . . . . . . . . . . . . . . . . . . . . . . . . . . 6Characteristics of Respondents & Non-Respondents . . . . . . . . . . . . . . . . . . 6Administrative Data . . . . . . . . . . . . . . . . . . . . . . . . . . . . . . . . . . . . . . 7Analytic Methods . . . . . . . . . . . . . . . . . . . . . . . . . . . . . . . . . . . . . . . . . 8Results . . . . . . . . . . . . . . . . . . . . . . . . . . . . . . . . . . . . . . . . . . . . . . . . . 11Demographic Characteristics . . . . . . . . . . . . . . . . . . . . . . . . . . . . . . .11Health Status and Utilization of Health Care Services . . . . . . . . . . . . 12Need and Access to Health Care Services . . . . . . . . . . . . . . . . . . . . 15Transportation and Access to Health Care . . . . . . . . . . . . . . . . . . . . 18Factors Related to Experiencing an Unmet NEMT Need . . . . . . . . . . 21Relationship of Unmet NEMT Need with Utilization of Health CareServices . . . . . . . . . . . . . . . . . . . . . . . . . . . . . . . . . . . . . . . . . . . . . . 22Limitations . . . . . . . . . . . . . . . . . . . . . . . . . . . . . . . . . . . . . . . . . . . . . 26Conclusions . . . . . . . . . . . . . . . . . . . . . . . . . . . . . . . . . . . . . . . . . . . . . 26Appendices . . . . . . . . . . . . . . . . . . . . . . . . . . . . . . . . . . . . . . . . . . . . . 28Appendix A - Survey Instrument . . . . . . . . . . . . . . . . . . . . . . . . . . . . 29Appendix B – Summary of Open-Ended Comments . . . . . . . . . . . . . 33Page 2Return to TOC
Index of Tables and FiguresTable 1.Response Rates for IHAWP-WP, IHAWP- MPC, MSP-FMAP . . . . . . . . 6Table 2.Respondents vs. Non-Respondents by Plan Type . . . . . . . . . . . . . . . 7Table 3.Factors Associated with Unmet NEMT Need . . . . . . . . . . . . . . . . . . 22Table 4.Factors associated with having a well care visit. . . . . . . . . . . . . . . 23Table 5.Factors associated with having an acute care visit. . . . . . . . . . . . . 24Table 6.Factors associated with having an emergency department visit . . 25Figure 1.Age, Gender, and Race of Respondents by Plan . . . . . . . . . . . . . . . 11Figure 2.Education level and Urban/Rural Status of Respondents . . . . . . . . 12Figure 3.Self-Reported Physical Health . . . . . . . . . . . . . . . . . . . . . . . . . . . . 13Figure 4.Self-Reported Mental Health . . . . . . . . . . . . . . . . . . . . . . . . . . . . . . 13Figure 5.Self-Reported Functional Limitations, Physical & Mental HealthProblems . . . . . . . . . . . . . . . . . . . . . . . . . . . . . . . . . . . . . . . . . . . . . 14Figure 6.Well Care, Acute Care, and Emergency Department Visits . . . . . . . 15Figure 7.Self-Reported Need and Unmet Need for Routine Care . . . . . . . . . . 16Figure 8.Usual Source of Care . . . . . . . . . . . . . . . . . . . . . . . . . . . . . . . . . . . . 16Figure 9.ED Visits and Potentially Avoidable ED Visits . . . . . . . . . . . . . . . . . . 17Figure 10. Average Distance From Health Care Providers . . . . . . . . . . . . . . . . 18Figure 11. Transportation to Health Care Visits: Need, Unmet Need, andWorry About Cost . . . . . . . . . . . . . . . . . . . . . . . . . . . . . . . . . . . . . . 19Figure 12. Means of Transportation to Health Care Services . . . . . . . . . . . . . . 20Figure 13. License status, Household Vehicles, and Public Transit . . . . . . . . . . 21Page 3Return to TOC
BackgroundOn January 1, 2014 Iowa implemented the Iowa Health and Wellness Plan (IHAWP). IHAWPexpanded health coverage for low income Iowans through two separate coverage programs Iowa Wellness Plan and Iowa Marketplace Choice Plan. The Iowa Wellness Plan (IHAWP-WP) isadministered by the Medicaid program and covers adults ages 19 to 64 with income up to andincluding 100% of the Federal Poverty Level (FPL). IHAWP-WP members can choose a provider fromthe statewide provider network. In the Iowa Marketplace Choice Plan (IHAWP-MPC), adult (ages 19 to64) members with income from 101-133% of the FPL get health care coverage through private insurers(Coventry Health Care and CoOportunity Health) with plans on the Health Insurance Marketplaceand Medicaid pays the members’ premiums for the health plan. IHAWP-MPC members get theirhealth care from providers approved by their private health plan. The IHAWP has been modified inits first 2 years. CoOportunity Health withdrew from the IHAWP-MPC at the end of November 2014.1CoOportunity members were automatically transitioned to IHAWP-WP providers on December 1,2014, however; they retained their designation as IHAWP-MPC members.Programmatically, the IHAWP was designed to include a benefit structure more like commercialinsurance than traditional Medicaid. Specifically, IHAWP benefits were based on the state of Iowaemployees’ commercial health insurance plan and therefore does not contain the extensive benefitstraditionally associated with Medicaid under the State Plan and, in particular, does not include thenon-emergency medical transportation (NEMT) benefit.Briefly, the Code of Federal Regulations requires States to “specify that the Medicaid agency willensure necessary transportation for beneficiaries to and from providers.”2 Thus, all states are requiredto make NEMT available to their Medicaid beneficiaries. However, the provision of NEMT servicesand reimbursement methodologies are determined by the individual state Medicaid programs. InIowa, an NEMT service broker called TMS Management Group3 is used to manage NEMT services,including the authorization of transportation, verifying member and trip eligibility, processingtransportation claims and reimbursements, and auditing trips and claims.4The Centers for Medicare & Medicaid Services (CMS) initially approved a waiver of the state ofIowa’s responsibility to provide NEMT services for IHAWP members during the first year of theIHAWP (January 1, 2014 – December 31, 2014) with the possibility of extending the waiver basedon an evaluation of the impact on member access to care. After CMS reviewed preliminary dataon NEMT and access, Iowa’s NEMT waiver for the IHAWP was extended through July 31, 2015during which time a review of IHAWP member experiences (based on 2014 survey data) regardingtransportation and access to care could be conducted. The findings from this data were mixed withsomewhat more IHAWP-WP members (who do not have an NEMT benefit) than traditional MedicaidState Plan members (who do have an NEMT benefit) experiencing an unmet need for transportationto or from a health care visit. However, the difference was not statistically significant. Due to theseresults, CMS extended the NEMT waiver through March 31, 2016 (and subsequently through June30, 2016) and requested the independent evaluators of the IHAWP conduct an additional survey ofIHAWP and Medicaid State Plan (MSP) members regarding transportation and access to health careto provide additional information to consider before granting further extensions of the NEMT waiver.In response to this request, the Public Policy Center fielded a survey to over 30,000 IHAWP-WP,IHAWP-MPC, and MSP members (10,180 from each program) from October 28, 2015 – January 15, 2016.This report includes the findings from the analyses of the survey data and associated administrativeclaims experiences of the members who responded to the survey.1234Page 4Return to TOCIowa Marketplace Choice Plan Changes. Iowa Department of Human Services. November 2014. Available at: ition FAQ 11052014.pdf. Accessed July 2, 2015.Assurance of Transportation, 42 CFR 431.53. Accessed January 15, 2016 from http://www.ecfr.gov/cgi-bin/retrieveECFR?gp &SID 0c7ee7a5cbe463eda67e0e61810a8627&mc true&n pt42.4.431&r PART&ty HTML#se42.4.431 153Iowa Medicaid Non-Emergency Medical Transportation Program. TMS Management Group, Inc. edicaid-net-program Accessed January 15, 2016.Iowa Department of Human Services. Non-Emergency Medical Transportation. EMT Accessed January 15, 2016.
MethodologyTo understand and evaluate issues related to non-emergency medical transportation (NEMT) forIHAWP members, we used both survey (personal experience) and administrative (billing claimsexperience) data. Our samples included members whose health plan included an NEMT benefit(MSP-Family Medical Assistance Program (FMAP)) and those in health plans that were not obligated(through a governmental waiver) to provide an NEMT benefit (IHAWP-WP & IHAWP-MPC). Weasked all members in the surveys about their experiences with health care and transportation in thesix months prior to the survey and merged their responses to their administrative claims duringthe same period to assess the relationship between need for NEMT and health care utilization. Thefollowing description provides detail about the survey data collection, the administrative claims, andthe analytic methods used for this report.Member SurveysThis report includes data from surveys of IHAWP-WP, IHAWP-MPC, and adult MSP-FMAP members.These surveys were fielded from October 28, 2015 through January 15, 2016.General methods used to develop, field, and compile the data from these surveys follow.Survey InstrumentsThe survey included questions about the following topic areas: Access to Transportation and Need/Unmet Need for Non-Emergency Medical Transportation Need and Unmet Need for Routine Health Care Services (derived from NHIS5) Barriers to Obtaining Health Care Services Usual Place of Care and Identification of a Personal Doctor Emergency Room Care Functional Limitations (derived from the Behavioral Risk Factor Surveillance System (BRFSS)6) Chronic Physical and Mental Health Conditions DemographicsThe survey instrument is available in Appendix A. At the end of the survey, respondents had a chanceto provide open-ended comments about their experiences. Appendix B includes a summary of thecomments left by respondents.Survey Field MethodsThe 2015 Survey of IHAWP and MSP-FMAP members was conducted during the fall and winter of2015/2016 using a mixed-mode mail methodology. Surveys were mailed to a stratified random sampleof members who had been in their current plan for at least the previous six months. The sample wasstratified into three groups: IHAWP-WP, IHAWP-MPC, and MSP-FMAP.Random samples for each group were drawn from IHAWP and Medicaid enrollment data, currentas of September 2015. Only one person was selected per household to reduce the relatedness of theresponses and respondent burden. The sample was comprised of 10,180 IHAWP-WP, 10,180 IHAWPMPC members, and 10,180 adult MSP-FMAP members for a total sample of 30,540.Both mail and web-based surveys were used. The initial mailings were sent to members in lateOctober 2015. A reminder postcard was sent 14 days after the initial mailing. About 14 days after thepostcard reminder, a second mailing was sent to those who had not responded to the initial mailing.In the mailed cover letter and on the reminder postcard, enrollees were given the option of completingthe survey online and provided the website address for that purpose. In an effort to maximizeresponse rates for the mailed survey, both a premium and an incentive were used in the first mailing:each initial survey packet included a 2 bill and respondents who completed and returned the surveywithin two weeks of the mailing were entered into a random drawing for one of ten 25 Wal-Mart giftcards.56Centers for Disease Control and Prevention (CDC). National Health Interview Survey. Available at http://www.cdc.gov/nchs/nhis/quest doc.htmCDC. BRFSS. Available at http://www.cdc.gov/brfss/questionnaires.htmPage 5Return to TOC
Response RatesResponse rates for each of the population groups is provided in Table 1. Response rates were adjustedby removing ineligible individuals from the denominator. Individuals were determined to beineligible to complete a survey because of invalid or out-of-state addresses or they were deceased. Theoverall adjusted response rate was 30% with the lowest response rate from MSP-FMAP (23%).Table 1. Response Rates for IHAWP-WP, IHAWP- MPC, MSP-FMAPPlanTotal Sampled Adjusted* TotalRespondedAdjusted* 0,54027,2548,25530%* Adjusted for ineligibles – Those who no longer had a valid address or were outside the state of IowaCharacteristics of Respondents & Non-RespondentsTable 2 shows the demographic characteristics of the respondents for each of the survey populations.Overall, respondents were more likely to be older, white, and female as compared to non-respondents,regardless of plan type. Within the MSP-FMAP group, respondents were less likely to come frommetropolitan areas when compared to non-respondents, but were comparable to non-respondentswith regard to length of enrollment and being from non-metro or rural areas. Within the IHAWP-WPand IHAWP-MPC groups, respondents were more likely to be enrolled longer than non-respondentsand more likely to be from metropolitan areas but less likely to be from non-metro or rural areaswhen compared to non-respondents. Because of the large sample sizes, many of the comparisonsbetween groups reached statistical significance even when the percentage or mean differences werenot particularly striking. Thus, these results should be interpreted with some caution and effect sizedifferences should be considered.Page 6Return to TOC
Table 2. Respondents vs. Non-Respondents by Plan TypeMSP-FMAPIHAWP-WPIHAWP-MPCRespondentN 2,055Non-RespondentN 8,125RespondentN 2,980Non-RespondentN 7,200RespondentN 3,220Non-RespondentN 6,96017.016.816.3†14.413.1†11.9Mean % Poverty 11.9%Level11.0%35.9%†32.9%117.8%118.5%Mean Mean NumberMonths of �� Statistically significant difference between respondents and non-respondents at the p .01 level.Months of enrollment ranges from 6 (all sampled had to have at least 6 months of enrollment) to 22 months. A member with22 months of enrollment means that person was in the plan since January 1, 2014 (the start of IHAWP).12Race/Ethnicity categories are not mutually exclusive; thus, the percentages may not sum to 100%.3Other includes Asian, Pacific Islander, American Indian, or other.4Race indicated as Unknown in the eligibility files.Urban/Rural Residence is defined by the Rural-Urban Continuum Codes (RUCC).7 RUCCs define metropolitan counties bythe population size of their metro area and nonmetropolitan (nonmetro) counties by degree of urbanization and adjacency tometro areas. In the table, metropolitan is an urban county with population up to 1 million. Non-metro is a nonmetropolitancounty with population from 2,500 to 20,000 or more and rural is defined as completely rural with population less than 2,500.5Administrative DataMedicaid eligibility files were used to obtain basic demographic information (months of enrollment,age, sex, race, and percent poverty) for all of the sample members. Health care utilization for thesurvey respondents was obtained from their Medicaid administrative claims. Medicaid institutionalclaims were reviewed for the six-month period prior to the administration of the survey to obtain thenumber of well care, acute care, and emergency department visits during that period.A well care visit was coded if the claim included: Any preventive exam visit with a CPT code of 99385-99387, 99395-99397, 99401-99404, 99411,99412, 99420, 99429 ORAny visit with a CPT code of 99201-99205 AND a preventive visit diagnosis code of V70.0,V70.3, V70.5, V70.6, V70.8, or V70.9.An acute care visit was coded if the claim included: 7Any MD or ARNP visit that was NON-behavioral/emotional, NON-maternal, and a NONwell visit, ANDFor more information on the Rural-Urban Continuum coding, refer to ontinuum-codes.aspxPage 7Return to TOC
The visit occurred in an office setting, outpatient clinic, rural health clinic, or FQHC accordingto the place of service AND The claim included CPT codes between 99210 and 99215.An outpatient emergency department visit was coded if the claim included: A revenue code on an institutional claim of 450-459 AND The visit did not result in a hospitalization.Analytic MethodsStudy populations and univariate comparisonsWithin this evaluation of NEMT, there are three distinct groups. Two of these are the study groups:Wellness Plan (IHAWP-WP) and Marketplace Choice (IHAWP-MPC). The third (comparison)group included adult members in the Medicaid Family Medical Assistance Program (MSP-FMAP).Descriptions of these plans follow.Wellness Plan (IHAWP-WP) provides coverage for adults ages 19-64 with income up to andincluding 100 percent of the FPL. It is administered by the Iowa Medicaid Enterprise. Membershave access to the Medicaid provider network established for this program.Marketplace Choice Plan (IHAWP-MPC) provides coverage for adults 19-64 with income from101-133 percent of the FPL. The Marketplace Choice Plan allows members to choose certaincommercial health plans available on the health insurance marketplace, with Medicaid payingthe member’s commercial health plan premiums. During the study timeframe, IHAWP-MPCmembers could receive services through a qualified health plan (Coventry Health Care of Iowasee below) or the traditional Medicaid program.Coventry Health Care of IowaCoventry is a national managed care company that is based in Bethesda, MD. Theyoperate statewide and are available on the Health Insurance Marketplace through thefederal portal.FMAP – Family Medical Assistance ProgramThe FMAP comparison group is composed of adult parents of children eligible for Medicaid. Nonemployed and employed parents of children in Medicaid in families with incomes from 0-77%FPL are eligible for Medicaid coverage. As they earn more they are able to increase the percentFPL allowed for eligibility to encourage employment. They may be covered through a HealthMaintenance Organization (HMO), Primary Care Case Management (PCCM), or Fee for Service(FFS) structure.The initial analyses were means test comparisons of: 1) IHAWP-WP to MSP-FMAP members and2) IHAWP-MPC to MSP-FMAP members. Statistical significance in the text and figures for thesecomparisons was at p .01. For all survey analyses presented, the data were weighted to make itrepresentative of all IHAWP and Medicaid members statewide and to account for the fact that therewere not equal numbers of enrolled members in each sampled group. Thus, the percentages reportedwere weighted to reflect the statewide membership in each group. For the inferential statistics, theweight variable was re-based to the actual sample size in order to ensure that, while the adjustmentsfor sampling method were retained, the standard errors used in the statistical testing were notartificially inflated.Multivariable ModelsData from the Fall 2015 survey and Medicaid administrative claims were used to model factors relatedto unmet NEMT need and health services utilization. Four separate multivariable logistic regressionmodels were fit; one for each of the following research questions. The outcome (dependent) variableand the focal independent variables for each model are described below each question.Question 1. Is the presence or absence of the NEMT benefit associated with unmet need for transportation tohealth care visits?The model provides the odds that respondents experienced an unmet NEMT need in the six monthsprior to the survey.Page 8Return to TOC
Unmet NEMT need (Outcome)Survey respondents provided a yes or no answer to the following question: In the last 6 months,was there any time when you needed transportation to or from a health care visit but could notget it for any reason?Plan Status (Focal Independent Variable)We used two variables for plan status: 1) an indicator of whether a member was in the IHAWPWP program (as compared to MSP-FMAP) and 2) an indicator of whether a member was in theIHAWP-MPC program (as compared to MSP-FMAP). This approach allows us to use MSP-FMAP(the group with an NEMT benefit) as the comparison group.Question 2 Is unmet NEMT need associated with obtaining a well care visit?The model provides the odds that respondents had a claim for a well care visit in the six months priorto the survey.Well Care Visit (Outcome)Claims data were used to determine if a respondent had a well care visit (yes or no) in the sixmonths prior to the survey. The definition of a well care visit can be found in the AdministrativeData section above.Unmet NEMT need (Focal Independent Variable)The definition and categorization of the Unmet NEMT need variable are given under Question 1.Plan Status (Focal Independent Variable)The definition and categorization of the Plan Status variables are given under Question 1.Unmet NEMT need * Plan Status (Interaction terms)Two interaction variables were included in the initial models to jointly model the effect ofreported unmet need for transportation to health care visits (Unmet NEMT need) with theabsence of NEMT benefit (Plan Status IHAWP-WP, Plan Status IHAWP-MPC).If the interaction terms were not statistically significant at the p .05 level, the interaction termswere removed and the model was fit without them.Question 3 Is unmet NEMT need associated with obtaining an acute care visit?Acute Care Visit (Outcome)Claims data were used to determine if a respondent had an acute care visit (yes or no) inthe six months prior to the survey. The definition of an acute care visit can be found in theAdministrative Data section above.Unmet NEMT need (Focal Independent Variable)The definition and categorization of the Unmet NEMT need variable are given under Question 1.Plan Status (Focal Independent Variable)The definition and categorization of the Plan Status variables are given under Question 1.Unmet NEMT need * Plan Status (Interaction terms)The definition of the interaction terms is given under Question 2.Question 4 Is unmet NEMT need associated with using the emergency department (ED)?Emergency Department Visit (Outcome)Claims data were used to determine if a respondent had a visit to an emergency department (yesor no) in the six months prior to the survey and that visit did not result in a hospitalization. Thedefinition of an emergency department visit can be found in the Administrative Data sectionPage 9Return to TOC
above.Unmet NEMT need (Focal Independent Variable)The definition and categorization of the Unmet NEMT need variable are given under Question 1.Plan Status (Focal Independent Variable)The definition and categorization of the Plan Status variables are given under Question 1.Unmet NEMT need * Plan Status (Interaction terms)The definition of the interaction terms is given under Question 2.All models included the following additional explanatory covariates. These variables theoreticallycould have an effect on each outcome independent of the focal variables and are included to accountfor those potential effects. Variable data source, definitions, and reference group (for the categoricalvariables) are provided for each covariate.Sociodemographic VariablesAge-Survey self-report. Definition: Dichotomous18-43 years (Reference Group), 44-64 years.Female gender-Survey self-report. Male is the reference group.Race/Ethnicity-Survey self-report. Each are dichotomous indicators. Race: White (Referencegroup non-white), Black or African American (Reference group non-Black), Hispanic(Reference group non-Hispanic). Reference groups include those who self-reported as Asian,Native Hawaiian or Other Pacific Islander, American Indian or Alaska Native, and other, nonspecified.Education- Survey self-report. Dichotomous: High School or Less (Reference group), More thanHigh School.Income-We used percent poverty level as an indicator of household income. The median split(according to plan type) was used in the models: MSP-FMAP: 0% (Reference group), 0%; IHAWPWP: 0 – 21% (Reference group), 21%; IHAWP-MPC: 0 – 119% (Reference group), 119%.Months of enrollment-Number of months enrolled in the IHAWP-WP, IHAWP-MPC, or MSPFMAP in the period from January 1, 2014 through October 31, 2015. The number of months ofenrollment could range from 6 to 22 months. We used the median split of months in program:Shortest length in program (Reference group): 6-14 months, Longest length in program: 15-22months.Health Status VariablesNumber of chronic conditions-Survey self-report. 1) Physical Health Conditions dichotomous:0-1 (Reference Group), 2 or more. 2) Any Mental Health Condition dichotomous: None (Referencegroup), Any.Health Status-3 measures from survey self-report were included: 1) Physical Health: Fair/Poor vs.Good/Very Good/Excellent (Reference group); 2) Mental Health: Fair/Poor vs. Good/Very Good/Excellent (Reference group); 3) Functional Limitations (yes/no): Reported any of four possiblefunctional limitations which included physical or medical conditions that a) seriously interferedwith a member’s ability to work, attend school, or manage day-to-day activities, b) seriouslyinterfered with a member’s independence, participation in the community, or quality of life, c)required the member to have help with routine needs, such as everyday household chores, doingnecessary business, shopping, or getting around for other purposes, or d) required the member tohave help with personal care needs, such as eating, dressing, or getting around the house.Geographic VariablesRural/urban-Rural-urban continuum codes (RUCC) provided through the US Departmentof Agriculture were used to categorize the respondent place of residence. RUCCs definePage 10Return to TOC
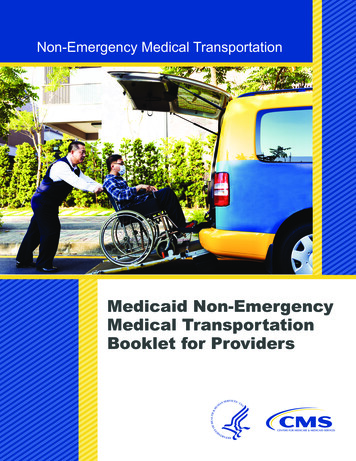
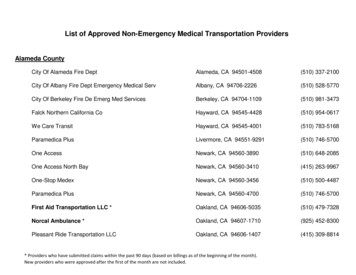
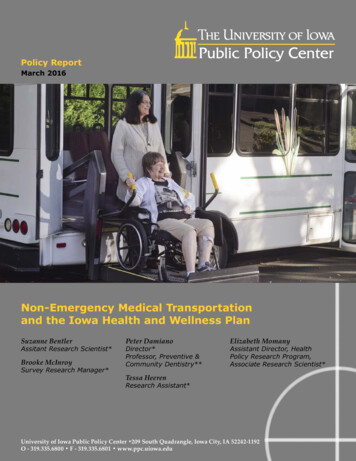
metropolitan counties by the population size of their metro area and nonmetropolitan (nonmetro)counties by degree of urbanization and adjacency to metro areas. We used three categories:Metropolitan/Urban (Reference group), Non-metro, Urban (suburban), and Non-metro,Completely Rural. Metropolitan is an urban county with population up to 1 million. Non-metro,urban is a nonmetropolitan county with population from 2,500 to 20,000 or more and rural isdefined as nonmetropolitan, completely rural with population less than 2,500.Distance to nearest primary care provider-Each respondent address and the addresses ofprimary care providers in the plan network were geocoded. The distance from the member’shome to the nearest active primary care provider (at least 1 claim in the past 6 months) wascalculated. Distance to PCP was grouped into tertiles: Low: 0 – 0.7 miles (Reference Group),Middle: 0.71 – 2.0 miles, High: 2.0 miles.Distance to nearest hospital ED-Each respondent address and the addresses of all EDs in Iowawere geocoded. The distance from the member’s home to the nearest ED was calculated. Distanceto ED was grouped into tertiles: Low: 0 – 1.9 miles, Middle: 2.0 – 6.5 miles, High: 6.5 miles.ResultsDemographic CharacteristicsFigure 1 provides the age, gender, and racial characteristics of the members by plan type. MSP-FMAPmembers were younger and the vast majority (85%) were female which is significantly different thanthe IHAWP groups (WP & MPC) where less than 50% were under the age of 44 and less than 45%were female. Statistically, there were significantly more black respondents in the MSP-FMAP groupthan the IHAWP-MPC group and fewer Hispanics in the IHAWP-WP group compared to the MSPFMAP group. The vast majority of members in all three groups were white (87%-90%).Figure 1. Age, Gender, and Race of Respondents by Plan100%87% 88%85%90%80%90%68%70%57%60%59%52%50%40%30%20%19%9% 7%6%10%0%Age 44-64 †‡Female †‡5% 3% 5%Black ‡MSPHispanic †WP3% 4% 3%WhiteOtherMPC† Statistically significant difference between MSP-FMAP and IHAWP-WP at the p .01 level.‡ Statistically significant difference between MSP-FMAP and IHAWP-MPC at the p .01 level.Figure 2 shows the educational level and the urban/rural
Non-Emergency Medical Transportation and the Iowa Health and Wellness Plan University of Iowa Public Policy Center 209 South Quadrangle, Iowa City, IA 52242-1192 O - 319.335.6800 F - 319.335.6801 www.ppc.uiowa.edu Suzanne Bentler Assitant Research Scientist* Brooke McInroy Survey Research Manager* Peter Damiano Director*