Transcription
Alarcon-Ruiz et al. BMC Health Services 2019) 19:439RESEARCH ARTICLEOpen AccessAssociation of waiting and consultationtime with patient satisfaction: secondarydata analysis of a national survey inPeruvian ambulatory care facilitiesChristoper A. Alarcon-Ruiz1* , Paula Heredia2 and Alvaro Taype-Rondan1AbstractBackground: Research suggested that waiting time and consultation time are associated with overall patientsatisfaction concerning health services. However, there is a lack of information regarding this subject in LatinAmerican countries, where particular aspects of health systems and population characteristics could modify thisassociation. Our aim was to evaluate the association of waiting time and consultation time with patient satisfaction,in Peruvian ambulatory care facilities and propose a cut-off points of waiting and consultation time based onpatient satisfaction.Methods: Cross-sectional secondary data analysis of the National Survey on User Satisfaction of Health Services(ENSUSALUD-2015), a national-wide survey with a probabilistic sample of 181 Peruvian ambulatory care facilities.Patient satisfaction, waiting time, consultation time, and sociodemographic variables were collected from theENSUSALUD-2015. All variables were collected by survey directly to patients, from the selected ambulatory carefacilities, after their consultation. Complex survey sampling was considered for data analysis. In the associationanalysis, we grouped the waiting time and consultation time variables, every 10 min, because for it is more relevantand helpful in the statistical and practical interpretation of the results, instead of the every-minute unit.Results: The survey was performed in 13,360 participants. Response rate were 99.8 to 100% in the main variables.Waiting time (for every 10 min) was inversely associated with patient satisfaction (aOR: 0.98, 95% CI: 0.97–0.99),although the aOR was lower among those who reported a waiting time 90 min (aOR: 0.92, 95% CI: 0.89–0.96).Consultation time (for every 10 min) was directly associated with patient satisfaction (aOR: 1.59, 95% CI: 1.26–2.01),although the aOR was higher among those who reported a consultation time 15 min (aOR: 2.31, 95% CI: 1.66–3.21).Conclusion: In Peruvian ambulatory care facilities, both waiting time and consultation time showed an associationwith overall patient satisfaction, which was stronger in the first 90 min of waiting time and in the first 15 min ofconsultation time. This should be taken into consideration when designing interventions to improve waiting times andconsultation times in ambulatory care facilities from Peru or from similar contexts.Keywords: Patient satisfaction, Ambulatory care, Survey research, Consultation, Hispanic health* Correspondence: christoper.alarconr20@gmail.com1Unidad de Investigación para la Generación y Síntesis de Evidencias enSalud, Universidad San Ignacio de Loyola, Lima, PeruFull list of author information is available at the end of the article The Author(s). 2019 Open Access This article is distributed under the terms of the Creative Commons Attribution 4.0International License (http://creativecommons.org/licenses/by/4.0/), which permits unrestricted use, distribution, andreproduction in any medium, provided you give appropriate credit to the original author(s) and the source, provide a link tothe Creative Commons license, and indicate if changes were made. The Creative Commons Public Domain Dedication o/1.0/) applies to the data made available in this article, unless otherwise stated.
Alarcon-Ruiz et al. BMC Health Services Research(2019) 19:439BackgroundOverall patient satisfaction with health services (Hereinafter referred to as patient satisfaction) is a critical component in the evaluation of health care services [1, 2].Furthermore, greater patient satisfaction is associatedwith better patient health outcomes such as higher ratesof fulfilling physician’s instructions [3] and lower mortality rate [4, 5]. However, there is a need for assessinghigh-quality interventions to improve patient satisfaction[6], and describe the patient’s perceptions of their experiences and their satisfaction [7].Waiting and consultation times in ambulatory care facilities (ACFs) are associated with patient satisfaction[8–10], so that longer waiting times and shorter consultation times could cause impaired access to healthcare[11] and a decrease of patient’s willingness to return tothe ACF, which ultimately has an impact on continuityof care [12]. Both variables are of great interest becausethey are relatively easy to modify by interventions focused on the attendance process [13]. Thus, their modification has the potential to improve patient satisfactionat a low cost. Nevertheless, the “ideal” waiting andconsultation time is not yet well defined. So, it is important to determine a cut-off points of both times wherethe patients’ overall satisfaction significantly can bemodified.Previous studies which have evaluated the associationof waiting time and consultation time with patient satisfaction were performed mostly in high-income countries[10, 14–17]. However, middle and low-income LatinAmerican countries use to have long waiting times,possibly due to their crowded health system [18–20].Additionally, these associations could show differentpatterns, due to particular aspects of the health systemsof those countries [21]. Moreover, patients in LatinAmerican counties could want to invest a short amountof time in their healthcare, in order to prevent workproblems, since employment in these countries commonly have non-flexible work shifts, low-tolerance forabsenteeism, and labor instability [22, 23].Thus, this study aimed to evaluate the associationof waiting time and consultation time with patientsatisfaction, in Peruvian ACFs and propose a cut-offpoints of waiting and consultation time based onpatient satisfaction.MethodsStudy designWe performed a cross-sectional secondary data analysisof a public dataset from the National Survey on UserSatisfaction of Health Services 2015 (ENSUSALUD2015). It was recollected by the National Superintendence of Health (SUSALUD, in Spanish) and the NationalInstitute of Statistics and Informatics (INEI, in Spanish).Page 2 of 9ENSUSALUD-2015 is a national-wide survey carried outin Peruvian ACFs in 2015, which aims to assess theACFs’ users’ perception about the care provided.ContextACFs are health facilities which administer health services to individuals who do not require hospitalizationinto a health care facility. In Peru, ACFs belong to anyof four health systems: 1) Ministry of Health and Regional Governments (MOH-RG), which provide healthcare mainly to low-income people. It is supported by thePeruvian Government, and it works in three differentlevels: Local, regional and national; 2) Social Security(EsSalud), financed by the Ministry of Labor, whichprovides health care to formal workers, former workers,and their relatives. It operates using its own centers ofhealth; 3) Armed Forces (Marines, army and aviation)and Police, financed by the Ministry of Defense and theMinistry of Interior, respectively. All of them worksindependently from each other. They provide healthcare to armed forces and police members, and theirrelatives; 4) The private sector, financed by users withprivate insurance or by paying at the same momentof attendance [21].ACFs are divided into three different levels: Level IACFs provide basic health care and takes care of themost frequent low complexity problems. Level II ACFshave the capacity to resolve some surgical problems andthe ones transferred from level I ACFs. Level III ACFsare reserved for the attendance of complex conditionsrequiring specialized medical procedures [24]. In mostcases, with the exception of the private sector, patientsshould be referred from lower levels in order to assist tohigher levels ACFs. The staffing in the ACFs depends onthe level of ACFs, but in all cases, the patient is attendedby a medical doctor.ParticipantsThe ENSUSALUD-2015 surveyed a representativesample of users after their medical consultation atPeruvian ACFs. A probabilistic sampling across all 25Peruvian regions was conducted. This sampling was performed in a two-stage process: First, a random selectionof Peruvian ACFs (from level I, II, and III) in each healthsystem was performed. Then, outpatient users of eachACFs were selected systematically, considering the number of daily attendances in each ACF. The survey wasavailable to users with age 15 years old, who had amedical consultation in the ACF, and accepted to besurveyed [25].ProceduresSurveys were completed between May and July 2015. Atrained pollster surveyed each user immediately following
Alarcon-Ruiz et al. BMC Health Services Research(2019) 19:439their medical consultation. The pollsters introducedthemselves to users and asked them for their consent toconduct the survey. Then, pollsters read each questionand their alternatives to the user. No incentive was offeredto participants to respond to the survey. The database anddetails of the survey are public on the INEI ablesOutcome: patient satisfactionThe outcome for this study was patient satisfaction. Itwas evaluated using the question: “Regarding the healthcare service received today in this health facility, howwould you rate your satisfaction level?” (“Respecto alservicio recibido el día de hoy en este establecimiento,¿Cómo calificaría usted su nivel de satisfacción?”, inSpanish). It had the following response options: Verysatisfied, satisfied, neither satisfied nor dissatisfied, dissatisfied, and very dissatisfied. All questions in the survey were asked in the patient’ maternal language.For the purpose of the analysis and because of skeweddata distributions, this item was dichotomized into twocategories: “Satisfied” (if the participant answered “verysatisfied” or “satisfied”) or “Not satisfied” (if theparticipant answered “neither satisfied nor dissatisfied”,“dissatisfied”, or “very unsatisfied”). Previous studieshave used this methodology [5, 26].Exposures: waiting time and consultation timeThe exposures of this study were waiting time andconsultation time. Both were analyzed as continuousvariables. To evaluate waiting time, we considered thefollowing questions: “At what time did you arrive at thehealth facility?” And “At what time did you enter thephysician’s office?” Both variables were recorded inminutes. The difference between these two times (timeof entry to the physician’s office minus the time ofarrival to the health facility) was defined as waiting time.Consultation time was measured with the question:“How long was the time, from the moment you have admitted the physician’s office to the time you left the physician’s office?” This variable was recorded in minutes.Other variablesSociodemographic variables included in the analysiswere: age (in years), sex (male or female), having finishedsecondary education (yes or no), wealth (measured withthe question: “How much is, approximately, the monthlyfamily income?” Later, this numeric variable was categorized in its 1st/2nd quintile [with the lower income,between 80 and 1500 PEN] and 3rd/4th/5th quintile[with the higher income, between 1501 and 50,000PEN]) (1 PEN 0.30 USD, approximately), having achronic illness (evaluated with the yes/no question: “DoPage 3 of 9you suffer any illness for which -according to the physician- you require medical evaluations at least every threemonths?”), and having health insurance (yes or no).Consultation variables included in the analysis were:Having a scheduled appointment (evaluated with theyes/no question: “Did you have a scheduled appointmentfor the health service you received today?”), being accompanied (evaluated with the question “Have you comeaccompanied or alone?”), and reporting that the physician explained his/her health problem (evaluated withthe yes/no question “Did the physician clearly explainyour illness or health problem?”).Facility variables included in the analysis were: ACFlevel (I, II, o III), health system (MOH-RG, SocialSecurity, Armed Forces and Police, or private), andgeographical region (coast, highlands, jungle, or the cityof Lima).EthicsThis study is a secondary analysis of a public database.Data analysisData analysis was performed using STATA version 14.0(STATA Corporation, College Station, Texas, USA). Wefollowed the ENSUSALUD-2015 sampling specifications,including stratification, expansion factor, and primaryand secondary sampling units.For descriptive analysis, absolute and relative frequencies were used for categorical variables, while mean with95% confidence intervals (95% CI) were calculated forcontinuous variables. Mean waiting, consultation time,and patient satisfaction were calculated by each healthcare level, health system, and geographical region.Additionally, we used chi-2 test for bivariable analysisbetween patient satisfaction and health care level, healthsystem, and geographical region.Before undertaking the association analysis, wegrouped the waiting time and consultation time variables, into 10 min intervals. Because we considered thatthe 10-min unit would be more helpful for the statisticaland practical interpretation of the results, instead of theevery-minute unit. In addition, since we considered anaverage waiting time of 90 min, 10 min intervals wereconsidered appropriate. A similar approach, usingminutes interval, were published elsewhere [12]. Then,to evaluate the relationship between independentvariables (waiting time and consultation time, both evaluated by 10-min intervals) with patient satisfaction,crude and adjusted logistic regressions models for complex survey sampling were fit to estimate odds ratios(OR and aOR) and their 95% confidence intervals (CI).Logistic regression models were adjusted by age, sex,having finished secondary education, wealth, having achronic disease, having health insurance, having a
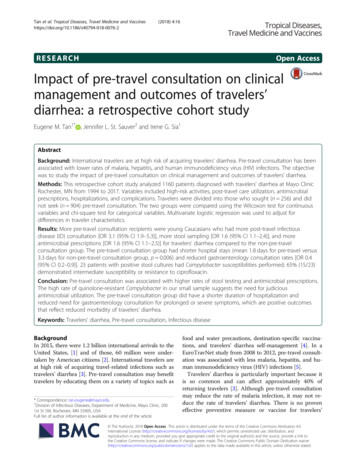
Alarcon-Ruiz et al. BMC Health Services Research(2019) 19:439scheduled appointment, being accompanied, reportingthat the physician explained his/her health problem,health care level, geographical region, health system,waiting time, and consultation time. To avoid the influence of outliers, we excluded observations with consultation time 30 min in the consultation time/patientsatisfaction associations (19 participants excluded, 0.14%of total population). Their responded consultation timeranged between 34 and 90 min. This was because weconsidered that a consultation time with more than 30min is a very rare scenario, and including these observations in the regression analysis would bias the results.We didn’t exclude very short consultations times because we considered those were plausible in our context.Additionally, very short consultations are not likely toaffect the regressions coefficients since they are close tothe mean consultation time, unlike very long consultation times.In addition, the associations were plotted using restricted cubic splines with five knots obtained by default,as previously suggested [27], in order to evaluate linearity and identify possibly cut-off points to difference subpopulations in which the association would be different.Finally, we assessed the association between time andconsultation time, using Pearson correlation test and,additionally we calculating the mean and 95% CI consultation time by each tercile of the waiting time.ResultsPopulation descriptionThe ENSUSALUD-2015 included 13,670 participantsfrom 181 ACFs. Response rate was 100% in satisfactionand waiting time, and 13,642 (99, 8%) participantsresponded consultation time. When including weightsand design effect of the survey’s complex sampling, wefound that 5335 (40.4%) were males, mean age was 42.8years (95% CI: 41.3–44.3 years, range: 15–95 years), 9327(72.0%) finished secondary education, 5473 (28.7%) werein the 1st or 2nd wealth quintile, and 9198 (73.7%) weresatisfied with the care received (Table 1).Average waiting time was 104.2 min (95% CI: 91.0–117.4 min), and average consultation time was 12.1 min(95% CI: 11.4–12.7 min). Average waiting time washigher among users of MOH-RG ACFs (mean: 147.5,95% CI: 129.3–165.8), and lower among users of armedforces and police ACFs (mean: 55.7, 95% CI: 37.5–73.9),and private ACFs (mean: 41.5, 95% CI: 34.7–48.3). Withrespect to the geographical region, users of ACFs of thecity of Lima had a noticeably lower waiting time (mean:94.6, 95% CI: 70.9–118.2) and higher average consultation time (mean: 13.0, 95% CI: 12.0–14.1) than otherACFs. Patient satisfaction was statistically greater inarmed forces and police ACFs (90.9%), private ACFs(93.2%), and in users of ACFs of the city of Lima (81.6%)Page 4 of 9Table 1 General characteristics from Peruvian ambulatory carefacilities’ usersCharacteristicsAbsolute frequency(percentages *)Patients’ characteristicsAge in years: mean (95% CI)42.8 (41.3–44.3)Females8335 (59.6)Finished secondary education9327 (72.0)1st or 2nd wealth quintile5473 (28.7)Have a chronic disease5206 (51.2)Have insurance12,679 (92.2)Consultation’ characteristicsScheduled appointment for consultation8788 (66.3)Came accompanied for consultation4466 (34.8)The physician explained his/her health problem10,296 (77.7)Facility’ characteristicsHealth care levelLevel I2643 (29.1)Level II8626 (36.1)Level III2401 (34.8)Health systemMOH-RG6410 (44.9)Social Security6081 (34.6)Armed Forces and Police524 (8.8)Private Sector655 (11.7)RegionCoast4206 (23.7)Highlands5486 (18.5)Jungle2706 (6.6)Lima city1272 (51.3)Patient satisfied9198 (73.7)*Weights and design effect of the survey’s complex sampling were included tocalculate percentagesCI Confidence Interval, MOH-RG Ministry of Health and Regional Governments(chi-2 p-value to evaluate the association betweenpatient satisfaction with health services and regionp 0,001) (Table 2).Association of waiting time and consultation time withpatient satisfactionWaiting time (for every 10 min) had a small inverseassociated with patient satisfaction (aOR: 0.98, 95% CI:0.97–0.99). However, the plot showed that this association was stronger among those who reported waitingtime 90 min, but was almost absent for those whoreported waiting time 90 min. This was corroboratedwith the logistic regressions performed in both subpopulations: those who reported waiting time 90 minand 90 min (Table 3 and Fig. 1).
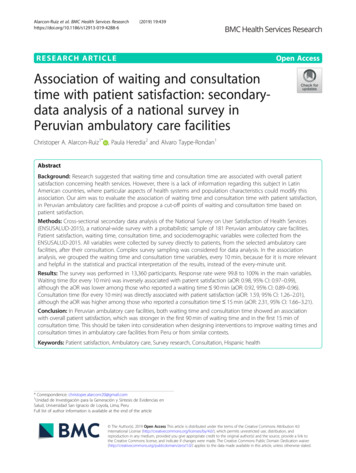
Alarcon-Ruiz et al. BMC Health Services Research(2019) 19:439Page 5 of 9Table 2 Waiting time and consultation time by variables categoriesSubgroupsMean (95% CI) *Absolute Frequency (percentages *)Waiting timeConsultation timePatient satisfaction104.2 (91.0–117.4)12.1 (11.4–12.7)9198 (73.7)MOH-RG147.5 (129.3–165.8)12.3 (11.4–13.2)4180 (72.0)Overall populationHealth system**Social Security81.5 (65.7–97.3)11.3 (10.2–12.4)3989 (64.9)Armed Forces and Police55.7 (37.5–73.9)10.7 (8.6–12.8)425 (90.9)Private41.5 (34.7–48.3)14.4 (12.1–16.8)604 (93.2)Health care levelLevel I110.9 (83.2–138.6)10.6 (9.3–12.0)1824 (73.0)Level II97.6 (79.9–115.2)11.9 (10.8–13.0)5770 (72.3)Level III105.5 (78.6–132.4)13.4 (12.6–14.2)1604 (75.8)Region**Coast116.4 (98.3–134.5)11.2 (9.9–12.4)2618 (64.1)Highlands109.2 (85.3–133.0)11.1 (10.5–11.8)2006 (74.4)Jungle121.6 (103.3–139.9)10.6 (10.1–11.0)3536 (63.9)Lima city94.6 (70.9–118.2)13.0 (12.0–14.1)1038 (81.6)*Weights and design effect of the survey’s complex sampling were included to calculate percentages. **p 0,001 for chi-2 test for evaluation between patientsatisfaction and variables. CI Confidence Interval, MOH-RG Ministry of Health and Regional GovernmentsIn the consultation time and patient satisfaction associations, 19 observations with consultation time 30 minwere excluded of the analysis, in order to avoid the influence of outliers. Consultation time (for every 10 min)was directly associated with patient satisfaction (aOR:1.59, 95% CI: 1.26–2.01). However, the plot showed thatthis association was stronger among those who reportedconsultation time 15 min, but was almost absent forthose who reported consultation time 15 min. This wascorroborated with the logistic regressions performed inboth subpopulations: those who reported consultationtime 15 min and 15 min (Table 3 and Fig. 2).Finally, the mean and 95% CI consultation time in thefirst, second, and third tercile of the waiting time were:12.4 (95% CI: 11.4 to 13.4), 12.2 (95% CI: 11.5 to 12.8),and 11.6 (95% CI: 10.7 to 12.5) minutes, respectively.The correlation between time and consultation time wasnot statistically significant (p 0.0819).DiscussionMain resultsIn Peruvian ACFs, average waiting time was 104.2 minand average consultation time was 12.1 min. Waitingtime was slightly inversely associated with patient satisfaction, and this association was statistically significantonly among those who reported waiting time 90 min.Likewise, Consultation time was directly associated withpatient satisfaction, and this association was morenotable among individuals who reported consultationtime 15 min.Table 3 Multivariate analysis of waiting time and consultation time with patient satisfactionCrudeAdjustedOR (95% CI)aOR (95% CI)*Overall population0.97 (0.96–0.98)0.98 (0.97–0.99)Subgroup: Waiting time 90 min0.89 (0.84–0.94)0.92 (0.89–0.96)Subgroup: Waiting time 90 min0.99 (0.98–1.00)0.99 (0.97–1.00)Exposure: Waiting time (for every 10 min)Exposure: Consultation time (for every 10 min)Overall population1.92 (1.41–2.61)1.59 (1.26–2.01)Subgroup: Consultation time 15 min2.70 (1.83–3.98)2.31 (1.66–3.21)Subgroup: Consultation time 15 min0.90 (0.42–1.93)0.89 (0.34–2.29)*Adjusted by: age, sex, having finished secondary education, wealth, having a chronic disease, having health insurance, having a scheduled appointment, beingaccompanied, reporting that the physician explained about his/her health problem, health care level, geographical region, health system, waiting time, andconsultation time. Bold results: Statistical significance (p 0.05)
Alarcon-Ruiz et al. BMC Health Services Research(2019) 19:439Fig. 1 Association between waiting time and proportion of patient satisfaction, using restricted cubic splines (red line at 90 min)Fig. 2 Association between consultation time and proportion of patient satisfaction, using restricted cubic splines (red line at 15 min)Page 6 of 9
Alarcon-Ruiz et al. BMC Health Services Research(2019) 19:439Association between waiting time and patient satisfactionAverage waiting time in this study was 104.2 min, whichis longer than average waiting time found in highincome or upper-middle countries such as Germany(13.7 min) [16], USA (21 min) [14], and Mexico (30 min)[28]. But lower to average waiting time reported in middle and low-income countries like Uganda (2–4 h) [29],Malaysia (143.4 min) [26], and Nigeria (131.1 min) [30].The present study reports that waiting time in Peruvian ACFs is inversely associated with patient satisfaction, coinciding with a previous study developed in anendocrinology outpatient department where the waitingtime was negatively associated with patient satisfactionof the care they received [31]. This association showed aplateau among those who reported waiting time 90min. This report and suggested cut-off point are new inthe Latin-American region context. A previous study inthe USA also reported a plateau among those withwaiting time 25 min, but only in patients who hadmore than 10 min of consultation time. However, othersimilar studies undertaken in the USA have reported linear trends without plateaus [10, 14]. This was likely dueto the waiting time range found in those studies beingsmaller than ours: waiting time ranged between 1 and60 min [14], and between 1 and 15 min [10].This plateau might indicate that users who wait morethan 90 min take into account the quality of the ACF orthe consulted physician’s long waiting time and thereforehas planned to invest a long time waiting, or maybe thereis a sub-population who expect to wait for care. However,an alternative explanation is that most individuals go tothe ACF in the morning, as reported in the final report ofENSUSALUD-2015 [32]. So, they expect to return to theirwork or their home in a short period of time, and whenmade to wait 90 min, permission to be late at work havealready been overwhelmed, while domestic activities (suchas cooking or bringing children to school) are no longerrequired; so from this point longer times have smallerconsequences. This hypothesis can be feasible becausepeople give their own value of time depending on the context: If they don’t have anything to lose, their value of timeis lower [33].Therefore, it is possible that interventions which aimto reduce waiting time within the range of the first 90min have an impact in patient satisfaction, in accordancewith previous reports [15, 34–36]. While reducingwaiting time between ranges higher than 90 min mayhave little or no impact on satisfaction. However, we didnot found interventions that have evaluated reductionsin waiting time beyond the range of the first 90 min.In addition, it would be useful to qualitatively assesswhy participants do not appear to have a significantchange on in their satisfaction when waiting timeexceeds 90 min.Page 7 of 9Association between consultation time and patientsatisfactionAverage consultation time was 12.1 min, similar to theaverage consultation time reported in Malaysia (12.8min) [26], and longer than those reported in Bangladesh(2.3 min) [8] and United Kingdom (10.4 min) [17].Despite this, the Peruvian Ministry of Health recommends that consultation time should last between 15 to30 min [37], and The Association of Chiefs and Leadersin General Internal Medicine of USA, recommends thatit should last 30 min to provide high-quality care [38].Consultation time and patient satisfaction weredirectly associated, similar to results found in studiesperformed in Sweden [15] and USA. Conversely, a studyperformed in England [17] and a study performed alsoin the USA [39] found no association between consultation time and patient satisfaction, possibly becausethese last studies were performed in contexts thatdiffered from ours (only in primary care health services,and only in ambulatory care in hand surgery, respectively). Particularly, in the last study where the consultation time range where narrower between 4 and 16 min[39] than the first mentioned study in USA between 6and 72 min.This association showed a plateau among thosewith 15 min of consultation time, which suggeststhat increasing the consultation time over this cut-offpoint may have little effect on patient satisfaction.This may be because patients are not willing toinvest more time than they deem necessary in theconsultation, or maybe these patients report veryhigh levels of satisfaction after that time, which couldnot be measured with the 5-points Likert scale used.This results could explain why average consultationtime appears to be positively associated with some,but not all, elements of patient satisfaction [40].Therefore, longer consultation times could have noeffect on satisfaction which should be expanded byfurther interventional or qualitative studies. Thisresult is new since we have not found other studiesthat had have plotted this association.Limits and strengthsIt is necessary to emphasize some limitations from thepresent study: 1) Patient satisfaction is a complexconstruct [41], so it is possible that the question used tocollect it is insufficient to address its complexity.However, some previous studies have also collected thisvariable using single questions [17, 42]. 2) Waiting andconsultation times have been measured by selfreporting, which may present memory bias comparingwith reliable instruments such as direct observation orvideo or audio recordings [17, 43], and there is thelikelihood that dissatisfied patients estimate their waiting
Alarcon-Ruiz et al. BMC Health Services Research(2019) 19:439time longer than satisfied patients. However, the memory bias should be minimized since these times wereasked immediately following the patient’s consultationwith the physician, and also previous reports used thismethodology [28]. 3) We couldn’t evaluate other variables, such as receptionist’s attitude, suitability of waitingarea, privacy during the consultation, quality of consultation time, which could affect the evaluated relationships. However, this is an inherent limitation in allsecondary analysis studies.Despite those limitations, this is one of the first studiesin a middle low-income country that delves into the linear association of waiting time and consultation timewith patient satisfaction. In addition, the sampling strategy and the size sample of the analyzed database allowsa national-level inferential analysis, so our results couldbe of interest for the management of ACFs in Peru andin other countries with similar contexts. These new results suggest that interventions with the aim to increasepatient satisfaction should be oriented toward a decreasein waiting time 90 min and increase consultation timeto a maximum of 15 min, in a low and middle-low country context. However, these proposed cut-off points musthave been taking into account in a general context ofACFs, and additionally, we have to consider other variables as the context and culture of the service and thepopulation. Finally, we must consider patient satisfactionas a complex outcome, which is also influenced by othervariables [44].ConclusionIn Peruvian ACFs, both waiting time and consultationtime showed a non-linear association with overall patient satisfaction, which was stronger in the first 90 minof waiting time and in the first 15 min of consultationtime, respectively. This should be taken into consideration when designing interventions to improve waitingtimes and consul
Methods: Cross-sectional secondary data analysis of the National Survey on User Satisfaction of Health Services (ENSUSALUD-2015), a national-wide survey with a probabilistic sample of 181 Peruvian ambulatory care facilities. Patient satisfaction, waiting time, consultation time, and sociodemographic variables were collected from the ENSUSALUD-2015.