Transcription
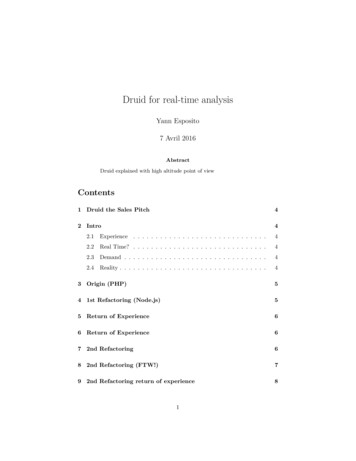
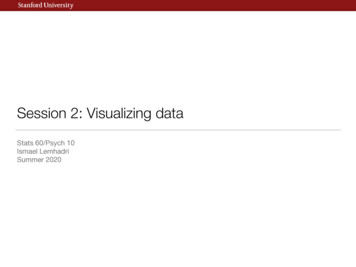
Arena TutorialThis Arena tutorial aims to provide a minimum but sufficient guide for a beginner to getstarted with Arena . For more details, the reader is referred to the Arena user’s guide, whichcan be found in Arena program (Help Product Manuals Arena User’s Guide).1. InstallationYou can download the student version of Arena software from the link below:http://arenasimulation.com/downloadarenaTo proceed with the download, you have to register your account with your valid emailaddress. Once registered, you can log into the download site and follow the downloadinstructions provided at that site. During the installation, customer information will be askedto enter with the serial number. In that case, you have to enter STUDENT in the serialnumber field as shown below.2. Overall Features of Arena 2.1 Arena Window StructureYou can run Arena from the Window Start menu and navigate to Program RockwellSoftware Arena. If a warning message will prompt, click OK to go on. The Arena will bringyou the new modeling environment as follows:1
In the Arena window, you will face with the three regions where you’ll work for building asimulation model.1) Model Window (Flowchart view)The flowchart view is a canvas to draw the process flow of entities using modulesfrom the project bar. It can also have the animation and other drawing elements2) Model Window (Spreadsheet view)The spreadsheet view displays the properties of selected module in the flowchartview or the project bar.3) Project barThe project bar holds some panels that provide the various objects so as to help youbuild the simulation model and reports Basic Process panel: holds modeling commands called modules that areused to model your system. Reports panel: provides a road map to the results of a simulation run Navigate panel: allows to display different view of a modelThe Arena also provides additional panels that provide various types of objects suchas advanced process, advanced transfer panels and so on. In order to use these panels,you need to attach a panel located in Arena’s template folder by selecting a panel file(ends with “tpo” extension) from File Template Panel Attach. In reverse, if youdon’t need it any more, you can detach from the project bar from File TemplatePanel Detach.2.2 ModulesIn Arena, modules are basic building blocks (or objects) that consist of Arena models. Thereare two types of modules: flowchart modules and data modules. All the modules can be foundin the project bar.1) Flowchart Modules:The flowchart modules are used to describe the flow of entities and placed in theflowchart view of the model window.In the Basic Process panel, you can find the following flowchart eAssignRecordDescriptionEntities enter the simulation here.Entities are removed from the simulation here.An activity, usually performed by one or more resources and requiringsome time to complete.A branch in entity flow. Only one branch is taken.Collect a number of entities before they can continue processingDuplicate entities for concurrent or parallel processing, or separating apreviously established batch of entitiesChange the value of some parameter (during the simulation), such asthe entity’s type or model variable.Collect a statistic, such as an entity counter or cycle time.2
2) Data Modules:The data modules are used to define parameters associated with elements of themodel, such as resources, entities, queues and so on. The data module can beaccessed from the project bar by double-clicking a module and it will be shown onthe spreadsheet view of the model window.In the Basic Process panel, you can find the following data eVariableDescriptionDefine the various entity types and their initial picture values in asimulation. Costing information is also defined for the entity.Define the resources in the system including costing informationand resource availability.Define the queues in the systemWith the Resource module, define an operating schedule for aresource or with the Create module, define an arrival schedule.Define various types of sets, including resource, counter, tally, andentity type and entity picture.Define the entity’s attributes which consist of type, dimensions andinitial value.Define the variables used through the modules in the model.3. Building Models with ArenaThroughout this section, the process of building an Arena model of a single server systemwill be explained with the details.3.1 Reference Model (Single Server System)1) Entity: Job arrives every ta minutes (ta Exp(5))2) Active Resource: Machine3) Passive Resource: Buffer (unlimited)4) Activity: service time ts triangular (1, 3, 6)3.2 Defining each Data ModuleBefore modeling the flow of the entity, the entities and resources are defined using Entity andResource data modules.1) Entity module:In Basic Process panel of the project bar, click the Entity module. Double-click thespreadsheet view to define a new entity. Enter the entity type with “Job” and changethe initial picture to “Picture.Box” which will be used to animate the entity flowduring the simulation.3
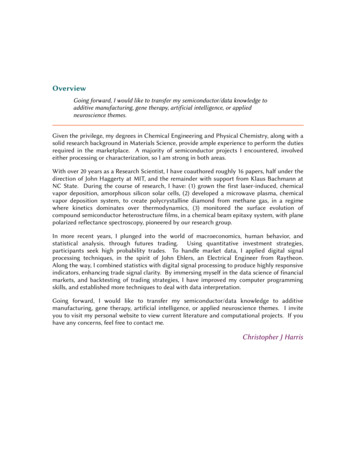
2) Resource module:In Basic Process panel of the project bar, click the Resource module. Double-clickthe spreadsheet view to define a new resource. Enter the name with “Machine”.3.3 Constructing a Flowchart ModelIn Arena, the flowchart represents the flow of entity in the system. In the single server system,the entity, a job, 1) enters the system and waits in the queue. 2) The job will be processed bythe machine when the machine becomes idle. 3) The processed job will leave the system.1) Create jobsThe starting point of the flowchart is always the Create module. Drag the Createmodule from the Basic Process panel into the flowchart view of the model window.2) Process jobsDrag the Process module from the Basic Process panel into the flowchart view,placing it to the right of the “Create 1” module. If the “Create 1” module is selectedbefore dragging, the connection will be automatically established from “Create 1” toProcess module. For this, check Object Auto-Connect menu is activated.If the connection is not made, click the Object Connect menu or the Connecttoolbar button ( ) to draw a connection manually. Start the connection by clickingthe exit point ( ) of the Create module, and then click the entry point ( ) of theProcess module to complete the connection.3) Dispose jobsSelect the “Process 1” module and Drag the Dispose module from the Basic Processpanel into the flowchart view, placing it to the right of the “Process 1” module.4
3.4 Defining each Flowchart Module1) Create ModuleDouble-click the “Create 1” module to open a dialog box so as to edit its properties.(1) Type “Create a job” in the Name field.(2) Select or type “Job” to name the entities in the Entity Type field.(3) Type “5” in the Value field of the Time Between Arrivals section and select“Minutes” in the Units field(4) Click OK to close the dialog box.2) Process ModuleNext is the “Process 1” module. In this module, the behavior or flow of an entity atbuffer and machine will be defined. The newly created job waits at the buffer until theresource (machine) becomes idle. If there is an idle resource, the entity seizes theresource and holds for a time delay (representing resource’s processing of the entity),and then it releases the resource for next processing of the entity.Double-click the “Process 1” module to open a dialog box so as to edit its properties.(1) Type “Process a Job” in the Name field.(2) Select “Seize Delay Release” in the Action field of the Logic section.Action field defines the behavior of an entity in this module.-Seize Delay Release: the arriving entity seizes some number of units of aresource, then is delayed for a time, and then releases the resource-Delay: the arriving entity is simply delayed for some time and no resource isrequired-Seize Delay: seizes the resource and then is delayed, but does not release theresource-Delay Release: assuming that the resource is seized previously, the entity isdelayed and then the resource is released(3) Click “Add.” button in the Resources filed of the Logic section to add a resourcefor this module. The dialog box for Resources will be opened. Select “Machine”in the Resource Name field. Click OK button to close the Resources dialog box.Resources field defines the resources to be seized or released. It can be aResource or Set (a set of resources). The Quantity field indicates the number ofresources to be seized or released.5
(4) To specify the time delay (service time) that follows the triangular distribution of(1, 3, 6), select “Triangular” in the Delay Type field and type 1, 3 and 6 inMinimum, Value (Most Likely), and Maximum fields, respectively. Also select“Minutes” in the Units field.The time delay for the Process module can be Constant, Normal, Triangular,Uniform, and Expression.3) Dispose ModuleThis module represents the ending point of the entity’s flow in the model. Nothingspecial is mentioned here.4. Running Simulation with Arena4.1 Setting the run conditionsPrior to run the model, you need to specify the run conditions including project informationand the length of the simulation run. This is done in Run Setup dialog box from Run Setupmenu.1) Project ParametersIn Run Setup dialog box, select Project Parameters tab to specify the general projectinformation with Project Title, Analyst Name, and Project Description. You can alsospecify for which categories you would like to collect statistics during the simulationin the Statistics Collection field. Here, check the boxes of Queues, Entities, Processes,and Resources of the Statistics Collection field.6
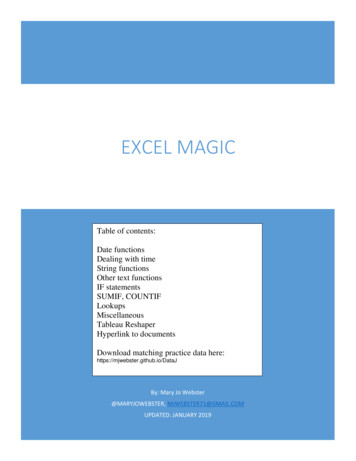
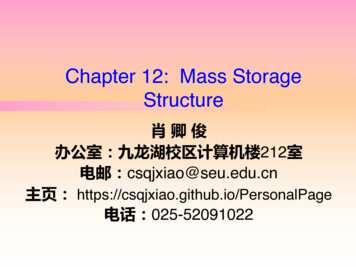
2) Replication ParametersIn Run Setup dialog box, select Replication Parameters tab to specify how manytimes the simulation runs and how long each simulation runs.-Number of Replications: defines numbers of simulation runs to execute. Here,type 1.-Replication Length: defines the length of a single replication in a specifiedtime unit. Here, type 8 and select Hours in its Time Units (directly to the rightof Replication Length)-Base Time Unit: defines time units for reporting, status bar, simulation timeand animated plots. All time delays, replication length will be converted tothis base time unit. Here, select Hours.4.2 Running a simulationYou can start the simulation run simply by clicking the Go ( ) button in the standard toolbaror clicking the Run Go menu. If you have a valid model, then Arena continues to run thesimulation. If your model is not valid, Arena lets you know that with error messages.Once the simulation starts to run, some animation will be displayed as the simulationprogresses. As shown in the following figure, entities in a box shape (as specified in Entitydata module) move from one module to another. Below the each module, number of entitiescreated, in processing, and disposed are displayed. At the top of the Process module,displayed is the status of the queue of the resource (number of waiting entities) with entitypictures. In this figure, there are four entities in Process module, among them, one entity isactually being processed by the resource and three entities are waiting at the queue.7
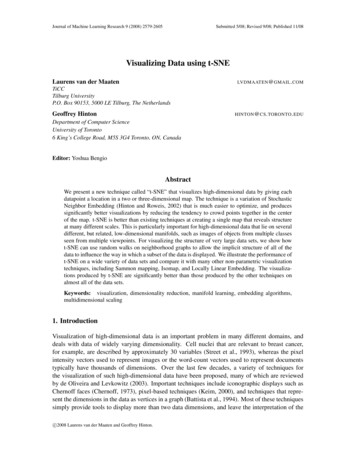
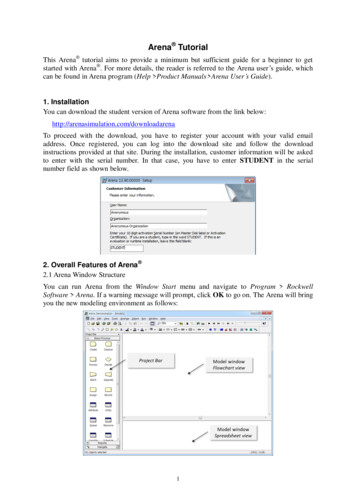
If you don’t want to see the animation anymore during the simulation run, click the FastForward ( ) button to run the simulation as fast as possible without animation update. Alsoyou can start the simulation run via the Run Fast-Forward menu.4.3 Reviewing the output reportsAt the end of the simulation run, a message box will prompt to ask you whether you wouldlike to view the reports. Clicking Yes displays the reports as shown below.In the Reports panel, you can see the list of reports provided by Arena. By clicking one ofthem, you can see the corresponding report. The above figure shows the Category byReplication report which provides the output results for each replication. As we specified inRun Setup Project Parameter, statistics are collected in four categories (Entity, Process,Queue, and Resource) in addition to the system category (default statistics collected byArena).The statistics provided in Arena’s reports can be classified into three types of statistics: Tally statistics: it refers to the statistics such as average, minimum, or maximum of aseries of numbers. For example, the average and maximum of the total time in thesystem of entities are 0.1145 hour and 0.3123 hour, respectively. Time-persistent statistics: it refers the statistics such as time average, minimum, ormaximum of a plot of something during the simulation run. The time average is theaccumulated area under the plotted curve divided by the simulation length. Forexample, one of time-persistent statistics is the average of the number of entities inthe queue at the machine that can be found in the Queue Other Number Waitingof the report tree located to the left of the report. Also, the instantaneous utilization ofthe resource (Resource Usage Instantaneous Utilization) is one of the timepersistent statistics. Counter statistics: it refers to the statistics of accumulated sum of something. One ofthe counter statistics is the number of entities that entered or left the system whichcan be found in Entity Other Number In or Number Out of the report tree.According to the figure above, ninety jobs entered the system and eighty-nine of themleft the system.8
To proceed with the download, you have to register your account with your valid email address. Once registered, you can log into the download site and follow the download instructions provided at that site. During the installation, customer information will be asked to enter with the serial number. In that case, you have to enter STUDENT in the serial number field as shown below. 2. Overall .