Transcription
Rochester Early Childhood Assessment Partnership2016-2017 Twentieth Annual ReportCHARLES J. INFURNA, ED.DA. DIRK HIGHTOWER, PH.D.KATHLEEN EMBTGENEMARIE VAN WAGNERLAURI STRANO, M.S.BOHDAN S. LOTYCZEWSKIGUILLERMO MONTES, PH.D.ANDREW MACGOWAN, M.S.PATRICIA DANGLER, M.S.ROBIN HOOPER, ED.D.REBECCA BOYLE, M.S.LYNN LUBECKI, ED.D.DAWN BREITUNG, M.S.DIANA VALDEZ, M.S.IDA PEREZDAVID PEELLE, MBASeptember 2017RECAP 2016-2017 Twentieth Annual Report September 2017 Number T17-011 2017 CHILDREN’S INSTITUTE INC., 274 N. GOODMAN STREET, SUITE D103, ROCHESTER, NY 14607 ALL RIGHTS RESERVED
Rochester Early Childhood Assessment Partnership2016-2017 Twentieth Annual ReportCHARLES J. INFURNA, ED.DA. DIRK HIGHTOWER, PH.D.KATHLEEN EMBTGENEMARIE VAN WAGNERLAURI STRANO, M.S.BOHDAN S. LOTYCZEWSKIGUILLERMO MONTES, PH.D.ANDREW MACGOWAN, M.S.PATRICIA DANGLER, M.S.ROBIN HOOPER, ED.D.REBECCA BOYLE, M.S.LYNN LUBECKI, ED.D.DAWN BREITUNG, M.S.DIANA VALDEZ, M.S.IDA PEREZDAVID PEELLE, MBASeptember 2017Children’s Institute is a recognized leader in programs, research, and evaluations supporting children’s socialand emotional health. Our partner COMET Informatics offers a data support system that provides informeddecision-making, organizational quality improvements, and improved outcomes for children and youth.Children’s Institute (EIN 23-7102632) is a 501 (3) non-profit organization.For more information, visit www.childrensinstitute.net and www.comet4children.comRECAP 2016-2017 Twentieth Annual Report September 2017 Number T17-011 2016 CHILDREN’S INSTITUTE INC., 274 N. GOODMAN STREET, SUITE D103, ROCHESTER, NY 14607 ALL RIGHTS RESERVED
Table of ContentsAcknowledgmentsiExecutive SummaryiiIntroduction to RECAP1Program Quality – ECERS-3ECERS-3 Aggregate Results for 2016-2017EPK ECERS-3 PerformanceUPK ECERS-3 PerformanceComparison of RECAP UPK and EPK ECERS-3 Scores567810Program Quality – CLASSClassroom Assessment Scoring System (CLASS)CLASS UPK and EPK Combined ResultsEPK CLASS PerformanceUPK CLASS Performance1212121517Student Performance – AcademicsBrigance Early Childhood Screen III (Brigance III)UPK Student PerformanceEPK Student PerformanceChild Observation Record Advantage (COR )UPK Student PerformanceDose of Programming and Social Emotional OutcomesEPK Student PerformanceUPK Student Performance and AttendanceEPK Student Performance and Attendance21212123252631364245Student Performance – Social/EmotionalTeacher-Child Rating Scale (T-CRS)UPK Student Social-Emotional HealthEPK Student Social-Emotional HealthUPK Student Social-Emotional Health and AttendanceEPK Student Social-Emotional Health and Attendance474747495054RECAP 2016-2017 Twentieth Annual Report September 2017 Number T17-011 2016 CHILDREN’S INSTITUTE INC., 274 N. GOODMAN STREET, SUITE D103, ROCHESTER, NY 14607 ALL RIGHTS RESERVED
Family PerspectivesFamily and Teacher Relationship Quality MeasuresFTRQ – Family QuestionnaireFTRQ – Teacher QuestionnaireFTRQ – Director QuestionnaireParent Satisfaction Survey585859646971Recommendations73Presentations and Publications75References76RECAP 2016-2017 Twentieth Annual Report September 2017 Number T17-011 2016 CHILDREN’S INSTITUTE INC., 274 N. GOODMAN STREET, SUITE D103, ROCHESTER, NY 14607 ALL RIGHTS RESERVED
iAcknowledgmentsThis report was made possible by the contributions of many partners, including early educationprograms, funders, parents, volunteers, and other interested groups. We thank the manyindividuals who, year after year, give their time, ideas and support to the Rochester EarlyChildhood Assessment Partnership (RECAP).Financial support was provided by the Rochester Area Community Foundation, Rochester'sChild Fund of the Rochester Area Community Foundation, the Rochester City School District,the New York State Education Department, and private service providers who purchasedRECAP services.Program partners include: Action for a Better Community’s Early Education Division, EarlyChildhood Education Quality Council Centers, Family Resource Centers of CrestwoodChildren’s Center, Ibero, Florence S. Brown pre-k classrooms, Rochester Preschool-ParentProgram, Rochester City School District programs, YMCA programs, and the followingindependent child care centers: Caring and Sharing, Community Place at Carter Street, MonroeCommunity College’s Richard M. Guon Child Care Center, and Stepping Stones LearningCenter.We thank the teachers, adult family educators, parent coordinators, directors, and administratorswho work closely with thousands of students and their parents. Their personal attention tofamilies contributes greatly to RECAP. These individuals unselfishly contribute information andshare their insight with the Assessment Team, which is vital to our continuous improvementsystem. We would especially like to recognize and thank the teachers who have continued tohelp us improve the process of collecting and sharing information about the children in RECAP.Their comments and feedback, especially regarding new software and data collection andmanagement technology, have been invaluable.We thank the thousands of parents who gave time from their busy schedules to share theirthoughts and perceptions about their children and other topics. Without parents, RECAP wouldnot be as complete or comprehensive.We thank the RECAP Advisory Council and especially Nancy Kaplan, its chair, for helping us tokeep the needs of children and all our partners foremost in our operations, and for its valuablefeedback and insights regarding the current goals and activities of our community’s earlychildhood system.We thank the communications staff of Children’s Institute for contributions to this report.RECAP 2016-2017 Twentieth Annual Report September 2017 Number T17-011 2016 CHILDREN’S INSTITUTE INC., 274 N. GOODMAN STREET, SUITE D103, ROCHESTER, NY 14607 ALL RIGHTS RESERVED
iiExecutive SummaryRECAP’s Major Findings for 2016-2017 – UPKStudents Academically, as measured by the COR Advantage, students made as much as two years’gains. However, as we have reported in previous years, students are still entering UPKwell behind developmental expectations set for four year old children. Even thoughstudents are making great gains throughout the school year, only 57% of UPK studentsare ready to transition to kindergarten as defined by COR Advantage. A screening evaluation administered in the fall is the Brigance III. The Brigance IIImeasures the Language Development, Cognitive Development, and PhysicalDevelopment of children in six month increments. Similar to previous reports (Infurna etal., 2016), we found that 65% of UPK students enter the school year functioning withinthe normal developmental range. However, 35% of students were identified as being atrisk and possibly in need of a more formal evaluation and/or close monitoring. The social-emotional health of our UPK children was measured by the T-CRS. At thefall reporting period, 77% of students were found to have no social-emotional risks. Atthe spring reporting period, 79% of students were found to have no social-emotionalrisks. For the fourth consecutive year, RECAP analyzed the relationship between attendance,school readiness, and social-emotional well-being. Students attending greater than 90%of the time were more school ready than their peers attending less than 90% of the time.Socially, no statistical difference was found across the four domains of the T-CRS (TaskOrientation, Behavior Control, Assertiveness, and Peer Social Skills) and time spent inthe classroom.Classrooms The 2016-2017 school year marked the second consecutive year the ECERS-3 wasimplemented. Growth was made in all six of the ECERS-3 domains. The total mean forUPK teachers (n 105) was 5.4, up .2 from the previous year. RECAP teachers continued to maintain a high level of classroom quality as measured bythe CLASS. Growth was made in the Emotional Support, Classroom Organization, andOverall domains. The mean Overall score increased to 5.6, up .2 from the previous year.RECAP’s Major Findings for 2016-2017 – EPKStudents With the 2016-2017 school year serving as a baseline for full day/full year programming,three year old students made significant gains across the Language, Literacy, andCommunication, Physical Development and Health, Mathematics, and Creative Artsdomains of the COR Advantage.RECAP 2016-2017 Twentieth Annual Report September 2017 Number T17-011 2016 CHILDREN’S INSTITUTE INC., 274 N. GOODMAN STREET, SUITE D103, ROCHESTER, NY 14607 ALL RIGHTS RESERVED
iii EPK students completed the 2016-2017 school year with higher means across all CORAdvantage domains than UPK students entered the school year with in the fall (SeeFigure 3 of 2016-2017 RECAP Annual Report). Student academic growth was shown to be effected by attendance. Students attendinggreater than 80% of the time made more gains on the COR Advantage than their peersnot attending as frequently. EPK student Brigance III screen status scores mirror those of the 2015-2016 cohort.Approximately 72% of three year old children entered EPK scoring within the normaland possibly gifted and talented domains. Student social-emotional health also grew throughout the academic year. The TaskOrientation, Assertiveness, and Peer Social Skills domains of the T-CRS had moderatelyhigh effective sizes, showing growth between fall and spring reporting periods. Students attending greater than 80% of the time made significant growth in theAssertiveness domain of the T-CRS as compared to their peers not attending asfrequently.Classrooms For the second consecutive year, the ECERS-3 was implemented in all EPK classrooms(n 72). Slight regression was observed in all the domains of the ECERS-3, with theTotal Score dropping from 5.3 in 2015-2016 to 5.2 in 2016-2017. In 2016-2017, EPK teachers (n 72) showed growth in the CLASS, with gains beingmade in the Emotional Support, Instructional Support, and Overall domains. TheOverall score for EPK teachers was 5.3, up from 5.2 the previous year.RECAP’s Major Findings for 2016-2017 – Family PerspectivesFamilies (FTRQ-Family) Family perspectives were measured by piloting The Family and Provider/TeacherRelationship Quality questionnaire (FPTRQ). For RECAP purposes, the title wasshortened to Family and Teacher Relationship Quality questionnaire (FTRQ – Family).Families were asked to rate their perceptions of their relationship with their child’steacher. Significant growth was reported by families completing the questionnaire at fall andspring reporting periods (n 367). The Practices/Collaboration, Practices/Responsiveness, Practices/Communication, Practices/Family-focused concern,Practices (all subscales), and Attitudes (all subscales) all showed significant growthfrom fall to spring reporting.Families (FTRQ-Teacher) The FTRQ –Teacher measure focuses on how teachers work with families of the childrenin their classroom. Fall and spring reporting by classroom teachers showed growth inmost of the subscales of the questionnaire (Knowledge/Family Specific, Practices/Collaboration, Practices/Responsiveness, Practices/Communication, Practices (allsubscales), Attitudes/Commitment, and Attitudes (all subscales)).RECAP 2016-2017 Twentieth Annual Report September 2017 Number T17-011 2016 CHILDREN’S INSTITUTE INC., 274 N. GOODMAN STREET, SUITE D103, ROCHESTER, NY 14607 ALL RIGHTS RESERVED
1Introduction to RECAPRECAP began in 1992 as a collaboration of the United Way of New York State, the RochesterArea Community Foundation, the Rochester City School District (RCSD), the Center forGovernmental Research (CGR), Action for a Better Community (ABC), and Children’s Institute.Since its inception, one of RECAP’s overall guiding tenets has been to continuously promote,ensure, and improve the quality of pre-k classroom experiences through the use of an integratedand comprehensive information system. In addition to providing information to enhancechildren’s, teachers’, and systems’ performance, RECAP works to translate collected data intousable information for parents, providers, and policy makers. This has resulted in informed andtargeted interventions for children, professional development activities for providers, andchanges in policy by funders and governments. Throughout its history, RECAP has collaboratedwith many partners, including area foundations, local governments, public and parochial schools,Head Start programs, and early education teachers at multiple schools and community-basedorganizations.Each year, RECAP provides important services – primarily to providers and policy makers –which include: Professional development for teachers and program administrators in the use of childscreening measures, assessments, and rating scales and the interpretation of reports. Efficient and user-friendly data collection and feedback reports, with reports looped back toteachers and directors. Primarily this is accomplished using COMET system reports, whichprovide instant feedback, and paper reports, when desired, at the child, classroom, program,and system levels. Training teachers and observers on fidelity implementation and quality indicators of thestandards assessed with the Early Childhood Environment Rating Scale, third edition(ECERS-3) and the Classroom Assessment Scoring System (CLASS). Twice monthly review and planning meetings with community-based organizations, ABCHead Start, RCSD, and other early education community leaders and evaluators to analyzeand synthesize available information, recommend changes, and monitor the systematicquality of early education in Rochester. Quarterly Community Advisory Group meetings to facilitate support and direction from andto the community. Community presentations of aggregate results to facilitate understanding of outcomes forpre-kindergarten children and to support informed decision making.In sum, information-based decisions are integrated into a continuous improvement system thatstrives to ensure and maintain high quality pre-k programs and improve students’ overallperformance and outcomes.RECAP 2016-2017 Twentieth Annual Report September 2017 Number T17-011 2016 CHILDREN’S INSTITUTE INC., 274 N. GOODMAN STREET, SUITE D103, ROCHESTER, NY 14607 ALL RIGHTS RESERVED
2Consistently, RECAP uses reliable and valid measures to assess program quality and studentoutcomes. Throughout RECAP’s 23-year history, the ECERS (or its updated version, theECERS-3) was used to study classroom quality. Starting seven years ago, the CLASS, arelatively “new” measure at that time, was piloted with random subsamples of RECAPclassrooms. The pilot lasted from 2009 to 2012; approximately 30 classrooms per year, 95classrooms overall, were randomly selected to receive CLASS training and observations. Duringthe pilot phase, analyses repeatedly showed that, while both the ECERS and CLASS assessedclassroom quality, the quality indicators within the CLASS and those within the ECERS-R aredifferent. Therefore, for the 2012-2013 school year, all RECAP classrooms were observed withthe CLASS instrument, as well as the ECERS-R. The 2015-2016 school year marks the fourthyear that the CLASS instrument was used to assess all RECAP classrooms.To measure levels of students’ competencies and needs within academic, motoric, and noncognitive or social/emotional domains, the Child Observation Record - Advantage (CORAdvantage) and the Teacher-Child Rating Scale (T-CRS) were completed in the fall and again inthe spring. In keeping with national trends, state requirements, and local needs and for screeningchildren early in the school year, the Brigance Early Childhood Screen III (Brigance III) wasused for the second time this year. Children’s attendance and parental participation were alsorecorded by school staff, primarily teachers, each school day.The level of parents’ perceived involvement with multiple facets of their children’s educationwas evaluated using the Family Involvement Questionnaire (FIQ). The FIQ is a parent completedquestionnaire. Parents report their time spent in their children’s pre-k classrooms, with theirchildren’s teachers, and participating in educational activities with their children at home. TheFIQ was completed by parents at the beginning and at the end of the school year. Teacher-parentcommunications were record by pre-k programs via the web-based COMET Informatics system.RECAP 2016-2017 Twentieth Annual Report September 2017 Number T17-011 2016 CHILDREN’S INSTITUTE INC., 274 N. GOODMAN STREET, SUITE D103, ROCHESTER, NY 14607 ALL RIGHTS RESERVED
3Table 1 below summarizes the screening and assessment measures collected and the totalnumber of assessments completed during the 2016-2017 school year.Table 1. RECAP Variables, Measures, Numbers Assessed, and Method of AssessmentRECAP 2016-2017 Variables, Measures, Number Assessed and MethodsCompletedAssessments inVariablesMeasures2016-2017MethodClassroom ObservationClassroom EnvironmentECERS-3177by IndependentQualityObserverClassroom ObservationQuality Teacher andClassroom Assessment199by IndependentStudent InteractionsScoring System (CLASS)ObserverAcademic, Motor, andCOR Advantage (COR )3,251Teacher ObservationSocialSchool, Emotional, andBehavioral AdjustmentTeacher-Child RatingScale (T-CRS)Academic Skills, PhysicalDevelopment, and HealthBrigance EarlyChildhood Screen IIIFamily and TeacherRelationship Quality(FTRQ) – FamilyQuestionnaireFamily and TeacherRelationship Quality(FTRQ) – TeacherQuestionnaireFamily EngagementFamily Engagement2,894Teacher Observation2,841Child DirectPerformance843Parent Survey89Teacher SurveyRECAP student demographic information is presented in Table 2 (UPK) and Table 3 (EPK).Table 2. RECAP UPK Student DemographicsRECAP UPK 2016-2017 UPK Student Demographics(n 2321)Male50%GenderFemale50%Black/African American56%Race/EthnicityWhite CaucasianHispanic/LatinoAsianNative AmericanOther12%23%4% 1%4%RECAP 2016-2017 Twentieth Annual Report September 2017 Number T17-011 2016 CHILDREN’S INSTITUTE INC., 274 N. GOODMAN STREET, SUITE D103, ROCHESTER, NY 14607 ALL RIGHTS RESERVED
4Table 3. RECAP EPK Student DemographicsRECAP EPK 2016-2017 EPK Student Demographics(n 1309)Male50%GenderFemale50%Black/African American62%White %Native American 1%Other 1%RECAP 2016-2017 Twentieth Annual Report September 2017 Number T17-011 2016 CHILDREN’S INSTITUTE INC., 274 N. GOODMAN STREET, SUITE D103, ROCHESTER, NY 14607 ALL RIGHTS RESERVED
5Program Quality – ECERS-3For 20 years, RECAP has documented the quality of pre-kindergarten classroom environmentsin the Rochester area using the Early Childhood Environmental Rating Scale (ECERS). In 2005,the developers of the ECERS released a revised edition of the instrument, the ECERS-R (Harms,Clifford, & Cryer, 2005). Upon its release, the ECERS-R was immediately incorporated intoRECAP’s pre-kindergarten program evaluation process. The ECERS-R was the nationallyrecognized observation instrument for assessing and evaluating the early childhood classroomenvironment. In 2015, the ECERS developers released the ECERS-3, which represented a majorrevision of the ECERS-R. Upon its release, RECAP adopted ECERS-3 to assess EPK and UPKclassrooms. Each year for the past two years, several training opportunities have been scheduledto permit teachers to learn more about the new ECERS-3.Independent observers score 35 ECERS-3 items on a 7-point scale, where 1 indicates“Inadequate” quality and 7 represents “Excellent” quality. The items are organized into 6subscales: Space and Furnishings, Personal Care Routines, Language and Literacy, LearningActivities, Interactions, and Program Structure. Unlike the ECERS-R, which required closeattention to the number of accessible materials provided to children within the classroom, theECERS-3 has shifted the focus of the observation from materials to how teachers use thematerials found within their classrooms to engage and stimulate student learning, with anemphasis on pre-academics and interactions (Harms, Clifford, & Cryer, 2015). Other changesincorporated in the ECERS-3 include five new items in the Language and Literacy subscale,three new math items, which focus on concept development, and the elimination of parent relateditems, as they were not directly assessed, but were instead based on observer-teacher interview,and typically showed little variation among teachers.From the beginning of its use in RECAP, the ECERS and, subsequently, the ECERS-Rconsistently showed that almost all UPK (four-year-old) classrooms in Rochester achieved atleast “good” ( 5.0) quality, with many performing in the “excellent “ range (6.2-7.0) for 3 ormore years in a row. The continual focus on, and support of, the professional development ofclassroom teachers by RECAP and its participating programs resulted in an average ratingranging from “very good” to “excellent” (5.8-6.2 out of 7) on the ECERS-R for the past tenyears. For each of the past eight years, the average ECERS-R score was 6.1 or higher (Infurna etal., 2015).The consistently high ECERS-R scores of the classrooms participating in RECAP prompted achange to the evaluation procedures used to assess classrooms’ quality. In the 2007-2008 schoolyear teachers were allowed to receive an “exemption” from the annual ECERS-R assessment byachieving overall scores of at least 6.5 for five consecutive years. Exempt teachers were notrequired to have an ECERS-R observation for the following three years. After additionalanalyses and observations were conducted on teachers’ ECERS-R scores, it was found thatteachers who had obtained scores of 6.2 or higher over the course of three consecutive years hadmastered the ECERS-R standards. Therefore, in 2012-2013 the “exempt” criterion changed torequire a total ECERS-R score of at least 6.2 for three consecutive years, which is the currentcriterion for an “exempt” designation. Teachers retain their exemption status for three years, atRECAP 2016-2017 Twentieth Annual Report September 2017 Number T17-011 2016 CHILDREN’S INSTITUTE INC., 274 N. GOODMAN STREET, SUITE D103, ROCHESTER, NY 14607 ALL RIGHTS RESERVED
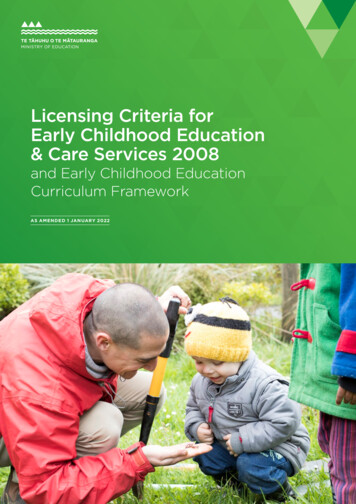
6which time another observation is completed. If classroom quality is scored as 6.2 or higher, the“exempt” status is in place for an additional 3 years. If classrooms do not meet the 6.2 threshold,they are observed annually until they meet the exemption criteria again. In 2016-2017, 22 UPKteachers had exempt status.ECERS-3 Aggregate Results for 2016-2017For over 10 years, the Rochester community was witness to “very good” to “excellent” ECERSR scores, a reflection of the quality programming offered to UPK children and their families. In2015-2016, with the new release of the ECERS-3, program scores dipped slightly. The lowerECERS-3 scores, in part, were a reflection of the transition to using the new tool to observe thequality of programming in both EPK and UPK classrooms. In 2016-2017, the ECERS-3community scores rose slightly, with UPK classrooms showing growth both in the subscalescores and overall mean score.This year (2016-2017) marked the second year of community wide implementation of theECERS-3. In total, 177 EPK and UPK classrooms were assessed by the ECERS-3. The overallmean score for the community was 5.3, a negligible increase from the previous year mean of 5.2.Figure 1 reports a comparison of Rochester 2015-2016 and 2016-2017 ECERS-3 scores for allobserved classrooms. Overall, four subscales saw increases from the previous year (Space,Routines, Language, and Activity). Two of the subscales (Interactions and Program) remainedthe same.The following sections are separated by program, beginning with EPK classrooms.As previously noted, this year an additional 25 EPK classrooms were opened. Figure 2 reports acomparison of 2015-2016 and 2016-2017 ECERS-3 for EPK classrooms subscale and overallmean scores. A comparison of 2015-2016 and 2016-2017 ECERS-3 scores for UPK classroomsis reflected in Figure 3.UPK program results follow EPK program scores. Figure 4 depicts a comparison of scoresbetween 2016-2017 EPK and UPK classroom programming. As noted in Figure 4, t-testanalyses indicated that UPK Language, Activity, and Total Mean score subscales weresignificantly higher than their EPK classroom peers.RECAP 2016-2017 Twentieth Annual Report September 2017 Number T17-011 2016 CHILDREN’S INSTITUTE INC., 274 N. GOODMAN STREET, SUITE D103, ROCHESTER, NY 14607 ALL RIGHTS RESERVED
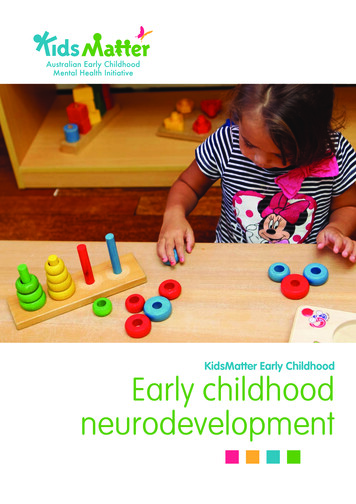
7Figure 1. Previous Two Years of Combined EPK/UPK ECERS-3 Subscale andTotal Means7ECERS-3 ramTotalScore2015-16 (n 148)4.74.85.24.46.165.22016-17 (n 177)4.955.44.56.165.3As noted, a slight increase of subscale scores was observed during the 2016-2017 school year.Even with the addition of 25 new EPK classrooms, scores slightly rose in the Space, Routines,Language, Activity, and Total Score subscales. The Space subscale measures the physicallayout and furnishings within the classroom. The Routines subscale measures the personal careand safety procedures in place for the children. The Language subscale measures vocabularyexpansion, book use, and print awareness items. The Activity subscale measures fine motor, art,dramatic play, and math concepts.ECERS-3 Results: 2016-2017 EPK ProgrammingEPK programming expanded by 25 new classrooms and 400 new students in the 2016-2017school year. Infurna et al., (2016) noted that this expansion required a mammoth undertaking ofprofessional development for newly hired teachers. Rochester City School District, as well asChildren’s Institute staff, provided new teacher ECERS-3 training throughout the school year.Children’s Institute held four sessions of Introductory ECERS-3 Training for all new teachers.After teachers received their ECERS-3 results, they were encouraged to attend an ECERS-3Interpretation Workshop for an individualized review of their classroom observation. Overall,six ECERS-3 trainings were offered to EPK and UPK teachers throughout the school year. Inaddition to formal training sessions, RECAP’s “Collaborative Review” process is considered amajor opportunity for professional development and continuous learning on the ECERS-3.For 2016-2017, the overall mean score for EPK ECERS-3 programming was 5.2 (see Figure 2).RECAP 2016-2017 Twentieth Annual Report September 2017 Number T17-011 2016 CHILDREN’S INSTITUTE INC., 274 N. GOODMAN STREET, SUITE D103, ROCHESTER, NY 14607 ALL RIGHTS RESERVED
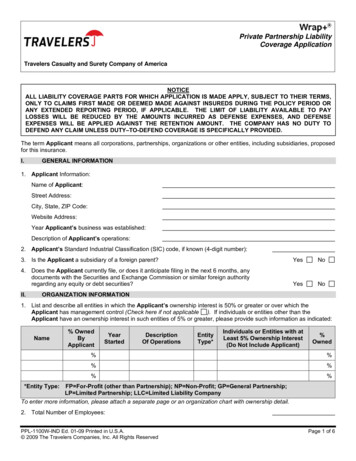
8Figure 2. Comparison of 2015-2016 with 2016-2017 EPK ECERS-3 Scores7.0ECERS-3 nteract.ProgramTotalScore2015-16 (n 47)4.94.95.34.66.36.05.32016-17 (n 72)4.84.95.04.36.05.95.2With the expansion of EPK programming, scores dropped slightly from the 2015-2016 schoolyear (See Figure 2). Originally marked as a benchmark of continuous improvement for programquality, and with the addition of 25 classrooms, the 2016-2017 school year will serve as a “new”benchmark for EPK programming moving forward. In the aggregate, all but one of the subscaleslost ground (Routines) in 2015-2016.The slight difference in scores from the previous year could be due to a number of factors. First,25 additional teachers were hired in 2016 and close to 50 were hired in 2015. With such aninflux of new EPK teachers new learning must occur. We have observed that it frequently takesthree to five years of focused training and attention for new teachers to improve theirperformance. Also, in addition to 72 new EPK classroom teachers being hired over the past twoyears, over 1100 new children were enrolled in new EPK programming for the first time.Children as young as 2 years and 7 months began EPK programming in September, 2016. Forsome children enrolled in structured programming for the first time the initial shock and lack ofawareness could also have been a cause for the lower ECERS-3 scores as reported for 20162017. In sum, at this time RECAP staff are not concerned about the slight downturn in EPKECERS-3 results.ECERS-3 Results: 2016-2017 UPK ProgrammingFor the 2016-2017 school year, the Total mean score for UPK teachers rose to 5.4 (see Figure 3),up 0.2 points from last year.RECAP 2016-2017 Twentieth Annual Report September 2017 Number T17-011 2016 CHILDREN’S INSTITUTE INC., 274 N. GOODMAN STREET, SUITE D103, ROCHESTER, NY 14607 ALL RIGHTS RESERVED
9Figure 3. 2015-2016 and 2016-2017 UPK ECERS-3 Scores7.0ECERS-3 nteract.ProgramTotalScore2015-16 (n 99)4.64.85.14.36.06.05.22016-17 (n 105)4.95.15.64.76.26.15.4ECERS-3 observers of UPK programs saw growth across all six subscales of the ECERS-3 (seeFigure 3) in 2016-2017. The greatest growth (0.5) was made in the Language subscale. TheLanguage subscale is made up of five items; 1) helping children expand vocabulary, 2)encouraging children to use language, 3) staff use of books with children, 4) encouragingchildren’s use of books, and 5) becoming familiar with print. Similar to items in theInstructional Support (Language Modeling and Quality of Feedback) domain of the CLASS,UPK teachers were observed to spend a dedicated amount of time working on languageexpansion and book use in the classroom.The Space and Routines subscales each increased by 0.3 from the previous school year. TheActivity subscale rose by 0.4, up to 4.7. The Interaction and Program subscale saw slightincreases of 0.2 and 0.1 from the previous year of 6.0 and 6.1 respectfully. The Total mean roseby 0.2, up to 5.4 for the 2016-2017 school year. In sum, year over year UPK classroomsimproved on every subscales on the ECERS-3.RECAP 2016-2017 Twentieth Annual Report September 2017 Number T17-011 2016 CHILDREN’S INSTITUTE INC., 274 N. GOODMAN STREET, SUITE D103, ROCHESTER, NY 14607 ALL RIGHTS RESERVED
10Comparison of RECAP UPK and EPK ECERS-3 ScoresFigure 4. Comp
Brigance Early Childhood Screen III (Brigance III) 21 UPK Student Performance 21 EPK Student Performance 23 . Children's Center, Ibero, Florence S. Brown pre-k classrooms, Rochester Preschool-Parent Program, Rochester City School District programs, YMCA programs, and the following . ii RECAP 2016-2017 Twentieth Annual Report September .