Transcription
Fall 2010The Biodiversity Scorecard:Taking Stock of Washington’s Natural Riches
The Washington Biodiversity CouncilThe Washington Biodiversity Council was a public-privatepartnership chartered by executive order from 2004 through June2010. Council members included private landowners, agencyRead the FULL Reportnatural resource managers, tribal representatives, and membersof the education, business, and environmental communities.Material for this publication isThe Council was tasked by the Governor with crafting anddrawn from the Biodiversityguiding the Washington Biodiversity Conservation Strategy, aAssessment Framework: Draftlong-term vision and approach for conserving Washington’sConceptual Model, Indicatorsremarkable biological diversity for the benefit of all.and Metrics, a January 2010report from Steven Walters andDuring its tenure, the Council:John Marzluff of the University Defined conservation priorities through a mapping effort.of Washington’s College of the Highlighted incentives for private landowners to protectEnvironment and School ofForest Resources. The originalreport was sponsored bythe NOAA/National MarineFisheries Service, the U.S.Fish and Wildlife Service, theWashington Department ofFish and Wildlife, and theWashington Department ofNatural Resources. For the moretechnically oriented, this reportis available at the Biodiversity’sCouncil website,www.biodiversity.wa.govbiodiversity. Engaged citizen scientists and measured progress towardconservation goals. Assisted local governments with incorporating biodiversitystewardship practices into planning. Made scientific information available to decision makersand the public. Educated Washingtonians of all ages on the importance ofbiodiversity. Worked collaboratively with communities to enhancestewardship.The important work of biodiversity conservation in Washingtoncontinues to be carried out by the Council’s many partners.CreditsEditorial: Michael Kustudia,Sarah GageDesign: Joanna Yardley
The Biodiversity Scorecard:Taking Stock of Washington’s Natural WealthThe Scorecard at a Glance 2Why Indicators? 3Biodiversity: Nature’s Wealth, Our BenefitWhat Are We Measuring? 4Indicator CategoriesBiodiversity Conservation: It’s All Connected 6Selecting the Scorecard Indicators 7Citizen Science and the Biodiversity ScorecardThe Biodiversity Indicators 9Assessing Biodiversity Across the WorldTesting Out the Indicators 13Washington’s BiodiversityMeasured in What Time Frame?Future Promise and Work Ahead 16GlossaryBuilding the capacity to assess the condition of Washington’sbiodiversity.
The Scorecard at a GlanceThe Biodiversity Scorecard lays the groundwork for a comprehensive, science-based assessmentof Washington’s biodiversity and the human and biophysical resources that affect it.While still under development, the scorecard will provide valuable information to decisionmakers and the public on the overall status of Washington’s biodiversity. The scorecard holdspromise to help identify and guide legislative, policy, and management priorities and objectives, aswell as to help assess the effectiveness of actions to conserve biodiversity.The Biodiversity Scorecard: Relies on state-of-the-science techniques employed around the world. Uses indicators that are selective enough to provide precision, but broad enough to drawkey ecosystem relationships. Includes the effects of human actions and the benefits we derive from the natural world. Offers a snapshot in time and serves as a baseline to chart trends. Provides an overall index of the state’s natural wealth.PAGE 2washington biodiversity Council
Why Indicators?Just how do you take stock of the ecological treasures that makeup Washington’s natural wealth?It’s been said that what gets measured, matters. Whether it’s the stock exchange, baseball statisticsor a grocery bill, people follow numbers. We keep a close accounting of important things, likeour checkbooks. And so it is with our natural world. It’s important to understand the state ofbiodiversity because its well-being is essential for ours. But just how do you measure Washington’snatural wealth?The Washington Biodiversity Council took up that question in the Biodiversity Scorecard. Justas a checkbook has a balance sheet of deposits and expenses, the Biodiversity Scorecard tracksnature’s portfolio. In its 2007 Conservation Strategy, the Council identified the need for a scorecardthat would track trends in the health of the state’s natural heritage and assess the effectiveness ofconservation efforts.On behalf of the Biodiversity Council, researchers at the University of Washington drafted ameasurement tool that will show the strengths and weaknesses of four key categories in ournatural world over time. This ambitious framework can provide a current assessment and set abenchmark for future study.Biodiversity: Nature’s Wealth, Our BenefitThe natural world that human life depends on is so vast that it defies easydescription. Scientists use the word biodiversity as shorthand for biologicaldiversity, a term that encompasses every living thing on this planet. Considerbiodiversity as science-speak for our planet’s living wealth, that array of speciesand ecosystems that provides us with clean air to breath, clean water to drink,many of our medicines, healthy soils to grow food, fish to catch, and wild placesand creatures to contemplate.Washington’s biodiversity is not only central to our region’s ecological health, it’salso an engine of the economy and a dominant feature in our quality of life. Butbiodiversity is declining here, as it is around the world.The Biodiversity scorecardPAGE 3
What Are We Measuring?Few things are as complicated and difficult to describe as a living system. At the mention ofbiodiversity, some things come quickly to mind: numbers of species, or the variety ofecosystem types. By themselves, these living elements of the natural world can serve asrough indicators of biodiversity, using measures like acres of forest, or the number of animals on thestate list of at-risk species.But if we only measure the numbers of certain things, it would be like taking the heartbeat of a patientwithout examining the processes affecting that heartbeat, such as whether the patient has heartcongestion or is a long-distance runner. Indicators are needed that assess the key natural processesthat species and ecosystems depend on for existence—among them pollination, nutrients movingthrough a food web, and fire and flood occurrences.Similarly, people affect the natural world in many ways. It’s important that indicators look at the linksbetween human activities and ecosystem health. These can encompass the uses people make ofland, how many people participate in environmental education programs, and how well people controlpollution levels.Equally important, nature provides numerous benefits, the full value of which we are only nowbeginning to calculate. Human well-being depends on these natural benefits, often referred to asecosystem services. These services range from the clean drinking water supplied by a watershed andthe flood protection afforded by vegetation, to how many places we have to hike, camp, hunt, watchbirds, or enjoy wildflowers. Indicators that illustrate these benefits will help create a greater sense ofstewardship, heightening our awareness of the many ways that biodiversity matters and how we canplay a role in its conservation.These four facets of biodiversity—elements of the living world, ecological processes, human activities,and ecosystem services—provide the scorecard’s field of focus. Taken together as a conceptualframework, they allow us to home in on the most important indicators to consider.PAGE 4washington biodiversity Council
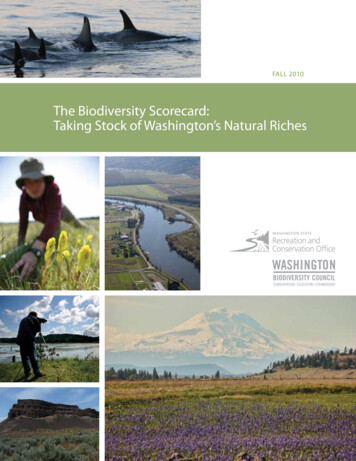
elements ofbiodiversityecologicalprocessesPlant and animal speciesIconic and at-risk speciesPlant communities / ecosystemsSoil organic matterPollinators and predatorsPlant productivityFlowering and migration datesFire, floods, insect outbreakshuman factorsecosystemservicesLand use/cover changePollution levelsConservation land baseCitizen scienceWater quality and quantityFish and game provisionTimber & crop yieldsParks and wildlife viewing areasThis graphic depicts the Scorecard’s fourinterrelated indicator categories, withexamples drawn from the set of 30 indicators,that will be used to help assess the status ofWashington’s biodiversity.Indicator CategoriesElements of Biodiversity: the pieces that make up lifeThese indicators include species, ecological communities, ecosystemcomponents such as soils, nutrients, water, landscape patterns and otherfeatures that species depend on.Ecological Processes: the interactions that support lifeThese indicators describe processes, such as pollination, nutrient cycles, andfire and flood occurrences, as well as other natural forces that either promote orhinder biological diversity.Human Activities: how people affect biodiversity both positivelyand negativelyThis indicator category looks at the full range of human activity, from thedetrimental (such as habitat fragmentation or loss and pollutant levels) tothe beneficial (such as conservation easements, state and national parks,environmental education and citizen science programs).Ecosystem Services: the essential benefits we derive frombiodiversityThese indicators look beyond the intrinsic ecological value of biodiversity tothe essential services and amenities that we require, such as clean air and water,food and fiber, and the aesthetic enjoyment of wildlife and natural scenery.The Biodiversity scorecardPAGE 5
Biodiversity Conservation: It’s All ConnectedThe scorecard’s four indicator categories are interrelated in myriad ways. Here are a couple ofpossible illustrations:Bumble bees or other native insects (elements of biodiversity) pollinate (an ecologicalprocess) balsamroots and apple trees (more elements of biodiversity) that produce flowers andfruit (another ecological process) ultimately for human consumption and aesthetic enjoyment(ecosystem services). But people (human activities) can affect bees both positively, by stewardinghabitat, and negatively, by using pesticides inappropriately.Or imagine morel mushrooms in a Douglas fir and ponderosa pine forest following a controlledburn. There’s a human activity (fire management) that affects elements of biodiversity (trees andmorels) that promotes an ecological process (nutrient cycling) that yields an ecosystem service(tasty morels as a food source).Central to the scorecard is the emphasis on connections among each of these components and,moreover, that we are measuring them in some way, whether it’s bee populations, pollinationrates, fruit production, pesticide use, or conservation efforts. The scorecard can bring togetherexisting data in new ways to yield important insights about Washington’s natural heritage.PAGE 6washington biodiversity Council
Selecting the Scorecard IndicatorsInitially the list of possible biodiversity indicators appeared almost infinite. In an important earlystep, the researchers interviewed potential users of the scorecard, experts in indicator methods, andmembers of the Biodiversity Council itself. These interviews provided useful guidance on indicatorsto include and insights on how the scorecard might be used. Another early step was to review the vastliterature on environmental indicators.To define the scope and narrow the possible approaches, the Council adopted a set of principlesthat describe the scorecard’s objectives, inform the criteria for selecting indicators, and point tohow the framework might best be assembled and maintained.Principles underlying the scorecard: Use the best available and appropriate science. Select a sufficient number of indicators but no more than necessary. Conduct an objective assessment free of “grades” or rankings that could imply advocacy. Separate indicators from specific policy or regulatory definitions. Maintain and update indicators in a neutral forum, separate from policy- and decision-making. Allow for advances in technology and scientific understanding. Integrate citizen science both to collect valid, cost-effective data and to engage the public.The researchers used these principles as well as additional guidelines from the literature todevelop criteria for examining a potential indicator.Indicator criteria: Is it quantifiable? Is it measurable and meaningful at different time scales (short term and long term) anddifferent spatial scales (such as in a watershed, a county, or across the whole state)? Is it especially relevant to measuring status and trends in one of the four indicator categories? Does it contribute to the scorecard’s comprehensiveness? Is it particularly sensitive to change so it could provide an early warning, like a canary in acoal mine? Does it describe something notable about nature’s benefits to people (ecosystem services)?“Choosing indicators is the art of measuring as little as possiblewith the highest possible policy significance. It is not only a scientificexercise but also a matter of art.” - United Nations Environmental ProgrammeThe Biodiversity scorecardPAGE 7
An extensive review resulted in an initial list of 136 potential indicators—an ungainly number.Subsequent expert technical review led to a final draft set of 30 indicators. While still a largenumber, it is on par with many similar efforts. And, rather than simply a laundry list, the chosenindicators are interrelated and most have existing metrics to quantify them.By assigning numerical values to the indicators, they can be selected and tallied in variousways to yield insights about particular categories, or combined for a big picture assessment ofbiodiversity’s current status.With its breadth, the Biodiversity Scorecard was designed to comprehensively describe the myriadfacets of biodiversity, but still be adaptable enough to inform a wide range of management, policy,and decision-making needs.Citizen Science and the Biodiversity ScorecardCitizen science—a term used for programs that partner volunteers with scientiststo perform research—is integral to the design of the Biodiversity Scorecard. Citizenscience programs already collect significant amounts of cost-effective data, such asthe North American Breeding Bird Survey.By expanding existing citizen science programs and developing new ones, wecan sustainably fill data gaps and engage and educate new audiences about theimportance of conserving biodiversity.PAGE 8washington biodiversity Council
The Biodiversity IndicatorsThe following chart of30 indicators comprisesa streamlined set ofrelevant measures for describingbiodiversity, the ecological andsocioeconomic factors that affectit, and the ecosystem services thatit provides. Interested in more details?Read the report atwww.biodiversity.wa.govElements of BiodiversityIndicatorHow Is It Measured?Why Is It Important?Plant and animaldiversityMeasures taxonomic groups (such as birds,mammals, plants, reptiles, amphibians, fish,invertebrates), assessing as available: Species richness and evenness are the most basic measures of biodiversity. Relative richness, the number of native species asopposed to individuals Relative balance/evenness, the relative degree thateach species is represented.Species occurrence/abundance trends Iconic species State-designated at-risk species Iconic species have cultural significance for public involvement. Declining population trends of at-risk species could provide an early warning ofchange in species richness in the near future.Plant community/ecosystem diversity Distribution of native vegetation Distribution and quality of critical and rareecosystems, as identified by the WashingtonNatural Heritage Program Beyond from their contribution to overall biodiversity, plants are intrinsicallyimportant for food and habitat. Historical trends indicate significant changes in the distribution of plant speciesand communities.Landscapecomposition andpattern Percent coverLargest patch indexLandscape diversityContagion index (a measure of aggregation/connectivity) Riparian vegetation Land cover (primarily vegetation) composition and spatial patterns are broadscale, relatively measured indicators of both habitat and ecosystem integrity. Patch sizes and landscape diversity provide measures of relative dominance ofspecific land cover types. Contagion gives a rough measure of ecosystem connectivity or fragmentation. Riparian vegetation relates to both habitat provision and water quality.Biotic integrity Index of Biotic Integrity Index of Biotic Integrity measures not only biological diversity, but also the statusand intactness of ecosystems.Soil organic matter Soil organic matter Soil conditions, a basis for nutrient and water cycles and life itself, reflectecosystem integrity, and provide a rapid indicator of systemic changes.The Biodiversity scorecardPAGE 9
Ecological ProcessesIndicatorHow Is It Measured?Why Is It Important?Functionaldiversity Pollinators, seed dispersers Predators Pollinators and predators serve important (keystone) roles in ecological processes.Phenologicaltrends Leaf-on and off dates Flowering dates Timing of migrations Seasonal trends and changes are indicative of systemic change, and can affect population persistence.This is an important indicator of climate change impacts.Plantproductivity Net primary productivity Measures of plant productivity provide a broad-scale assessment of the health and persistence ofplant communities.Disturbanceregimes Occurrence and abundance of bird speciesthat are disturbance-sensitive, tolerant ordependent Spatial extent of fire, insect outbreaks, floods,and wind-throws Occurrence rates of droughts and floods Trends in bird species guilds that are adapted to intrinsic disturbance processes are indicators ofdisturbance levels. Significant changes in disturbance regimes can adversely affect species, ecosystems, and humanwell-being. Significant fluctuations in water volumes affect ecosystem functions, and the species and humans thatdepend on them.Nutrientfluxes andconcentrations Water Quality Index Significant increases in material deposition and/or vegetation losses can lead to abnormally highnutrient levels. Low water quality can harm downstream aquatic ecosystems .Ecosystem ServicesIndicatorHow Is It Measured?Why Is It Important?Water provision andquality Area of municipal watershed lands in naturalland cover Amount of water derived from municipalwatersheds Water is the source of all life. This indicator can be used with landscape measures to illustrate water quality benefitsderived from maintaining ecosystem integrity.Fish and gameprovision Yields of fish and game species Fishing and hunting for sport and sustenance are a direct service of biodiversity.Resource provision Yields of timber, crops, and commercial fisheries Food and fiber represent a direct service of biodiversity and ecosystem integrity.Parks and greenspace Usage rates for hiking, camping, and otherwildland activities Outdoor recreation occurs on lands that provide plant and wildlife habitat.Wildlife viewing Participation rates Wildlife viewing offers opportunities for public engagement in biodiversity conservationand can provide an estimate of where wildlife can be found.Reducing impacts ofinvasive species Species and communities impacted Costs of mitigation This indicator measures the specific impacts of invasive species on ecosystem integrityand resilience as well as the associated costs.Reducing impacts ofherbivores Extent of damage by browsers and grazers Biodiversity contributes to ecosystem resilience; this indicator, when linked with others(e.g., predator trends, functional diversity), can illustrate how the loss of diversity reduceresilience.Flood mitigation Landscape pattern within federally designatedmoderate to high risk flood zones Flood and erosion mitigation are benefits derived from maintaining landscape integrity.Carbonsequestration Measures of carbon uptake capacity This measure indicates landscape-level contributions to climate change mitigationthrough vegetation-specific measures.Aesthetic impactson housing and landprices Land value as function of natural landcharacteristics (e.g. proximity to a remnant forest) The economic benefits of landscape aesthetics also serve to promote biodiversity andecosystem integrity. Insect defoliation damage This indicator illustrates how biodiversity contributes to ecosystem resilience and howthe loss of diversity can affect it.Reducing pestabundancePAGE 10washington biodiversity Council
Human FactorsIndicatorHow Is It Measured?Why Is It Important?Land base underconservation protection Distribution and extent of public,private,w and trust lands dedicated oramenable to biodiversity conservation Public and private land holdings either implicitly or explicitly maintained forbiodiversity reflect potentially available species habitat, and preservation of keyecosystem functions. Such a measure reflects human contributions to biodiversity conservation andecosystem integrity.Land use management Land cover composition of private landunder growth management and criticalarea ordinances Growth management policies define limits to urban/suburban development andprotect critical areas (steep slopes, wetlands, etc.) that can also preserve ecosystemintegrity and provide intact habitat.Incentive programs Distribution and extent of private landsunder forest stewardship certification Locations where incentive programs are in place can reflect human commitment tobiodiversity.Disturbance regimes Distribution and extent of land covertransitions This is a broad-scale indicator of potential losses or gains in habitat and landscapeintegrity.Pollution level Levels of exposure to toxic chemicalsPCB’s, PBDE, dioxins, pesticides Measures of significant contaminants indicate factors that can impact the health andintegrity of species, ecosystems, and humans.Disturbancemanagement Extent of fire suppression or controlledburn practices Extent of natural pest managementpractices Extent of windthrow abatement Disturbance management practices can serve as potential indicators of humancommitment to preserving ecosystem integrity.Citizen science Distribution and extent, and contentfocus of efforts within a given ecosystemtype Citizen science programs can reflect both the specific interests and knowledge base ofthe general public with respect to particular species or ecosystem types. It can also highlight opportunities for directly involving the public in measuringbiodiversity indicators, particularly those with limited data.Public engagement andeducation Distribution and extent and contentfocus of efforts within a given ecosystemtype Public engagement and environmental education can reflect the specific interests andknowledge base of the public. Environmental education can foster involvement and stewardship.The Biodiversity scorecardPAGE 11
Assessing Biodiversity Across the WorldThe declining state of biodiversity is a significant concern worldwide. Habitat lossand climate change are chief among the many forces threatening the planet’sbiodiversity from the Tropics to the Arctic, and from coral reefs to alpine peaks.International efforts such as the Millennium Ecosystem Assessment and UnitedNations Convention on Biological Diversity recognize the significance of suchlosses. Toward that end, 2010 was declared the International Year of Biodiversity.Indicator projects have been launched round the world, examining biodiversity atlocal, regional, and international levels.This significant global focus on biodiversity extends to our own backyard. With itscomplex geography, Washington State is home to an incredible natural wealth. It’svitally important to better understand its condition and value.PAGE 12washington biodiversity Council
Testing Out the IndicatorsOnce the 30 indicators were selected, the next step was to examine how well the scorecardwould work in an actual test case. Noting that “the devil is in the details,” the BiodiversityCouncil asked the researchers to apply these indicators at a particular geographic scale, themajor ecosystems of Washington (see map).The researchers applied the scorecard fully to the mesic forests of western Washington andpartially to the shrub-steppe of eastern Washington—two diverse ecosystems that cover morethan half of the state.Major Ecosystems Of Washington Alpine Mesic Forest Cultivated Aquatic Dry Forest Shrub-steppe Wetland UrbanWashington’s amazingly diverse flora and fauna inhabit a multitude of aquatic andupland ecosystems. Imagine everything from Roosevelt elk, salmon, and banana slugs inthe cedar-hemlock rain forest of the Olympic Peninsula to sharp-tailed grouse, mariposalilies, and western rattlesnakes in the sagebrush coulees of eastern Washington.The Biodiversity scorecardPAGE 13
What did we find out about measuring the indicators?In calculating metrics for the indicators in the test case, the researchers noted several things aboutthe available data. Data gaps occur but preliminary data are available in each of the four indicator categories. More detail is needed in some data sets. Expanded monitoring efforts are needed for some data sets. Citizen scientists could gather much of the needed data. Most data are available at local geographic scale—watershed or county level. Two major classes of metrics exist (see below): Metrics that measure conditions relative to what is possible. Metrics that measure conditions relative to recently observed trends. Both types can help evaluate the status of an indicator, and going forward, both canhelp evaluate trends.What’s the Time Frame?The scorecard’s indicator metrics fall within two classes: those measured relative to what is possible versus thosemeasured relative to recent observed trends. Indicators describing structural components—the pieces—of biodiversity, are generally measured asamounts or quantities. For example, indicators of species richness, land cover, and conservation lands aremeasured as proportions of the total amount potentially occurring within a given region. Indicators describing ecological processes—the interactions—of biodiversity, are generally measured asrates. For example, indicators describing trends in plant productivity, water quality, and resource yields arequantified as measures of current conditions relative to recent historical trends (roughly the past 5 to 20years depending on the data set).PAGE 14washington biodiversity Council
Level of computation effort varies. Many indicators required minimal computing effort,taking advantage of the vast data-mining capacity of contemporary databases and theInternet. Most data sets show agreement within an ecosystem. A subset of indicators might give as accurate an assessment—further work is neededto evaluate possible redundancies. Some indicators, however, are outliers, suggesting further work is needed todetermine why they tell a different story. Equal weighting of indicators yielded provisional insights, but it was recognizedas a simplistic approach. A more sophisticated evaluation would give greater weight toindicators that have a proportionally larger effect on biodiversity.These indicators provide a snapshot of current conditions; some of these indicators will havestronger meaning when measured over time. In this respect, the scorecard becomes a baseline forfuture assessments, which would provide a clearer picture of trends into the future.What did we find out about combining the indicators?The researchers combined the numbers derived from these measurements to examine how theBiodiversity Scorecard could deliver big-picture assessments. They found that a single numbercould be derived that represents the status of an ecosystem. When compared with the numbers from other ecosystems, this number could provide ameasure of how well an ecosystem’s biodiversity is doing relative to other ecosystems. When assessed over time, this number could be graphed toprovide trend information—similar to a stock market index. Alone, such a number yields little information.Interested in more details?Read the report atwww.biodiversity.wa.govFor example, in the test case, the combination “score” for the mesic forest ecosystem is about 70percent, while that of the shrub-steppe ecosystem is about 60 percent. This suggests that, overall,the biodiversity of western Washington’s forests is faring moderately well when contrasted to theshrub-steppe.In a further test, the researchers examined how to aggregate the indicators to generate higherlevel conclusions. They took a qualitative look at interactions and connections between indicatorsto see what they might be able to say about ecological resilience, sustainability, and integrity.With such versatility, the scorecard can provide valuable information to the public and decisionmakers on the overall status of Washington’s biodiversity. The results can provide guidance tolegislation, policy priorities, and management objectives, as well as providing a baseline forassessing the effectiveness of biodiversity conservation activities.The Biodiversity scorecardPAGE 15
Future Promise and Work AheadThe Biodiversity Scorecard is a promising work in progress. It lays the groundwork for aninclusive and integrative assessment of biodiversity in Washington State. By tracking changesin status and trends, the indicators can serve as pointers to why such change is occurring. Suchinformation in turn could
This graphic depicts the Scorecard's four interrelated indicator categories, with examples drawn from the set of 30 indicators, that will be used to help assess the status of Washington's biodiversity. Indicator Categories ElEmEnts of BiodivErsity: thE piEcEs that makE up lifE These indicators include species, ecological communities, ecosystem