Transcription
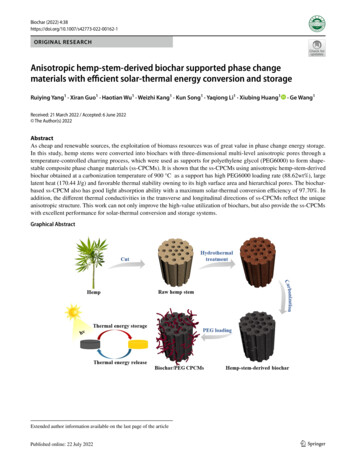
Biochar (2022) INAL RESEARCHAnisotropic hemp‑stem‑derived biochar supported phase changematerials with efficient solar‑thermal energy conversion and storageRuiying Yang1 · Xiran Guo1 · Haotian Wu1 · Weizhi Kang1 · Kun Song1 · Yaqiong Li1 · Xiubing Huang1· Ge Wang1Received: 21 March 2022 / Accepted: 6 June 2022 The Author(s) 2022AbstractAs cheap and renewable sources, the exploitation of biomass resources was of great value in phase change energy storage.In this study, hemp stems were converted into biochars with three-dimensional multi-level anisotropic pores through atemperature-controlled charring process, which were used as supports for polyethylene glycol (PEG6000) to form shapestable composite phase change materials (ss-CPCMs). It is shown that the ss-CPCMs using anisotropic hemp-stem-derivedbiochar obtained at a carbonization temperature of 900 C as a support has high PEG6000 loading rate (88.62wt%), largelatent heat (170.44 J/g) and favorable thermal stability owning to its high surface area and hierarchical pores. The biocharbased ss-CPCM also has good light absorption ability with a maximum solar-thermal conversion efficiency of 97.70%. Inaddition, the different thermal conductivities in the transverse and longitudinal directions of ss-CPCMs reflect the uniqueanisotropic structure. This work can not only improve the high-value utilization of biochars, but also provide the ss-CPCMswith excellent performance for solar-thermal conversion and storage systems.Graphical AbstractExtended author information available on the last page of the articlePublished online: 22 July 202213Vol.:(0123456789)
38 Page 2 of 15Biochar (2022) 4:38Highlights1. Anisotropic hemp-stem-derived biochar is used as supports of ss-CPCMs.2. Biochar-supported CPCMs show high PEG loading,latent heat and solar-thermal conversion efficiency.3. Biochar-supported CPCMs exhibit enhanced anisotropicthermal conductivity and durability.Keywords Biochar · Phase change materials · Anisotropic structure · Solar-thermal conversion1 IntroductionIn recent years, with the worldwide economic developmentand the environmental pollution and energy depletion causedby population expansion, improving energy efficiency hasattracted extensive attention. In order to alleviate the energycrisis, converting renewable solar energy into thermal energyand storing it for reuse has attracted extensive studies (Alvaet al. 2017; Tang et al. 2021). Latent heat thermal energystorage (LHTES) realizes thermal energy storage or releaseby phase change materials (PCMs) with the characteristicsof basically constant temperature and high energy storagedensity (Aftab et al. 2021), which have been widely usedin building (Rathore and Shukla 2021), greenhouse (Chenet al. 2018), solar energy storage (Shi et al. 2021), electronic devices (Tomizawa et al. 2016) and other fields. Inthis regard, organic solid–liquid PCMs are considered asone of the most promising PCMs because of their controllable phase change temperature, no obvious undercooling andphase separation, no corrosivity and low price (Umair et al.2019). Nevertheless, despite their promising applications,organic solid–liquid PCMs have some obvious shortcomings, including low thermal conductivity and easy leakageduring the melting process, which dramatically restrict theirpractical applications.To overcome these challenges, porous materials withlarge specific surface area, high porosity and good adsorption properties can be used as carriers for the preparationof shape-stable composite phase change materials (ssCPCMs) (Huang et al. 2019a, b; Yang et al. 2019). Thesurface tension, capillary forces and hydrogen bondingforces of the porous carriers can effectively restrain thePCMs in the pores (Li et al. 2021a, b). Up to now, variouskinds of porous materials such as metallic foams (Zhanget al. 2021a, b), graphene aerogel (Li et al. 2020a, b, c),mesoporous silicas (Li et al. 2022a), metal–organic frameworks (Wang et al. 2018) and expanded graphite (Yuanet al. 2021) have been reported as supports of ss-CPCMs.Especially, porous carbon materials have been widelyused to construct multifunctional ss-CPCMs because oftheir high PCM loading, high thermal conductivity and13extraordinary solar absorption ability (Chen et al. 2021).However, traditional porous carbon materials such as carbon nanotube, graphene oxide and graphene aerogel haveproblems including high price, complicated preparationprocess and environmental pollution (Tong et al. 2019;Yang et al. 2018). In the last few years, biomass-based orderived porous carbon materials have gained much attention in terms of their rich porous structures, wide sourceof raw materials and simple preparation processes (Gabhiet al. 2020; Huang et al. 2019b, a; Qiu et al. 2019).In terms of solar-thermal energy conversion and storage, the carbonization of biomass to biochar not only has arich porous structure, but also has increased graphitizationand good light absorption capacity, leading to improvedthermal conductivity as well as solar-thermal conversionefficiency of ss-CPCMs (Li et al. 2022b; Pan et al. 2021;Sarı et al. 2020; Umair et al. 2020). Zhao et al. preparedhoneycomb porous biochar from potatoes and radishesand the CPCMs using these as scaffolds were able to load85.36% of polyethylene glycol (PEG) (Zhao et al. 2018).Li et al. prepared ss-CPCMs with the melting enthalpyof 149 J/g based on three-dimensional spongy eggplantderived porous carbon and PEG (Li et al. 2020a, b, c).To enhance the thermal conductivity, Zhang et al. insteadcoated the surface of eggplant-based porous carbon withnano-Ag, which increased the thermal conductivity by40.9% compared to the CPCM without the nano-Ag particles (Zhang et al. 2021a, b). Atinafu et al. pyrolyzed wheatstraw at 550 C and subsequently loaded n-eicosane (ES)separately. However, only a 37.1% loading content of ESwith a melting enthalpy (75.0 J/g) was obtained (Atinafuet al. 2021). Therefore, compared with the reported vegetable-derived and other biomass-derived biochars withhigh price or low PCM load, the porous biochars preparedfrom biomass resources with rich source, low price andhigh PCM load are more in line with the needs of sustainable development. Taking good advantages of biowaste totransform it into high value-added products can not onlyalleviate the energy crisis and environmental pollution,but also increase the comprehensive benefits (Kung et al.2015, 2014a, 2014b; Li et al. 2020a, b, c).
Biochar (2022) 4:38Page 3 of 15 38Hence, in this study, anisotropic hemp-stem-derivedporous biochars were fabricated by hydrothermal carbonization, freeze-drying, and high-temperature carbonization. New biochar-based ss-CPCMs were preparedthrough vacuum impregnation method with carbonizedhemp stems (CH) and PEG6000 as raw materials. Withoptimal carbonization temperature at 900 C, the preparedss-CPCM simultaneously integrates good thermal reliability, high thermal energy storage density (170.44 J/g),excellent solar-thermal conversion efficiency (97.70%),and improved thermal conductivity. Meanwhile, the radialand longitudinal heat transfer capabilities of ss-CPCMsdemonstrate the anisotropic thermal conductivity path.This research takes full advantages of the porous structure of hemp stems as well as their renewable nature todevelop a green path for solar-thermal energy conversion and storage. This also provides new approaches tobroaden the high-value utilization of biomass-derivedbiochars in thermal energy storage.2.3 Preparation of CH/PEG ss‑CPCMs2 Materials and methods2.4 Characterizations2.1 MaterialsThe structural morphology of the products was characterized by scanning electron microscopy (SEM, SU8000,Japan Hitachi) and TEM (JEM-2100F). Raman spectroscopy (Finder Vista) was applied to analyze the degree ofgraphitization of CH. The pore size distribution and porestructure parameters of the CH were measured using anautomatic mercury injection apparatus (USA Mack corporation Auto Pore IV 9510). The specific surface area ofbiochars was obtained on a TriStar II 3020 (MicromeriticsIntrument Corporation, USA) at 77 K. X-ray photoelectronspectroscopy (XPS) (ESCALAB 250Xi instrument) wasapplied to study the composition and binding energy of theCH. X-ray diffractometry (XRD, M21X, Cu Ka radiation,λ 1.541 Å) was employed for the analysis of the phasestructure and chemical compatibility of samples. Fouriertransform infrared spectroscopy (FTIR, Nicolet 6700 bythe KBr pellet technique) was performed in the wave number range 500–4000 cm 1 to evaluate the chemical compatibility of the samples. Thermogravimetric analysis (TGA)was obtained on a thermogravimetric analyser (NetzschSTA449F, Germany), heated at a rate of 10 C/min from 40to 800 C under N2 atmosphere. The thermal properties ofPEG6000 and ss-CPCMs were studied by differential scanning calorimetry (DSC, Q2000). The thermal conductivityof the composite phase change material was measured usinga laser thermal conductivity meter (NETZSCH LFA 467).The thermal management capability of CPCMs was visualized using a thermal imaging camera FLIR ONE Pro.The raw hemp stem was purchased from Taobao E-Shop.PEG with an average molecular weight of 6000 wasprovided by Shanghai Yuanye Biotechnology Co. Ltd.(Shanghai, China). All other chemical regents used wereof analytical grade and were not further purified.2.2 Preparation of carbonized hemp stemsThe hemp-stem-derived biochars with hollow porous scaffold were synthesized by simple carbonization process, asshown in Fig. 1. Specifically, the hemp stem was dividedinto about 3 cm sections and moved to a Teflon-linedautoclave, which was left in a 180 C oven setting for10 h. After hydrothermal carbonization samples werewashed several times to remove surface impurities, thenfrozen in liquid nitrogen and dried in a freeze dryer for72 h. Afterwards, the dewatered hemp stem segmentswere carbonized in a tube furnace at different temperatures (600, 700, 800, 900, 1000 C) for 1 h under a flowing nitrogen atmosphere at a heating rate of 2 C/min.The samples were naturally cooled to room temperature toobtain carbonized hemp stems (CH), which were markedas CH-600, CH-700, CH-800, CH-900 and CH-1000,respectively.As shown in Fig. 1, the ss-CPCMs were prepared by vacuum impregnation method using CH and PEG6000 as rawmaterials. At first, CH scaffolds with different carbonationtemperatures were placed into a centrifuge tube separatelywith an excess of PEG6000 solid, where PEG6000 waslocated on top of CH. Thereafter, the centrifuge tubes wereplaced in a vacuum drying oven at 80 C and held for4 h to allow the molten PEG to penetrate into the poresof CH. After vacuum impregnation, the samples werefirst transferred to filter paper and then transferred into ablast drying oven at 80 C to get rid of the surplus PEGfrom the surface of CH. The filter paper was repeatedlychanged until no molten PEG leaked. The obtained CH/PEG ss-CPCMs using CH obtained at different carbonization temperatures were named as CPCM-600, CPCM-700,CPCM-800 CPCM-900 and CPCM-1000, respectively. Asa control, the uncarbonized hemp stem loaded with PEGwas labeled as CPCM-0.13
38 Page 4 of 15Biochar (2022) 4:38Fig. 1 The schematic diagram for preparation of CH/PEG ss-CPCMs3 Results and discussion3.1 Production and characterization of porouscarbon scaffoldsThe morphological structure of the hemp-stem-derived biochar was recorded by SEM and TEM. From the cross-sectionof CH (Fig. 2a–e), CH exhibited a porous skeleton structurewith distributed pores of different sizes inside, preservingthe original porous structure of hemp rods. The porous structure was formed by 5–20 μm small pores around 30–50 μmlarge circular pores like a honeycomb. With the increasingcarbonization temperature, the pore size decreased and thepore distribution became more uniform. CH-900 showed thesmallest pore size, more regular pore distribution and thinnerpore walls. This was owing to the fact that high temperaturesfavor the decomposition of cellulose, hemicellulose andother invaginations, resulting in a more developed porousarchitecture (Song et al. 2020). However, as the carbonization temperature increased to 1000 C, part of the porousstructure was destroyed, indicating that the pyrolysis temperature has an important effect on regulating the morphologyand porous structure of biochar (Atinafu et al. 2021; Songet al. 2020; Tan et al. 2016). From the longitudinal sectionof CH (Fig. 2g), it can be observed that the pore channel wasnearly through along the growth direction of the hemp rods.Meanwhile, the walls were distributed with circular holes13of 1–2 μm diameter (Fig. 2f, h). Figure 2i shows that somenanopores are also present on the inner and outer surfacesof CH-900. The pores in the wall increased the interconnectivity of the pore channels, which would be favorable toenhance the specific surface area and porosity of CH (Panet al. 2021; Zhou et al. 2021). All the above results indicatethat a multi-level porous structure exists in the resulting biochars, which is beneficial to encapsulate PCM.Figure 3 presents the pore size distribution curves ofhemp stem-derived porous biochars carbonized at differenttemperatures measured by MIP. Table 1 summarizes theporous structure parameters of carbonized hemp stems atdifferent temperatures. CH was mainly composed of twosizes of large pores with pore sizes ranging from 100 nmto 10 μm and from 15 to 50 μm, respectively. When thecharring temperature of CH was increased from 600 to900 C, the specific surface area increased from 443.58 to542.25 m2/g. The average pore size of CH decreased slightlywith the increase of carbonization temperature because ofthe decomposition of some of its components (such as thelignin, cellulose and hemicellulose) at high carbonizationtemperatures. The higher the carbonization temperatureis, the more the porous structure shrinks, and the pore sizealso decreases (Oginni and Singh 2020). The average porosities of CH-600 to CH-900 were 88.33%, 88.09%, 87.55%,and 87.51%, which revealed that the hemp stem-based biochar contained a rich porous structure. In contrast, further
Biochar (2022) 4:38Page 5 of 15 38Fig. 2 SEM images of cross sections of a CH-600, b CH-700, c CH-800, d CH-900, e CH-1000 and g, h vertical sections of CH-900; TEMimages of f, i CH-900increasing the carbonization temperature to 1000 C led tothe obviously decreased specific surface area (144.17 m2/g)and slightly reduced porosity (83.43%) of CH-1000, corresponding to the disrupted structure of CH-1000 in the SEMimage. In general, CH has wide pore size range and highporosity, which is beneficial to enhance the loading rate ofPCM and prevent its leakage.The surface chemical composition of CH-900 was analyzed by XPS, as shown in Fig. 4a-b. The XPS spectrum ofCH-900 (Fig. 4a) shows two peaks at 283.8 and 534.6 eV,corresponding to C 1 s and O 1 s, respectively, where thecontent of C element is much higher than that of O element(Kim et al. 2022). In the deconvoluted C 1 s XPS spectra ofCH-900 (Fig. 4b), the main peak located at a binding energyof 284.8 eV corresponds to the sp2 C C/C–C bond whilethese peaks with binding energies of 285.7 and 289.1 eVcan be assigned to the C–O and O–C O bands, respectively(Peng et al. 2017).FT-IR spectroscopy was used to characterize the surface functional groups in these carriers. Absorption peakswere observed at 1094, 1419, 1620, 2920 and 3420 cm 1for biochars (Fig. 4c). The absorption peak near 1094 cm 1Fig. 3 Aperture distribution curves of CH-600, CH-700, CH-800,CH-900 and CH-1000was caused by the stretching vibration of C–O, C–C or thebending vibration of C–OH. The absorption peaks around1419 and 1620 cm 1 correspond to the C O stretching13
38 Page 6 of 15Biochar (2022) 4:38Table 1 Microstructural parameters of the hemp-stem-derived porousbiocharsSampleSpecific surfacearea (m2 g 1)Average porediameter (μm)Porosity 7.5183.43vibration, which indicate the presence of a great deal ofoxygen-containing functional groups on the carbon material.The strong absorption peak at 3420 cm 1 is the characteristic peak corresponding to hydroxyl O–H. It means thatthe porous biochar is rich in –OH, which is mainly derivedfrom the hydroxyl groups of carboxylic acids and phenols.In summary, these results show that the hemp stem-derivedbiochars are an abundant source of oxygen-containing acidicfunctional groups. XRD was applied to analyze the crystallization properties of hemp stem-derived biochars. As shownin Fig. 4d, all these biochars present two characteristic peaksat 22 and 43 , which correspond to the (002) and (101)crystal planes of graphite crystals, respectively. These twobroad diffraction peaks indicate that the main component ofthe hemp stem-derived biochars is amorphous carbon afterhigh temperature pyrolysis.To further investigate the degree of graphitization of CH,the prepared biochars were analyzed by Raman spectroscopy. In Fig. 5a, there are two distinct peaks near 1350 cm 1(D band) and 1580 cm 1 (G band). The D-band was causedby the disorder of the defective graphite structure of thebiochar. The G-band, in turn, represented the degree of graphitization of biochar, arising from the sp2 hybridization ofcarbon atoms in the graphite lamellar structure. The intensity ratio ( ID/IG) between the D-band and G-band indicatesthe defect density and the degree of graphitization of carbonmaterials. A smaller ratio indicated a lower degree of defectand disorder and a higher degree of graphitization in thecarbon materials (Zhang et al. 2017, 2019). By analyzingthe Raman spectra of CH pyrolyzed at different temperatures(Fig. 5b–f), it was found that the ID/IG values of biocharswere all close to 1.15, showing the presence of graphiticcarbon and disordered carbon. Theoretically, the extent ofgraphitization of carbon materials was positively correlatedwith the heat treatment temperature. However, raising thecarbonization temperature would also introduce more porousstructures in CH and increase the number of defects, thusincreasing the disorder of the carbon fraction. Thus, the ID/IGvalues of CH were obtained by two mechanisms that checkand balance each other (Guo et al. 2016). As a result, the13prepared biochars were amorphous structural carbon with acertain degree of graphitization.3.2 Morphology and structure of CH/PEG CPCMsThe CPCM-600, CPCM-700, CPCM-800, CPCM-900 andCPCM-1000 were morphologically characterized withSEM. The cross and longitudinal sections of the CPCMsrevealed that the multistage porous structure of CH wasalmost filled with PEG6000 (Fig. 6). Waxy PEG6000was attached to both the duct and striatal surfaces of CH,and no obvious interface between PEG6000 and CH wasnoticed. Due to the capillary force and interfacial tension,CH can firmly adsorb and confine PEG6000 in its hierarchical pore channels. The presence of strong hydrogenbonds between biochar and PEG6000 further enhances thestability of PEG6000. The tight integration of PEG6000and biochar could successfully prevent the leakage ofPEG6000 under molten state.To illustrate the physical and chemical interactions ofCH and PEG6000 in the composites, pure PEG6000 andCPCMs were characterized through XRD and FT-IR. Asshown in Fig. 7a, pure PEG6000 showed well-defined peaksat 19.0 and 23.0 . The characteristic peaks of CPCMs werebasically the same as those of pure PEG6000, and no newpeaks appeared, indicating that the crystal structure ofPEG6000 did not change before and after impregnation andthere was only physical adsorption between PEG6000 andCH. Figure 7b shows the FT-IR spectrum of PEG6000 andCPCMs. The peaks at 3445 and 1112 cm 1 correspond tothe characteristic peaks of the stretching vibrations of –OHand C–O of PEG6000, respectively. The absorption peaksat 2887, 1468, 1342, 963, and 832 cm 1 were accounted forC–H stretching and bending oscillations. No new absorption peaks were found in CPCMs, demonstrating that therewas only physical interaction between CH and PEG6000 bysurface tension, capillary interaction and possible hydrogenbonding. In addition, the XRD patterns and FT-IR spectrumof the biochar-based CPCMs were not significantly variedexcept for a slight variation in the intensity.3.3 Thermal performance of CH/PEG CPCMsIn order to analyze the thermal stability and pyrolysis behavior of CPCMs, thermogravimetric analysis was performed.Figure 8 shows the TGA curves of PEG6000 and CPCMsunder flowing N2. There is a one-step thermal degradationin the TGA curve of pure PEG6000, which can be attributedto the breakage of the PEG molecular chain. The decomposition of PEG6000 starts at 350 C, and the maximum rateof weight loss is at 390 C. When the temperature reaches420 C, PEG6000 decomposes almost completely. Theabsence of significant weight loss in CPCMs under 350 C
Biochar (2022) 4:38Page 7 of 15 38Fig. 4 a XPS survey and b high-resolution C 1 s spectrum of CH-900, c FT-IR spectra and d XRD patterns of CH-600, CH-700, CH-800,CH-900 and CH-1000indicates that CPCMs have good thermal stability below350 C. It can be observed that CPCMs exhibited similarthermal stability to that of PEG6000. Though the mass lossof the CPCMs was mainly from the thermal decompositionof PEG6000, the onset of decomposition temperature wasslightly higher than that of PEG6000, which is probablyowing to the limited movement of PEG6000 within the biochars. As a whole, CPCMs have good thermal stability upto 350 C, which is far beyond the working temperature ofss-CPCMs and is beneficial to their practical applications.The DSC curves of PEG6000, CPCM-600, CPCM-700,CPCM-800, CPCM-900 and CPCM-1000 during meltingand cooling are shown in Fig. 9a-b. The correspondingphase change parameters of PEG6000 and CPCMs are listedin Table 2. These CPCMs and pure PEG6000 have similarDSC curves. Nevertheless, the melting temperatures (TM)of CPCMs are slightly higher than that of pure PEG6000,which may be attributed to the strong physical adsorption ofPEG6000 within biochars through capillary interaction andinterfacial tension. The confining effect of the porous structure of CH on PEG6000, and the hydrogen bonding interactions between the biochars and PEG6000 also hinderedthe thermal diffusion movement of PEG molecular chainsegments. These factors together slowed down the phasetransition process of confined PEG6000 from the crystallineto the amorphous state in CPCMs (Cao et al. 2022). Theslightly lower solidification temperatures (TS) of CPCMscompared to pure PEG6000 can be due to the restrictionof PEG molecular chain movement by the porous carbonnetwork, which in turn limits the crystallization process andleads to a reduction of crystallization segments (Wang et al.2019). It could be seen from Table 2 that the melting enthalpies (HM) and solidifying enthalpies (Hs) of CPCMs are bothreduced compared to that of pure PEG6000. The melting13
38 Page 8 of 15Biochar (2022) 4:38Fig. 5 Raman spectra of CH: a general figure, b CH-600, c CH-700, d CH-800, e CH-900, and f CH-1000enthalpies of CPCMs first increased from 166.80 J/g ofCPCM-600 to 170.44 J/g of CPCM-900 and then decreasedto 164.97 J/g of CMCM-1000 with the increase of carbonization temperature, which were consistent with the trendof their porous structures. Moreover, the melting enthalpiesof CPCMs were generally higher than their correspondingsolidifying enthalpies, which could account for the limitedpre-crystallization of some PEG molecular chains adhering to the surfaces of the carrier in the solidifying process(Atinafu et al., 2021). The loading rate φ of CPCMs can becalculated according to Eq. (1):𝜑 m m0m(1)where m is the mass of CPCMs and m0 is the mass ofCH. The loading rates of PEG6000 in CPCM-600, CPCM700, CPCM-800, CPCM-900 and CPCM-1000 were calculated to be 87.75wt%, 87.51wt%, 87.88wt%, 88.62wt% and87.79wt%, respectively. The percent impregnation mass ofPEG6000 varies due to the structure of the charred hempstems themselves. In the present work, the melting enthalpyof CPCM-900 was as high as 170.44 J/g and the loadingof PEG6000 was 88.62wt%. Compared with the previouslyreported biomass-based CPCMs (Table 3), the specific surface area of CH-900, the melting enthalpy and loading ratioof PEG in CPCM-900 in this work are relatively higher.Based on the above analysis, it could be concluded that13the CPCM with CH as the support has good heat storagecapacity.The thermal conductivities of pure PEG6000, lateralCPCM-900 and radial CPCM-900 were measured becausethe pores of CH-900 were grown in a directional manner(Fig. 9c). Compared with the thermal conductivity (0.26 W/mK) of pure PEG6000, the thermal conductivities of CPCM900 were improved to 0.29 W/mK in the lateral direction and0.32 W/mK in the radial direction, which can be attributed tothe accelerated heat transfer in the composites by the interconnected carbon skeleton and pore channels of CH. However, the enhancement of the thermal conductivity of theCPCM-900 was slight, which was mainly caused by the highloading of PEG6000. Interestingly, the thermal conductivityof CPCM-900 in the radial direction was higher than thatin the lateral direction, which is consistent with the porousstructure of the CH directional growth. As a result, CH withinterconnected hierarchical porous structures could not onlyact as a support material for encapsulating PCM, but alsoprovide efficient heat transfer channels.Thermal cycling stability is another essential feature ofss-CPCMs for practical applications. The thermal reliability of CPCM was investigated by conducting 50 meltingsolidifying cycle tests on CPCM-900. As can be seen fromthe DSC curves before and after cycling (Fig. 9d), the DSCcurves of CPCM-900 before and after the 50 cycles almostoverlap. Despite a slight decrease in the enthalpy of phasechange after 50 cycles, the slight change could be negligible
Biochar (2022) 4:38Page 9 of 15 38Fig. 6 SEM images ofcross sections of a CPCM-600,c CPCM-700, e CPCM-800,g CPCM-900 and i CPCM1000; and vertical sections ofb CPCM-600, d CPCM-700, fCPCM-800, h CPCM-900 and jCPCM-100013
38 Page 10 of 15Biochar (2022) 4:38Fig. 7 a XRD patterns and b FT-IR spectra of PEG6000, CPCM-600, CPCM-700, CPCM-800, CPCM-900 and CPCM-1000Table 2 Phase change parameters of pure PEG6000 and CPCMsSamplePEG PCM-80087.88CPCM-90088.62CPCM-1000 87.79Fig. 8 TGA curves of PEG6000 and CPCMscompared to the high latent heat of CPCM-900. All theabove analysis revealed that the prepared ss-CPCMs couldwell keep their phase change characteristics and excellentthermal reliability, which could meet the requirements oflong-term cycling stability in practical applications.The solar-thermal conversion performance of theseCPCMs was measured using a system consisting of a Xenonlamp light source simulating sunlight, an infrared thermometer, a temperature logger, and a computer (Fig. 10a).Firstly, the sample was placed under Xenon lamp irradiationand the temperature change on its surface was measuredin real time by an infrared temperature probe to obtain thetime–temperature curve (Fig. 10b). During the first 120 s,the temperature of CPCMs increased rapidly to 55 C. Atemperature plateau appeared in the range of 55–65 C and13Melting processSolidifyingprocessTM ( ) HM(J g-1)TS ( ) HS(J 183.47166.92164.41163.60163.86161.81lasted for about 200 s, indicating that the heat absorbed byCPCM caused the phase change of PEG6000 at this time.The CPCMs could also store more solar energy, which enabled the CPCMs to reach a maximum temperature of 94 C.When the light source was turned off, the temperature beganto drop rapidly. Once it dropped to about 48 C, a coolingplateau appeared, demonstrating that the PEG6000 in theseCPCMs was continuously releasing heat to prevent its temperature from decreasing, which can be used to regulate thesurrounding ambient temperature and thus reduce energyconsumption. Based on the physical data of CPCMs and thetime–temperature curve, the solar-thermal energy conversionefficiency η can be calculated according to Eq. (2):𝜂 mΔHm()rs Tt Tf(2)where m is the mass of the sample, ΔHm is the meltingenthalpy of CPCM, r is the light intensity of simulated sunlight, s is the area of the sample exposed to light, Tt and
Biochar (2022) 4:38Page 11 of 15 38Fig. 9 DSC curves of PEG6000, CPCM-600, CPCM-700, CPCM-800, CPCM-900, CPCM-1000 during heating (a) and cooling (b); (c) Thermal conductivity of the samples; (d) DSC curves before and after 50 cycles of CPCM-900Fig. 10 The solar-to-thermal energy conversion and storage: a The schematic of the measuring system, b Solar-to-thermal conversion curves ofCPCMs13
38 Page 12 of 15Biochar (2022) 4:38Table 3 Comparison of the thermal properties of the prepared ss-CPCMs and the biomass-based CPCMs previously reported in the literaturesCPCMsMax. ratio (wt%)HM (J g-1)Specific surface area (m2 g 1)ReferencesPEG/wood flourPFG/towel gourd porous carbonPEG/carbonized potatoPEG/pomelo peel foamPEG/balsa woodPEG/carbonized diatomPEG/eggplants-derived porous 155.9–542.25Liang et al. (2019)Song et al. (2020)Tan et al. (2016)Sheng et al. (2020)Meng et al. (2020)Wu et al. (2021)Li et al. (2020a, b, c)This workFig. 11 a Radial and b lateral thermal transfer schematic diagrams of CPCMs, c radial and d lateral thermal transfer T–t curves per unit lengthCPCMsTf correspond to the time of the start and end of the phasetransition. The calculated η for CPCM-600, CPCM-700,CPCM-800, CPCM-900 and CPCM-1000 was 95.93%,96.68%, 97.33%, 97.70% and 9
tion temperatures were named as CPCM-600, CPCM-700, CPCM-800 CPCM-900 and CPCM-1000, respectively. As a control, the uncarbonized hemp stem loaded with PEG was labeled as CPCM-0. 2.4 Characerizat tions The structural morphology of the products was charac-terized by scanning electron microscopy (SEM, SU8000, Japan Hitachi) and TEM (JEM-2100F).