Transcription
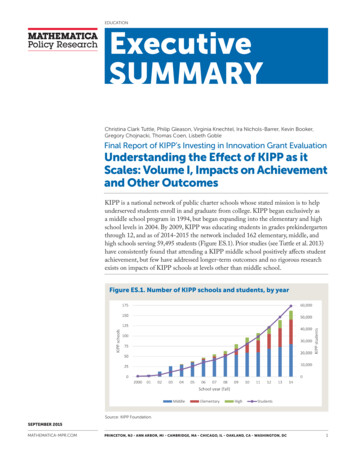
EDUCATIONExecutiveSUMMARYChristina Clark Tuttle, Philip Gleason, Virginia Knechtel, Ira Nichols-Barrer, Kevin Booker,Gregory Chojnacki, Thomas Coen, Lisbeth GobleFinal Report of KIPP’s Investing in Innovation Grant EvaluationUnderstanding the Effect of KIPP as itScales: Volume I, Impacts on Achievementand Other OutcomesKIPP is a national network of public charter schools whose stated mission is to helpunderserved students enroll in and graduate from college. KIPP began exclusively asa middle school program in 1994, but began expanding into the elementary and highschool levels in 2004. By 2009, KIPP was educating students in grades prekindergartenthrough 12, and as of 2014-2015 the network included 162 elementary, middle, andhigh schools serving 59,495 students (Figure ES.1). Prior studies (see Tuttle et al. 2013)have consistently found that attending a KIPP middle school positively affects studentachievement, but few have addressed longer-term outcomes and no rigorous researchexists on impacts of KIPP schools at levels other than middle school.Figure ES.1. Number of KIPP schools and students, by yearSource: KIPP Foundation.SEPTEMBER 2015MATHEMATICA-MPR.COMPRINCETON, NJ - ANN ARBOR, MI - CAMBRIDGE, MA - CHICAGO, IL - OAKLAND, CA - WASHINGTON, DC1
As the KIPP network continues to grow, it facesthe challenge of building a pipeline of leaders toeffectively serve more students and schools. In2010, the KIPP Foundation was awarded a fiveyear, 50 million Investing in Innovation (i3)scale-up grant by the U.S. Department of Education. The foundation used the i3 grant to scaleup its network with the aim of sustaining KIPP’spositive impacts—specifically by bolstering itsleadership pipeline—while doubling the numberof students served from 27,000 to over 55,000by 2015. The KIPP Foundation contracted withMathematica Policy Research to conduct anindependent evaluation of its success in improving student outcomes on a larger scale under thei3 scale-up grant. This study builds on two priorreports published by Mathematica (Tuttle et al.2010, Tuttle et al. 2013), and is the first rigorousresearch to examine the impacts of KIPP schoolsat all three grade levels.The key evaluation objective is to measure theimpact of KIPP on student outcomes as the network scales up the number of schools, students,and grades served. To do this, we use a combination of lottery-based and quasi-experimentaldesigns in a set of 8 elementary, 43 middle, and 18high schools in 20 cities (Figure ES.2), employingthe most rigorous study designs possible at eachschool level. Under different designs and samples,we measure KIPP’s impacts on outcomes up tofour years after students enter a KIPP school.The analysis uses data from study-administeredstudent achievement tests; state assessments inmath, English/language arts (ELA), science, andsocial studies; and student and parent surveys.Figure ES.2. Location of KIPP schools in the studyNetwork-wide, KIPP schools have positive, statistically significant, and educationally meaningful impacts on student achievement, particularlyat the elementary and middle school grades. Wefind that KIPP elementary schools have positiveimpacts on students’ reading and math achievement. KIPP middle schools, meanwhile, havemaintained a pattern of positive and significantimpacts on reading and math over the lastdecade, even as the network has grown rapidly.While average impacts across the middle schoolsin the network declined somewhat since 2007,they stabilized during the i3 scale-up period.Moreover, the KIPP middle schools that haveopened most recently—during the i3 scale-upperiod beginning in fall 2011—are producingpositive impacts that are generally similar tothose produced by older KIPP middle schoolswhen they were in their first years of operation.KIPP high schools have positive, statistically significant, and educationally meaningful impactson achievement for new entrants to the network.For students continuing from KIPP middleschools, the marginal impacts of having theoption to attend a KIPP high school were notstatistically significant, on average (in comparison to students who did not have the option toattend a KIPP high school and instead attendeda mix of other non-KIPP charter, private, and2
traditional public high schools). Among thesecontinuing students, KIPP high schools havepositive impacts on several aspects of collegepreparation, including more discussions aboutcollege, increased likelihood of applying to college, and more advanced coursetaking.Across grade levels, we generally find no impactsof KIPP schools on measures of students’ motivation, engagement, educational aspirations, orbehavior, but positive impacts on the satisfactionof parents with their child’s school.We describe these findings in more detail below.WHAT ARE THE IMPACTS OFKIPP ELEMENTARY SCHOOLS ONSTUDENT ACHIEVEMENT?To measure impacts of KIPP elementary schools,we use a research design that uses school admissions lotteries as randomized experiments. Thistype of randomized design is the “gold standard”for research measuring the impacts of schools onstudent achievement. Students offered admissionvia the lottery are included in the treatment group;those not offered admission through the lottery(and enroll at other charter, private, or traditionalpublic preschools or elementary schools) areincluded in the control group. This design ensuresthat treatment and control group students are similar at baseline (pre-KIPP) in terms of demographics and academic preparation as well as key factorssuch as motivation and parental support.We used admissions lotteries for the 2011–2012school year to measure the impacts of eightKIPP elementary schools. These schools makeup 28 percent of KIPP elementary schools inoperation in 2011–2012. To measure elementaryschool students’ academic achievement in readingand math, we administered the WoodcockJohnson III (WJ-III) assessment in the spring ofthe third follow-up year after the lottery, whenmost students who applied to pre-kindergartenat age 3 (PK3) were in kindergarten, and mostwho applied to kindergarten were in grade 2.KIPP elementary schools have positive,statistically significant, and educationallymeaningful impacts on three of fourmeasures of students’ reading andmathematics skills. On tests administeredthree years after entry, being offered admission toa KIPP elementary school leads to an increase of0.25 standard deviation units on the Letter-WordIdentification test and 0.22 on the Passage Comprehension test in reading (Figure ES.3). Theseimpacts are equivalent to boosting a student’sLetter-Word Identification score from the 78thpercentile (the percentile corresponding to thecontrol group students’ mean score) to the 84thpercentile, and boosting the Passage Comprehension score from the 48th to the 57th percentile. Inmath, being offered admission to a KIPP elementary school has a positive and statistically significantimpact on students’ Calculation score of 0.28,equivalent to an increase from the 58th to the 68thpercentile. The impact on the Applied Problemsscore is smaller and not statistically significant.Figure ES.3. KIPP elementary school achievement impactsNotes: Model: Lottery-based design. Outcome: Woodcock-Johnson III Test. Sample size: eight schools; 654 students.Statistically significant at the 0.05 level (*) or 0.01 level (**), two-tailed test.3
WHAT ARE THE IMPACTS OF KIPPMIDDLE SCHOOLS ON STUDENTACHIEVEMENT?We use two different approaches for measuringthe impacts of KIPP middle school on studentoutcomes: the lottery-based design described abovein sufficiently oversubscribed KIPP middle schoolsand a matched-student design in a broader set ofKIPP middle schools. In the matched-studentdesign, we identify a treatment group of studentswho enter KIPP middle schools in grade 5 or 6 anduse propensity-score matching to define a comparison group of students—not attending KIPP—whomost closely “match” the treatment group in terms ofdemographic characteristics and baseline test scores.This approach has been previously validated usinglottery-based results (Tuttle et al. 2013; Fortson etal. 2015) and allows us to include as many KIPPmiddle schools as possible in our sample. In bothdesigns, the comparison group comprises studentsattending other charter or traditional public schools.Across the lottery-based and matched-studentdesigns, our middle school sample includes 43schools (53 percent of all KIPP middle schools inoperation in 2014–2015), including 7 of 21 newKIPP middle schools that opened during the scaleup period. For both designs, we measured academicachievement scores on statewide assessmentsdrawn from state- or district-provided administrative records. Students’ scores were standardized(converted into z-scores) using statewide meansand standard deviations, so scores represent students’achievement level relative to the typical studentin the state at their grade level. We collected testscore outcomes corresponding to the first threeyears after the lottery for the lottery-based sample,and the first four years after the treatment groupentered KIPP for the matched-student sample.Consistent with prior research, KIPPmiddle schools have positive, statistically significant, and educationallymeaningful impacts in math, reading,science, and social studies. Based on bothstudy designs, KIPP middle schools have positiveand statistically significant impacts on students’state test scores in both math and reading, by thesecond year after students are admitted (FigureES.4). For example, the lottery-based designsuggests that being admitted to a KIPP middleFigure ES.4. KIPP middle school achievement impactsNotes: Model: Lottery-based and matched-student designs. Outcome: State test scores. Sample size: 15 schools, 608students (lottery-based); 37 schools, 36,798 students (matched-student). Statistically significant at the 0.05 level (*) or0.01 level (**), two-tailed test.4
school leads to an increase in students’ averagemath score of 0.24 student standard deviationunits after two years, equivalent to a studentmoving from the 40th to the 50th percentile inthe state. The two-year reading impact of 0.18 isequivalent to a student moving from the 37th tothe 44th percentile. The impact estimates fromthe matched-student design are similar for alarger sample of 37 schools, suggesting that KIPPmiddle schools lead to an increase in averagemath scores of 0.23 standard deviations andreading scores of 0.10 standard deviations. Thematched-student design also suggests that, onaverage, KIPP middle schools have a positive andstatistically significant impact of 0.25 standarddeviations in both science and social studies (notshown in the figure), equivalent to moving theaverage student from the 48th percentile to the58th percentile in science and from the 51st tothe 61st percentile in social studies.ARE THE PREVIOUS POSITIVEIMPACTS IN KIPP MIDDLE SCHOOLSMAINTAINED WITHIN THE LARGERNETWORK AS IT SCALES?Across the KIPP network, the averageimpacts of middle schools were positiveand statistically significant throughoutthe 10-year period for which we havedata, though higher in earlier yearsthan recent years. To examine changes inthe effectiveness of the network over time, wefocus on trends in the impacts of KIPP middleschools, since the network has always includedmiddle schools, and added elementary and highschools only in recent years. We calculate theaverage impact for each KIPP middle school ineach school year, using the results for studentstwo years after KIPP entry. KIPP middleschools have positive and statistically significantimpacts in both math and reading for all yearsfrom 2005 to 2014. Impacts were largest in 2007and earlier, especially in math, ranging from 0.38to 0.50 standard deviations, compared with 0.16to 0.30 between 2008 and 2014. In 2013 and2014, when these two-year impacts fully reflectthe performance of KIPP schools during thescale-up period, math impacts are 0.22 and0.24, respectively.Several factors may explain the trends in KIPPmiddle school impacts, including changes in thenumber and composition of schools in the sample,the relative performance of newer versus olderschools, and changes over time in the effectiveness of existing KIPP schools as the network hasexpanded. Overall, KIPP’s student achievementimpacts decreased during a time of high growth inthe network, although they rebounded somewhatduring the i3 scale-up period (Figure ES.5).Figure ES.5. Change in the size of the KIPP network and middleschool impacts over timeNotes: Impact estimates are the cumulative two-year impact of KIPP on students who enrolled in any of the KIPP middleschools in the school records data provided to the study. Impacts are calculated by comparing the outcomes of thesetreatment students to a set of matched comparison students with similar baseline (grade 4) achievement profiles anddemographic characteristics. Impact estimates are calculated separately for each KIPP school; the average impactestimates reported here assign an equal weight to each of the school-level impact estimates. They are estimated separatelyby school year and plotted using the left-side y-axis. All impacts are statistically significant at the 0.01 level. The year refersto the spring semester of the school year when the achievement exams were taken. The size of the KIPP network is plottedagainst the right-side y-axis. MS middle schools.5
In fact, the newer KIPP middle schools in ourmatched student analysis—those opened duringthe i3 grant period (fall 2011 or later)—havepositive impacts on math and reading achievement that are of a similar magnitude of thoseof the overall impacts for middle schools acrossthe entire study period. When we compare theperformance of schools opened during different periods in KIPP’s history, we find that theschools opened during the scale up period haveimpacts that are not quite as large as the oldestKIPP schools (those opened by 2005), but largerthan those opened during the period from 2006to 2010 (Figure ES.6).Figure ES.6. Impacts of KIPP middle schools on students two yearsafter enrolling, by year opened************Notes: Impact estimates are the cumulative two-year impact of KIPP on students who enrolled in any of the KIPP middleschools in the school records data provided to the study, based on the year the school opened. Statistically significant atthe 0.05 level (*) or 0.01 level (**), two-tailed test.WHAT ARE THE IMPACTS OF KIPPHIGH SCHOOLS ON STUDENTACHIEVEMENT?Since students enter KIPP high schools viatwo routes—from KIPP middle schools andnon-KIPP middle schools—we use differentquasi-experimental designs to measure impactson the two groups of students. For the one-thirdof KIPP high-school students who enteredthe KIPP network for the first time in grade9, we use a matched-student design similar tothat described above for middle schools. Weidentify a comparison group for these newentrants, based on demographic characteristicsand baseline test scores from grades 7 and 8, ofstudents who attend other charter or traditionalpublic high schools. For the two-thirds of KIPPhigh school students who also attended a KIPPmiddle school, we use a matched-school design,comparing outcomes for KIPP middle schoolstudents who had the option to attend a KIPPhigh school with outcomes for a similar set ofKIPP middle school students who did not havethis option. Whether or not students have theoption to enter a KIPP high school depends onthe location and timing of their enrollment inKIPP middle schools—in some places and years,the KIPP high school option is present and inothers it is absent. Students who do not attenda KIPP high school enroll in a variety of otherhigh schools, including other charter, private,magnet, or boarding schools, in addition to theirtraditional public school options. This designassumes that aside from the presence/absence ofthe KIPP high school option, the treatment andcomparison groups are similar, on average.We include 14 KIPP high schools in ourmatched-student analysis of new entrants and8 high schools in our matched-school analysisof continuing KIPP students; 4 high schools areincluded in both designs. Across designs, thehigh school sample includes 82 percent of allKIPP high schools in operation in 2014–2015.We measure student achievement outcomesusing state assessments for the analysis ofimpacts on new entrants. For the analysis ofimpacts on continuing KIPP students, state testscores are less consistently available, because6
many in the comparison group were attendingprivate high schools or public schools outsidethe jurisdictions providing data. We thereforemeasure achievement in the analysis of continuing KIPP students by administering a TerraNovaassessment in the third follow-up year after highschool entry (typically grade 11).For new entrants to the network, KIPPhigh schools have positive, statisticallysignificant, and educationally meaningful impacts on achievement in math,ELA, and science. Having the opportunity toattend a KIPP high school boosts new entrants’high school math scores by 0.27 standarddeviation units, a statistically significant impactrepresenting an increase from the 48th to the59th percentile for the typical student (FigureES.7). Impacts in ELA and science are 0.18and 0.31 standard deviations, respectively, andare also significant. Relative to outcomes forthe matched comparison group, these impactsare equivalent to an increase from the 47th tothe 54th percentile in ELA and from the 42ndto the 54th percentile in science. The averageimpact in social studies (0.01) is close to zeroand not statistically significant. The magnitudeof the impact on graduation after four years ispositive (four percentage points, not shown),but also not statistically significant.Figure ES.7. KIPP high school impacts for new entrantsNotes: Model: Matched-student design. Outcome: State test scores. Maximum sample size: 14 schools; 1,861 students.Statistically significant at the 0.05 level (*) or 0.01 level (**), two-tailed test.For students continuing from KIPP middleschools, the achievement impacts of KIPPhigh schools are not statistically significanton average, but these impacts vary byschool. For continuing students (compared withKIPP middle school graduates without access to aKIPP high school), the average impacts of KIPPhigh schools on TerraNova tests in reading, language,and math are positive, but small and not statisticallysignificant (Figure ES.8). These results underestimatethe full impact of actually attending a KIPP highschool, because all students with the opportunity toattend are included in the treatment group, but not allof them in fact attended. Five of the eight KIPP highschools in this analysis were brand new and servingtheir first cohort of students when we measured theirimpacts. There are significant differences between theimpacts of these new KIPP high schools and thoseof more experienced KIPP high schools. For thefive new schools, impacts are negative in all threesubjects and statistically significant in language. Forthe three more experienced high schools, impactsare positive and statistically significant in all threesubjects, with magnitudes ranging from 0.24 to 0.36.These more positive impacts for more experiencedhigh schools could imply that KIPP high schoolsbecome more effective as they gain experience.Because we do not have data to measure impactsof high schools in multiple years under this design,we cannot determine if KIPP high schools increasetheir impacts on continuing students as the schoolsgain experience.Continuing students with the option to attenda KIPP high school are less likely to drop outof high school. The overall dropout rate is verylow, but is significantly lower for the treatmentgroup—1 percent for those who had the chanceto attend a KIPP high school and 3 percent forthose who did not.7
Figure ES.8. KIPP high school impacts for continuing studentsNotes: Model: Matched-school design. Outcome: TerraNova test. Sample size: eight schools; 933 students. Statisticallysignificant at the 0.05 level (*) or 0.01 level (**), two-tailed test.WHAT ARE THE IMPACTS OFKIPP SCHOOLS ON STUDENTOUTCOMES OTHER THANACHIEVEMENT?We administered surveys to students and parentsto measure impacts on key outcomes other thanachievement at all three grade levels.KIPP elementary and middle schoolshave positive impacts on school satisfaction, particularly among parents. At boththe elementary and middle school levels, beingoffered admission to KIPP leads to increasesin parents’ satisfaction with their child’s school.More than three-quarters of elementary parentsin the treatment group rate their child’s schoolas excellent, compared to about half of parentsin the control group. At the middle school level,56 percent of treatment group parents and 28percent of control group parents rate the schoolas excellent. These findings are consistent withprevious research on KIPP in particular andoversubscribed charter middle schools in general(Tuttle et al. 2013; Gleason et al. 2010). Similarly, KIPP has significant positive impacts on aparent-based index capturing satisfaction withschool facilities, academics, safety, and discipline.KIPP also has significant positive impacts onseveral other satisfaction measures, includingindices of school efforts to engage parents atboth the elementary and middle school leveland middle school students’ perceptions of theirschoolmates. Evidence of KIPP impacts onsatisfaction do not extend to the high schoollevel, however, as none of eight measures ofimpacts on student-reported satisfaction at thatlevel were statistically significant.KIPP high schools have positive effectson several aspects of college preparation, including discussions aboutcollege, applying to college, and coursetaking. KIPP high schools have positive andsignificant impacts on measures related to schoolassistance in planning for college, including thefrequency of discussions about college at school,students being more likely to have in-depthdiscussions at school about how to pay for college,and teacher or counselor assistance with planningfor college. In addition to assistance provided bythe school, KIPP high schools have a positive andsignificant effect on college preparation activitiesundertaken by students, as well as on whetherthe student applied to at least one college oruniversity by spring of senior year—93 percent oftreatment students did so, compared with 88 percent of comparison students. Students with theopportunity to attend a KIPP high school enrollin schools more likely to offer advanced placement (AP) or international baccalaureate courses(97 percent versus 89 percent), and the number8
of AP courses and exams students have taken orintend to take is correspondingly higher.On average, across grade levels, KIPPschools have no statistically significantimpact on most survey measures ofstudent motivation and engagement,behavior, or educational aspirations. Atall three grade levels, KIPP did not significantlyaffect measures of motivation and engagement related to student self-control, academicmotivation, academic confidence, grit, schoolengagement, or effort in school, includingstudent reports of the time spent on homework.Student behavior was measured only at theelementary and middle school levels; we findno evidence that KIPP schools affect behavior,including indices of positive behaviors, undesirable behaviors, peer pressure, illegal activities,parental concerns about their child, frequencyof school disciplinary actions (according to theparent), and the extent to which the child iswell-adjusted. We measure educational goals andaspirations using responses from both parentsand the students themselves. In general, theeducational goals and aspirations among theseelementary, middle, and high school studentsare high in both the treatment (KIPP) andcomparison (non-KIPP) groups. At the highschool level, for example, 84 percent of studentsreported that they think they will graduate fromcollege. For 12 of 13 outcomes, the estimatedimpact of KIPP is not statistically significant.The single exception is among parents of studentsat KIPP elementary schools, who are 10 percentage points more likely than the comparisongroup to believe their child is very likely tocomplete college (81 versus 71 percent).Follow us on:Mathematica is a registered trademark of Mathematica Policy Research, Inc.Scan this QR codeto visit our website.9
a middle school program in 1994, but began expanding into the elementary and high school levels in 2004. By 2009, KIPP was educating students in grades prekindergarten through 12, and as of 2014-2015 the network included 162 elementary, middle, and high schools serving 59,495 students (Figure ES.1). Prior studies (see Tuttle et al. 2013)