Transcription
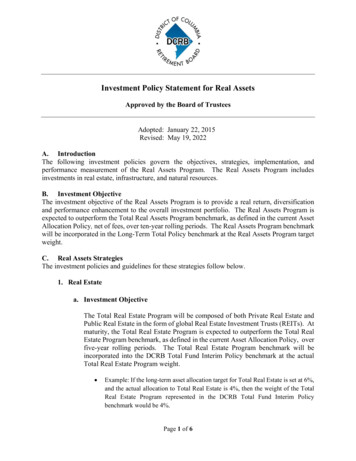
Real estate outlook 2022MARCH 2022Andrew LuskCIO and Head of Strategy,Lionstone InvestmentsHans NordbyHead of Researchand Analytics,Lionstone InvestmentsAs we emerge from the pandemic, and “return to normal” remains underway, therehave been significant changes to real estate fundamentals. Our private real estateteam at Lionstone Investments shares its views on the investment climate for realestate, and the secular and cyclical trends that inform their investment positioning.The macroeconomic environment is broadly conducive to real estateThe U.S. economy experienced a strong recovery in 2021, growing by 5.2% according to theInternational Monetary Fund, and is expected to continue expanding in 2022, driven by thefading impact of COVID-19 and pent-up consumer demand. While the removal of fiscal andmonetary stimulus is likely to pose a drag on the economy, we believe it is still expected togrow above trend in 2022, which is supportive of real estate across all property types (e.g.,retail, residential, office, etc.).At the same time, inflation has proven to be both more persistent and higher than the Fedand the markets initially anticipated coming out of the pandemic. Rising costs areimpacting a wider set of goods and services, and the supply distortions that are drivingthis are not likely to end quickly. During the third quarter of 2021, inflation consistentlyexceeded 6%. And in December, inflation hit 7%, its fastest pace since 1982. As theinflation story broadens from goods to services — which are the dominant driver of theU.S. economy — we believe inflation will be stubbornly high through the first half of 2022,and then decelerate through the end of the year. Traditionally, investors have perceived realestate as an asset class that functions as an inflation hedge, or at least a partial inflationhedge, depending on the specific property type. While that conventional wisdom has beendebated, there are certain attributes that are likely to help this asset class weather theimpact of higher prices relative to others, including increasing income and appreciatingasset value.Financial markets are flush with liquidity, and ultra-low interest rates are driving investorsto hunt for yield, resulting in most asset classes looking expensive, especially as measuredby their earning yields relative to their 10-year average (exhibit 1). At the same timeinvestors who are seeking to add inflation hedges to their portfolio are finding that manyof the “traditional” inflation hedges (e.g., Treasury Inflation-Protected Securities,commodities) are expensive and are locking in significantly negative real interest rates.Against this backdrop, real estate income yields — which offer at least a partial inflationhedge — continue to appear attractive versus both equities and fixed income.Page 1
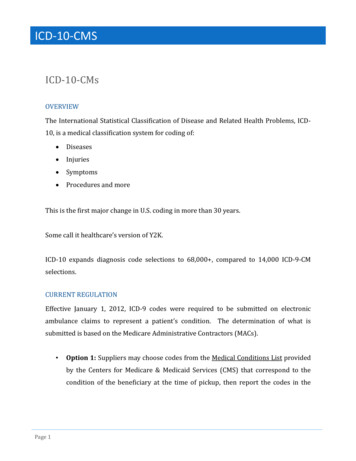
Real estate outlook 2022Exhibit 1: Yields for most asset classes are at the lower end of their 10-year range10Non-inflation hedged8(%)642Partial inflation hedged0-210-yearbund yield10-yeargilt rate10-yearTreasuryyieldBaa ratedlong-termbondsHigh-yieldbondsApartmentcap rateOfficecap rateIndustrialcap rateS&P 500earningsyieldSource: Lionstone research, Green Street, CNBC, WSJ, Bloomberg, as of September 2021.Secular drivers of outperformance: Employment, demographics, migrationWhile the overall macroeconomic environment is supportive of real estate, given the potentialheadwinds from inflation and rising interest rates, it’s critical to be selective. As we begin 2022,we believe that outperformance in real estate will be driven by three secular drivers: employment,demographics and migration.PC2: per-employee growth1. EmploymentExhibit 2: The digital economy pulls awayOutperformance of certainU.S. cities, in terms of jobgrowth and in-migration,Lower growth, higher productivityHigher growth, higher productivityhas increased through the Newspaper publishers Software publishers02/20–08/2102/20–08/21 Wired/satellite telecom Ecommerce shoppingpandemic and the ongoing(% of total jobs) Securities and commodities (% of total jobs) Advanced manufacturingrecovery in areas where the-4.4% 1.4% Insurance/pension funds Energy/chemical/pharmamanufacturingdigital economy is stronglyrooted. In the run-up to andLower growth, lower productivityHigher growth, lower productivityduring the pandemic, the Medical hospitals Junior colleges02/20–08/2102/20–08/21 Warehousing and storage Printing servicesonly jobs to post gains were(% of total jobs)(% of total jobs) Department stores Management consultantshigh-growth/high-productivity-3.9%-3.9% Basic manufacturing Restaurants and hospitalityjobs that are best classifiedas “digital economy” andPC1: aggregate growthinclude fields such asSource: BLS, Moody’s, Lionstone Research, as of August 2021.software publishers,ecommerce shopping, securities and commodities, and energy/chemical/pharma manufacturing.Heading into the downturn, we believed that these jobs would be more resilient in a recession andwould emerge from any economic slowdown stronger and faster. The pandemic was a strong testof our theory, and it was proven correct. From February 2020 through August 2021, these jobs haveincreased their share of total jobs by 1.4%, while all other job classifications lost around 4%. Inaddition to their share of jobs, this group is also outpacing all others in terms of wages.Page 2
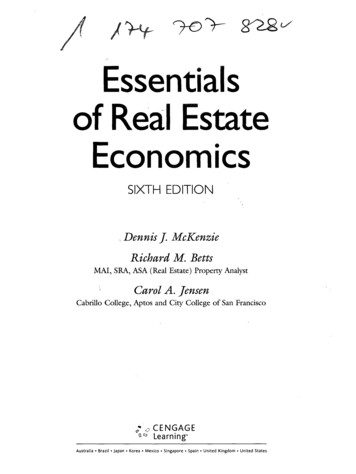
Real estate outlook 2022For the U.S. as a whole, jobs are expected to regain their previous peak by the end of 2022 and totaljobs in five years should be about 15% higher than they were in 2006, a 20-year period. Our focuscontinues to be in “hockey stick” markets (exhibit 3), the section of the U.S. spanning from thePacific Northwest, down through the Rockies into Texas and over through the Carolinas andNorthern Virginia. In this region, jobs should recover their losses by mid-2022, and employmentshould be about 40% higher than in 2006. At the same time, big coastal markets (e.g., NY, BayArea, DC, LA) are significantly weaker than U.S. trends, and we believe will continue to lag over thenext three to four years.Exhibit 3SeattlePortlandMinneapolisRochesterMilwaukeeSalt Lake CityBay AreaChicagoSacramentoColoradoSpringsLas VegasLos AngelesSan DiegoPhoenixDenverAlbuquerqueTucsonIC marketsIC potentialNon-IC ittsburghBostonHartfordNew YorkPhiladelphiaWashington, D.C.ColumbusIndianapolisNoVaCincinnatiKansas CityRichmondLouisvilleVirginia BeachWichitaLexingtonSt. LouisGreensboro Little RockGreensvilleColumbiaOklahoma San AntonioJacksonvilleHoustonNew OrleansTampaOrlandoMiamiSource: Lionstone research as of December 2021.2. DemographicsIt’s never been more important to be aware of demographics (exhibit 4). When we look at theforecast for the next five years, we see that the overall working age population growth — the agecohort of 20 to 64 — is almost zero. The property investment implication of this trend may be zeroor negative demand for real estate investments in certain U.S. metropolitan areas. In contrast, whenwe look at the “hockey stick” markets, we see projected growth in this age cohort of about 1.2%.Furthermore, growth in the 30- to 44-year-old age cohort (roughly millennials), especially in thehockey stick markets, is expected to dominate growth of any demographic anywhere in the U.S.Members of this cohort are building families and acquiring homes. They are also trained, motivatedand productive professionally. Such strong demographic support could drive superior demand andproperty investment returns.Page 3
Real estate outlook 2022Exhibit 4: Forecast by age group 2021–2026 . total-0.3-1.31.01.51.90.8-0.7-1.5-0.30.1IC markets0.2-0.11.51.61.90.9-0.2-0.80.20.6Hockey stick IC markets1.00.52.92.12.01.30.5-0.40.71.2Non-hockey stick IC markets-0.4-0.60.41.21.90.6-0.8-1.1-0.20.1Source: Esri as of October 2021.3. MigrationSince 2016, in-migration of legal residents within the U.S. has been negative for coastal cities(exhibit 5). And while this didn’t accelerate during the pandemic — contrary to popular reports —it hasn’t abated. We expect it to continue, especially given the demographic trends described above.Moreover, if we look at international migration, on which most of the coastal markets dependsto grow their population base, we have observed similar trends. Specifically, the share of legalinternational migration to “hockey stick” areas has grown to 40% from 28% during the past decade.At the same time it has fallen to 60% from 72% in coastal cities (exhibit 6). This trend is likely tocontinue as international migrations follow areas of economic growth and opportunity.Exhibit 6: Percentage share of international ibit 5: Total 204120Hockey stick cities totalSource: Moody’s5120612071208120Non-hockey stick total91200220011201220132014201520Hockey stick cities total16201720182019202020Non-hockey stick totalSource: Moody’sPage 4
Real estate outlook 2022What are the implications of these trends for real estate?As a result of these trends, functional obsolescence of real estate investments, especially in theoffice sector, appears to be accelerating in the 2020s. The people in high-growth industries, oftenmillennials, want something different out of their real estate and that has accelerated functionalobsolescence in most property types, especially office. Properties designed and built in the 1980sfor the predigital economy appear to be at particularly high risk of value loss. These assets aretypically hemmed-in by single-use infrastructure and located in high density single-useenvironments. The unfortunate reality of office buildings in this country is that they were built, onaverage, in the 1980s, to serve the industrial economy and old land use patterns. While it waswell underway pre-COVID, the pandemic appears to have accelerated this trend. As a result, thereis an opportunity to invest in new construction that is tailored to the needs of the working agecohort; a “modern village” that incorporates low/mid-density housing in a mixed use live/work/play environment.Our approach: Active and highly selectiveThis challenging investment climate will require discipline, patience and investors’ very best thinkingand decision-making. Our posture in this environment is active but highly selective about the riskswe are willing to take. We will continue to look for opportunities in most of the 17 cities in which weinvest, but we will prioritize cities and the neighborhoods within them with high concentrations ofhighly productive jobs without the high-cost structures of gateway coastal cities. Examples of theseinclude Austin, Denver/Boulder, Raleigh and Salt Lake City. Mixed-use assets with limitedobsolescence risk will be our highest priority. The ability to take advantage of demographic andtechnological change while also managing downside risk in a normal-grade recession is key.Page 5
Real estate outlook omImportant Information: For use by professional clients and/or equivalent investor types in your jurisdiction (not to be used with or passed on to retail clients).This document is intended for informational purposes only and should not be considered representative of any particular investment. This should not be considered an offer or solicitationto buy or sell any securities or other financial instruments, or to provide investment advice or services.Investing involves risk including the risk of loss of principal. Your capital is at risk. Real estate investing involves risks, including, without limitation: (i) actual operating results; (ii) interestrates; (iii) availability and costs of financing; (iv) economic and market conditions; (v) date of expected exit; (vi) increases in costs of materials or services beyond projections; (vii) forcemajeure events (e.g., terrorist attacks, extreme weather conditions, earthquakes, war); (viii) supply/demand imbalances; (ix) currency fluctuations; (x) litigation and disputes relating toinvestments with joint venture partners or third parties; (xi) changes in zoning and other laws; (xii) inability to obtain necessary licenses and permits; (xiii) competition; and (xiv) changesin tax law and tax treatment and disallowance of tax positions.The views expressed are as of the date given, may change as market or other conditions change and may differ from views expressed by other Columbia Threadneedle Investments (Columbia Threadneedle) associates or affiliates. Actual investments or investment decisions made by Columbia Threadneedle and its affiliates, whether for its own account or on behalf of clients,may not necessarily reflect the views expressed. This information is not intended to provide investment advice and does not take into consideration individual investor circumstances.Investment decisions should always be made based on an investor’s specific financial needs, objectives, goals, time horizon and risk tolerance. Asset classes described may not be suitablefor all investors. Past performance does not guarantee future results, and no forecast should be considered a guarantee either.Information and opinions provided by third parties have been obtained from sources believed to be reliable, but accuracy and completeness cannot be guaranteed. This document and itscontents have not been reviewed by any regulatory authority.In Australia: Issued by Threadneedle Investments Singapore (Pte.) Limited [“TIS”], ARBN 600 027 414. TIS is exempt from the requirement to hold an Australian financial services licenceunder the Corporations Act and relies on Class Order 03/1102 in marketing and providing financial services to Australian wholesale clients as defined in Section 761G of the CorporationsAct 2001. TIS is regulated in Singapore (Registration number: 201101559W) by the Monetary Authority of Singapore under the Securities and Futures Act (Chapter 289), which differfrom Australian laws.In Singapore: Issued by Threadneedle Investments Singapore (Pte.) Limited, 3 Killiney Road, #07-07, Winsland House 1, Singapore 239519, which is regulated in Singapore by theMonetary Authority of Singapore under the Securities and Futures Act (Chapter 289). Registration number: 201101559W. This advertisement has not been reviewed by the MonetaryAuthority of Singapore.In Hong Kong: Issued by Threadneedle Portfolio Services Hong Kong Limited. Unit 3004, Two Exchange Square, 8 Connaught Place, Hong Kong, which islicensed by the Securities and Futures Commission (“SFC”) to conduct Type 1 regulated activities (CE:AQA779). Registered in Hong Kong under the Companies Ordinance (Chapter 622),No. 1173058.In Japan: Issued by Columbia Threadneedle Investments Japan Co., Ltd. Financial Instruments Business Operator, The Director-General of Kanto Local Finance Bureau (FIBO) No.3281,and a member of Japan Investment Advisers Association.In the USA: Lionstone Partners, LLC (“Lionstone” or “Lionstone Investments”) is an investment adviser registered with the U.S. Securities and Exchange Commission and a subsidiary ofColumbia Management Investment Advisers, LLC.In UK Issued by Threadneedle Asset Management Limited. Registered in England and Wales, Registered No. 573204, Cannon Place, 78 Cannon Street, London EC4N 6AG, United Kingdom.Authorised and regulated in the UK by the Financial Conduct Authority.In the EEA issued by Threadneedle Management Luxembourg S.A. Registered with the Registre de Commerce et des Societes (Luxembourg), Registered No. B 110242, 44, rue de la Vallée,L-2661 Luxembourg, Grand Duchy of Luxembourg.In Switzerland issued by Threadneedle Portfolio Services AG, Registered address: Claridenstrasse 41, 8002 Zurich, SwitzerlandIn the Middle East: This document is distributed by Columbia Threadneedle Investments (ME) Limited, which is regulated by the Dubai Financial Services Authority (DFSA). For Distributors:This document is intended to provide distributors’ with information about Group products and services and is not for further distribution. For Institutional Clients: The information in thisdocument is not intended as financial advice and is only intended for persons with appropriate investment knowledge and who meet the regulatory criteria to be classified as a ProfessionalClient or Market Counterparties and no other Person should act upon it.Lionstone Partners, LLC (“Lionstone” or “Lionstone Investments”) is an investment adviser registered with the U.S. Securities and Exchange Commission and a subsidiary of ColumbiaManagement Investment Advisers, LLCColumbia Threadneedle Investments is the global brand name of the Columbia and Threadneedle group of companies. 2022 Columbia Management Investment Advisers, LLC. All rights reserved.CTNP ZBW (03/22) 4320870Page 6
team at Lionstone Investments shares its views on the investment climate for real estate, and the secular and cyclical trends that inform their investment positioning. . highly productive jobs without the high-cost structures of gateway coastal cities. Examples of these include Austin, Denver/Boulder, Raleigh and Salt Lake City. Mixed-use .