Transcription
Crack Growth Properties of Sealing GlassesJ. SalemNASA Glenn Research Center, Cleveland, OH, USAR. TandonSandia National Laboratories, Albuquerque, NM, USAKeyword: glass, ceramics, strength, crack growth, fracture toughness, connectorsAbstractThe crack growth properties of several sealing glasses were measured usingconstant stress rate testing in 2% and 95% RH (relative humidity). Crack growthparameters measured in high humidity are systematically smaller (n and B) than thosemeasured in low humidity, and velocities for dry environments are 100x lower than forwet environments. The crack velocity is very sensitivity to small changes in RH at lowRH. Confidence intervals on parameters that were estimated from propagation of errorswere comparable to those from Monte Carlo simulation.IntroductionSealing glasses are used in components such as electrical feed through connectors.The glass seals and electrically insulates the connector, and thus fracture of the brittleseal is a concern. In applications such as the Space Shuttle Environmental Cut Off(ECO) system, the connector seals are subjected to differential pressures at cryogenictemperatures and seal failure can create leakage of dangerous liquids and/or gasses.The crack growth properties of several sealing glasses were measured to compareglasses and to help perform life prediction and reliability of components such as feedthrough connectors. Strength based measurements, which are convenient, were used togenerate the data. However, because the statistical scatter in parameters derived fromstrength data can be very large, the statistical significance of the estimates was checkedby estimation of confidence intervals on the parameters via propagation of errors (POE)and Monte Carlo methods. The large scatter is a result of strength not being a materialproperty for glasses, but a function of the fracture toughness and worst flaw size presentfrom a variety of sources. Ideally, parameter estimation and design of brittle materialsshould be done on a fracture mechanics basis (e.g. NASGRO [1]) rather than a strengthbasis because strength is a function of the highly variable flaw size and relativelyconsistent fracture toughness.Although fracture mechanics specimens with large cracks, such as the doubletorsion specimen, can be used to measure crack growth with less scatter, the results arecomplicated by R-curve effects in coarse grain materials such as ZnSe [2] and diffusionrate effects when the crack size is large relative to that in real components. Strengthbased testing can be made more akin to fracture mechanics methods by placing a smallprecrack, such as an indentation, in specimens and thereby reduce scatter, yet test cracks
on the order of those encountered in applications. Comparison of sealing glassparameters from strength and fracture mechanics methods is left to future study.In order to cover the range of environments to which components with sealingglasses are exposed, RH (relative humidity) of 2% and 95% were considered. Toexpedite the work, constant stress rate testing of flexure specimens was used. The datawas analyzed by linear regression of (1) the individual data points, (2) the median values,and (3) the average values.MaterialsThe materials tested 1 were Corning 0120 sealing glass, Electro-Glass 2164,Schott 8330 borofloat glass, and Schott S-8070 SB glass-ceramic. In addition, thefracture toughness of several other glasses was measured for comparison: soda-limesilicate, S8061 sealing glass, and an antimony (Sb) doped glass. With the exception ofthe as-molded 2164 glass, the test specimens were prepared by diamond grinding inconformance with ASTM C1161 [3]. For the 2164 glass specimens for crack growthtesting, the tensile surface was preserved in the as-molded condition.Experimental ProcedureThe elastic modulus of 2164 glass was determined at 20oC by impulse excitationof vibration in accordance with ASTM C 1259 [4]. The mean and standard deviation ofseven specimens in the as-molded and ground conditions were 62.0 1.2 and 63.8 0.5GPa respectively.Fracture strength as a function of stress rate was measured at 20oC by using fourpoint flexure of ASTM C1161 size B specimens [3] at rates ranging from 10-3 to 103MPa/s in relative humidity ranging from 2% to 95%. Typically, six stress rates wereapplied with at least five specimens per rate. For the purposes of parameter analysis, theinert strength was determined by testing at low RH ( 2%) with a stress rate greater thanor equal to 1000 MPa/s. This results in failure in a fraction of a second.Fracture toughness was measured by using chevron-notch flexure specimens [5]in laboratory ambient ( 30% RH) air and dry nitrogen. Test specimen stability wasmonitored via a strain gage placed on the compressive face of the specimen [6].Data AnalysisThe power law formulation:v da AK In A* [ K I ] ndtK IC(1)was applied in the data analysis, where v, a, and t are crack velocity, crack size, and time,respectively. A and n are the material/environment dependent SCG (slow crack growth)parameters, and KI and KIC are, respectively, the Mode I stress intensity factor and the1Certain commercial materials are identified in order to adequately specify the experimental procedure andresults. Such identification does not imply any endorsement.
critical stress intensity factor or fracture toughness of the material under Mode I loading.For constant stress rate testing based on the power law formulation, the fracturestrength,σf , is expressed as a function of stress rate as [7]σ f [B(n 1)σ in 2σ& ]1 n 1(2)where σ& is the applied stress rate, σi is the inert strength, and B is a parameter associatedwith A, n, fracture toughness, crack geometry and loading configuration. The SCGparameter n can be determined from a plot of log σf as a function of log σ& with Eq. 2written as1(3)log σ f log σ& log Dn 1where1(4)log D log B (n 1)σ in 2n 1[]Once the slope α and intercept β are estimated by linear regression of Eq. 3, theparameters n, D, B and A, and their standard deviation SDn , etc., were estimated from [8]1(5)n 1αSDαSDn (6)α2D 10 β(7)(SD D 2.3026 (SD β ) 10 βB (α 10 β ασSDln B )) 1 α i3SD 21Cov(α , β )22Q 2 2α (ln 10 ) SD β̂2 (1 3α ) SDln2 σ i 2Q ln 10ααα 1 α i32K σ2 K I2cA βα 10 ( 1 3α )Y 2 B( n 2 )Y 2*2Ic(8)(9)(10)(11)
SDln A*4α1 α2SDK2 Ic2α SDα2 2 Q (ln 10 ) SD β2 21 3α α K Ic2 (1 3α ) SDln2 σ i2(12)α Cov(α , β ) 2 ln 10 Q 1 3α α 1 α Icβ α3 1 α i32Kσ2 K I2c nA 10 ( 1 3α )Y 2 B( n 2 )Y 22SDK2 I c2α SDα2QlnK (ln 10 ) SDβ2 Ic 22K Ic1 3α1 α αα Cov(α , β )2 (1 3α ) SDln2 σ i 2 ln 10 Q ln K Ic 1 3αα (3α 1)2SDln A(13)whereQ α β ln 10 ln σ iandCov(α , β ) SDα2 log σ&((14))(15)where log σ& is the mean of the log of the applied stressing rates, Y is the geometrycorrection factor for the stress intensity factor, and the standard deviation associated withthe inert strength (SDlnσi) is calculated in logarithmic space. Probability limits on theparameters B and A can be calculated from:BUpper EXP[ln B t (SDln B )] and AUpper EXP[ln A t (SDln A )]Lower(16)Lowerby using Student’s t distribution for the DOF and probability level desired. If the DOF(degrees-of-freedom) is greater than 40, thenBUpper EXP[ln B l(SDln B )] and AUpper EXP[ln A l(SDln A )]Lower(17)Lowerwhere l is the number of standard deviations corresponding to the probability leveldesired. The DOF, φ, is given by(SD )22ln Bφln B2 1 (1 3α ) SDln2 σ i 2φln σ i α 21φαβ2 2 SDα2Cov(α , β ) 2 SD β() 2Q ln 10Qln10 42ααα3 2(18)
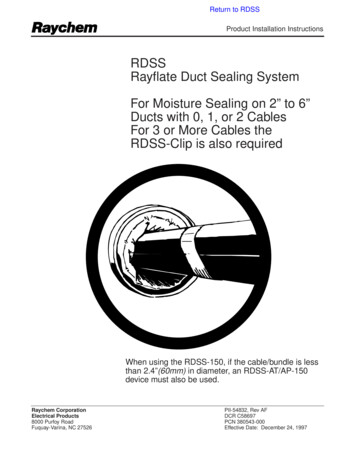
and(SD )22ln Aφln A1φαβ 1φln K Ic(4 SD )22ln K Ic2 1 (1 3α )SDln2 σ i 2φln σ i α 2(19)22 α SDα2α Cov(α , β ) 2 SD β (ln 10 ) 2 ln 10 Q Q 421 3α α1 3α αα3 2where φσ i is the DOF in inert strength (number of inert strength tests minus one) and φαβis the DOF in regression (number of constant stress rate tests minus two).Three approaches were used to estimate the slope and intercept of eq. 3: linearregression of (1) the individual data points; (2) the median values; and (3) the averagevalues. In addition to the approaches described, the fits were performed over severalstress rate ranges to determine the sensitivity to data range.ResultsFracture ToughnessExamples of load-backface strain curves for laboratory air and dry N2 are shownin Figure 1 for the Electro-Glass 2164. Stable fracture was exhibited in bothenvironments; however, less stability was exhibited in dry N2. Fracture toughness in dryN2 ranged from 0.72 to 0.80 MPa m for the glasses, as summarized in Table 1. Testingin air reduced the measured fracture toughness by 10%. For the purposes of crackgrowth parameter estimation, the fracture toughness the 0120, 8070 and 8330 materials,which were not measured, were assumed to be 0.75 0.04 MPa m.10Dry N2Load, N864Lab Air20050100150200250Backface Strain, microstrainFigure 1 Load as a function of backface strain for Electro-glass 2164 chevron-notched flexure specimensin dry nitrogen and laboratory air.
Table 1 Fracture toughness (MPa m) of several glassesEnvironmentAir (%RH/oF )Dry N2S80610.64 0.01 (23/73)0.72 0.0221640.61 0.05 (32/73)0.74 0.03Soda lime silicate0.75 0.04 (35/73)0.80 0.01Sb-doped0.72 0.002 (23/73)0.76 0.01MaterialInert and Time-dependant StrengthThe strength as a function of stress rate is plotted in Figures 2–5. The large degreeof scatter, particularly at low RH, is indicative of the difficulty in characterizing anddesigning glasses and dense optical materials with the inherent flaw population andstrength measurements: random and spurious damage make the distribution everchanging and difficult to characterize, regardless of Weibull statistics. In this testing, theeffect of scatter on slow crack growth was mitigated partially by the large range of stressrates used ( 4 orders of magnitude). All the materials, except the 8070 SB glass-ceramic,exhibit a strength increase from 50 MPa in 95% RH to 150 MPa in 2% RH as thestress rate is increased from 0.001 MPa/s to 1000 MPa/s, implying a similar combinationof flaw size distribution and fracture toughness. As the fracture toughness values arelikely similar (Table I), the implication is a similar flaw size distribution.The slow crack growth parameters as estimated from equations (5) to (17) aresummarized in Table 2.0120 2% RH0120 95% RHStrength, σf , MPa1502000120 95% RHInert (1000 MPa/s, 2% RH)150Strength, σf , MPa200100908070605045403530Regression Line95% Confidence Interval95% Prediction Interval250120 2% RHInert (1000 MPa/s, 2% RH)100908070605045403530Regression Line95% Confidence Interval95% Prediction Interval2520200.001 0.010.1110Stress Rate, σ, MPa/s10010000.001 0.010.1110Stress Rate, σ, MPa/sFigure 2 Strength of 0120 glass in 2% and 95% relative humidity.1001000
2164 2% RH2164 95% RH2002002164 95% RHInert (2000 MPa/s, 2% RH)150Strength, σf , MPaStrength, σf , MPa150100908070605045403530Regression Line95% Confidence Interval95% Prediction Interval251009080706050454035302164 95% RHInert (2000 MPa/s, 2% RH)Regression Line95% Confidence Interval95% Prediction Interval2520200.001 0.010.11101000.001 0.0110000.11101001000Stress Rate, σ, MPa/sStress Rate, σ, MPa/sFigure 3 Strength of 2164 in 2% and 95% relative humidity.8070 SB Glass-ceramic 2% RH8070 SB Glass-Ceramic 95% RH4003504008130 SB 95% RH350Inert (2000 MPa/s, 2% RH)Inert ( 2% RH)300Strength, σf , MPa300Strength, σf , MPa95% RH250200150250200150Regression Line95% Confidence Interval95% Prediction IntervalRegression Line95% Confidence Interval95% Prediction Interval1001000.001 0.010.1110Stress Rate, σ, MPa/s10010000.001 0.010.1110100Stress Rate, σ, MPa/sFigure 4 Strength of 8070 SB glass-ceramic in 2% and 95% relative humidity.1000
8330 Borofloat 95% RH8330 Borofloat 1% RH8330 Borofloat 95% RH150150Strength, σf , MPaStrength, σf , MPaInert (1000 MPa/s, 1% RH)10090807060Regression Line95% Confidence Interval95% Prediction Interval501009080708330 Borofloat 1% RH60Inert (1000 MPa/s, 1% RH)Regression Line95% Confidence Interval95% Prediction s Rate, σ, MPa/s0.010.11101001000Stress Rate, σ, MPa/sFigure 5 Strength of 8330 borofloat in 1% and 95% relative humidity.Table 2 Summary of slow crack growth (SCG) parameters for glassesAA 95%rRegression ofBm/sm/snB-95%2.MPa sIndividual Points(MPa m)-n(MPa m)-nB# ofSCGTests0120, 95%17.0 3.10.61.8 x 10-44.4 x 10 03.9 x 10 4360120, 2%23.2 5.34.31.0 x 10-42.6 x 10 05.6 x 10 5302164, 95% RH12.9 1.16.062.3 x 10-13.4 x10 1652164, 2% RH22.1 3.939.013.0 x 10-14.4x10 3488070 SB, 95% RH19.8 2.6601.68.2 x 10-21.3 x10 1258070 SB, 2% RH25.0 3.93,079935.5 x 10-31.5 x 10 0258330, 95% RH17.1 1.350.75.6 x 10-11.0 x10 1258330, 3% RH24.5 3.9190.48.0 x 10-13.1 x10 23030.0 3.62,8552662.1 x 10-22.3 x10 03012.2 0.41211.1 x 10-11.3 x 10 0115Sb-doped, 65%RH13.1 0.49291.7 x 10-22.4 x 10-1115Soda-lime silicate,Distilled Water20.0 2.0184239.0 x 10-25.7 x 10 0308330, 1% RHSb-doped,DistilledWater
Table 3 Comparison of fitting ranges and methods for the 8330 borofloat glass tested in 95% RH.AB# ObservationsFit MethodnMPa2 .sm/s (MPa m)-nAll Data (high rate included)19.2 1.3130Individual points3.7 x 10021.6 3.00.46Median values2.1 x 101Individual points19.3 2.013.9 x 100 1000 MPa/s (avoid inert region)17.1 1.355.6 x 10-125Median values19.9 3.615Average values17.2 1.85Average values4.5 x 1005.9 x 10-165Table 4 Comparison of fitting ranges and methods for the 8330 borofloat glass tested in 1% RH.AB# ObservationsFit MethodnMPa2 .sm/s (MPa m)-nAll Data (high rate included)36.8 4.460835Individual points5.5 x 10-138.2 11.25417Median values9.0 x 10-136.8 8.86325.4 x 10-1 1000 MPa/s (avoid inert region)30.0 3.628552.1 x 10-230Median values30.4 8.730326Average values30.0 7.02984Average valuesIndividual points2.2 x 10-22.0 x 10-276Table 5 Comparison of propagation-of-errors equations to Monte Carlo estimatesMaterial andAA 95%BB-95%HumidityMPa2 .sMPa2 .sm/s (MPa m)-nm/s (MPa m)-n2164, 95% RH5.70.060.23034.1Monte Carlo6.10.110.21720.22164, 2% RH390.0090.2984,361Monte Carlo410.0110.26312,891BDiscussionEffects of HumidityTable 2 demonstrates that lower test humidity results in higher estimates of n andB, regardless of the type of glass tested, implying that controlling or eliminating moisturevia coatings, etc. will improve component life. The variances are also somewhat largerfor dry conditions because the shallower slope is more difficult to characterize for thesame x-axis range. The parameters are also very sensitive to small changes in humidityat low humidity: the value of B changes by a factor of 100 for a change of 3% to 1%whereas a change from 95% to 3% only results in a factor of 10 change.
Effect of Fit Method and RangeThe effects of fit range and method on the estimated parameters can be seen inTables 3 and 4: the fitting methods produce similar results for data set; and the inclusionof the high stress rate data (1000 MPa/s) substantially alters the results at low humidityby increasing n. The lack of an effect of fit method implies either few outliers orsufficient data to mitigate the influence of outliers. The effect of fit range can bemitigated by using crack growth data only from lower stress rates ( 200 MPa/s) [9],and independently measuring inert strength with 0%RH.Confidence IntervalsThe 95% confidence intervals on B for the sealing glasses in Table 2 differ fromthe estimates by 1 to 3 orders of magnitude, even for data sets with 60 observations. Therelatively large confidence intervals on some of the data sets imply that the use ofinherent or natural flaws requires very large data sets. In another study, the use of 115tests to characterize the Sb-doped glass in Table 1 resulted in standard deviations on n ofless than ¼ of those for the sealing glasses, and a 95% confident interval on A and Bwithin one order of magnitude of the estimate, as shown in Table 2. Improvements canalso be made by maximizing the range of rates used, and by performing most of tests atthe highest and lowest rates. Monte Carlo estimates compared well with estimates fromequations (5) to (17), as shown on Table 5.Crack VelocityThe crack velocity as a function of stress intensity based on the estimatedparameters in Table 2 is shown in Figures 6 and 7. The 8070 glass exhibited the leastcrack velocity whereas the 0120 and 2164 glasses exhibited the greatest velocities at anystress intensity. It should be noted that the fracture toughness of some of the glasses wasnot measured and the results could shift if the fracture toughness is significantly differentthan the assumed value of 0.75 MPa m. Application of common time-to-failureequations [7] indicate the sustainable stress for the 8070 is doubled if the humidity ischanged from 95% to 2%. As compared to soda-lime silicate float glass, the sealingglasses exhibit greater susceptibility to slow crack growth, as shown in Figure 6.ConclusionsSCG parameters measured using constant stress rate testing in high humidity aresystematically smaller (n and B) than those measured in low humidity. Velocities for dryenvironments are 100x lower than for wet environments: keeping components dryshould extend the life! The use of high stress-rate data increased estimates n at low RH,and thus should be used with caution. 8070 glass-ceramic exhibits the lowest crackvelocities of the sealing glasses tested, and reducing RH from 95% to 2% nearly doublesthe sustainable stress. The crack velocity is very sensitive to small changes in RH at lowRH: for the 8330 glass, a 100x change in velocity resulted for changes of RH from 1%to 3% and 3% to 95%. Monte Carlo simulations and propagation of errors solutions gave
similar estimates of parameter variance. Future work should include measurement of thefracture toughness of all the materials in order to more accurately estimate A, andmeasurement of the parameters with macro-crack test specimens for comparison.95% RH1e-21e-31e-4Velocity, v , m/s1e-52164 95% RHSb-doped, H2OSoda-lime, H2O8070, 95 % RH8330, 95% RH0120, 95% RH1e-61e-71e-81e-91e-101e-111e-120.10.20.40.5 0.6 0.7Stress Intensity, KI , MPam10.5Figure 6 Crack velocity for 95% relative humidity based on the parameters in Table 2. 2% RH1e-21e-31e-4Velocity, v , m/s1e-52164, 2%RH8070, 2%RH8330, 3%RH8330, 1% RH0120, 2%RH1e-61e-71e-81e-91e-101e-111e-120.10.20.40.5 0.6 0.71Stress Intensity, KI , MPam0.5Figure 7 Crack velocity for 1 to 3% relative humidity based on the parameters in Table 2.
AcknowledgementsThe authors thank J. Jill Glass for many useful discussions, and Frank Kody and SaraCaruso for running the soda-lime silicate SCG tests.References[1] NASGRO Fracture Mechanics and Fatigue Crack Growth Analysis Software, version5.1, Southwest Research Institute, San Antonio, Texas.[2] J.A. Salem “Mechanical Characterization of ZnSe Windows for use with the FlowEnclosure Accommodating Novel Investigations in Combustion of Solids (FEANICS)Module,” NASA TM 214100, 2006.[3] ASTM C 1161, "Standard Test Method for Flexural Strength of Advanced Ceramics atAmbient Temperature," in Annual Book of Standards, Vol. 15.01, American Society forTesting and Materials, West Conshohocken, PA, 2004.[4] ASTM C 1259, “Standard Test Method for Dynamic Young’s Modulus, ShearModulus, and Poisson’s Ratio for Advanced Ceramics by Impulse Excitation ofVibration," in Annual Book of Standards, Vol. 15.01, American Society for Testing andMaterials, West Conshohocken, PA, 2004.[5] ASTM C 1421-99 “Standard Test Method for the Determination of FractureToughness of Advanced Ceramics at Ambient Temperatures,” in Annual Book of ASTMStandards, V. 15.01, American Society for Testing and Materials, West Conshohocken,Pennsylvania (2000).[6] J.A. Salem and L. J. Ghosn, “Back-Face Strain as a Method For Monitoring StableCrack Extension In Ceramics,” Ceramic Engineering and Science Proceedings, Vol. 19,No. 3, pp. 587-594, (1998).[7] J.E. Ritter, "Engineering Design and Fatigue Failure of Brittle Materials," in FractureMechanics of Ceramics, Vol. 4, R. C. Bradt, D. P. H. Hasselman, and F. F. Lange, Eds.,Plenum Publishing Co., NY, 1978, pp. 661-686.[8] J.A. Salem and A.S. Weaver, “Estimation and Simulation of Slow Crack GrowthParameters from Constant Stress Rate Data,” pp. 579-596 in Fracture Mechanics ofCeramics: Active Materials, Nanoscale Materials, Composites, Glass, and Fundamentals,R.C. Bradt, D. Munz, M. Sakai and K. White, eds., Springer, (2005).[9] J.A. Salem and M.G. Jenkins, “The Effect of Stress Rate on Slow Crack GrowthParameters,” pp. 213-227 in Fracture Resistance Testing of Monolithic and CompositeBrittle Materials, ASTM STP 1409, J.A. Salem, G.D. Quinn and M.G. Jenkins, Eds.,American Society for Testing and Materials, West Conshohocken, Pennsylvania(January, 2002).
Sealing glasses are used in components such as electrical feed through connectors. The glass seals and electrically insulates the connector, and thus fracture of the brittle seal is a concern. In applications such as the Space Shuttle Environmental Cut Off (ECO) system, the connector seals are subjected to differential pressures at cryogenic


![[REPACK] Crack Cigraph Archisuite Archicad 16 Build 3270 Winl](/img/47/darakany.jpg)

![Navisworks Simulate 2019 Portable Cracked YHaz Rar [CRACKED]](/img/62/hamiraf.jpg)