Transcription
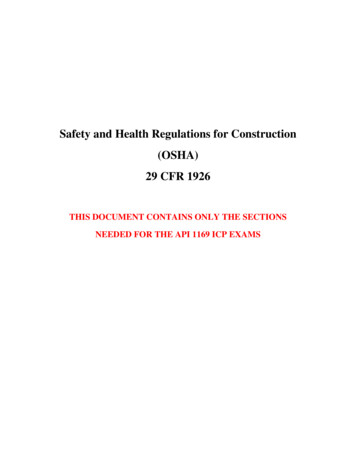
ShipbuildingA promising first half,an uncertain second one2018 started briskly in the wake of 2017. In thefirst half of the year, newbuilding orders wereplaced at a rate of about 10m dwt per month.However the pace dropped in the second half, asowners grappled with a rise in newbuilding pricesand growing uncertainty over the IMO 2020deadline.Regardless, newbuilding orders rose to 95.5mdwt in 2018 versus 83.1m dwt in 2017. Demandfor bulkers, container carriers and specialisedships increased, while for tankers it receded,reflecting low freight rates and poor sentiment.Thanks to this additional demand, shipbuilderssucceeded in raising newbuilding prices by about10%. This enabled them to pass on some of theadditional building costs resulting from highersteel prices, new regulations and increasedpressure from marine suppliers, who have alsobeen struggling since 2008.VIIKKILNG-fuelled forest product carrier, 25,600 dwt (B.Delta 25), built in 2018by China’s Jinling for Finland’s ESL Shipping.5
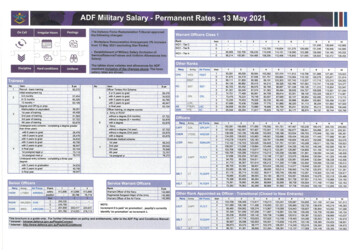
50SHIPBUILDINGSHIPBUILDINGKEY POINTS OF 2018KEY POINTS OF 01420152016Deliveries vs demolitionsDeliveries20172018Fleet 200-800-1002003DeliveriesKEY POINTS OF 220132014201520162017The three Asian shipbuilding giants, representing almost 95% of the globalorderbook by deadweight, continued to fight fiercely for market share. In2018, China consolidated its top position with a 43.1% market share. In secondplace Korea increased its market share to 27.5%, while Japan slipped back to24.0% in third place. The ‘rest of the world’ (RoW) and Europe registered a 3.8%and 1.6% share of the global market respectively.Newbuilding deliveries fell to 78.7m dwt in 2018 against 96.1m dwt theprevious year, reflecting the decline in newbuilding orders in 2016 (32.6mdwt). The global orderbook increased from 214.8m dwt to 231.7m dwt in2018, while the world fleet increased from 1,805m dwt to 1,855m dwt(37,674 ships) during the year.Shipowners sought to take advantage of low asset prices in early 2018 andmany returned to the shipyards, but owners were equally active on the secondhand market (110m dwt in sales in 2018 versus 132m dwt in 2017).Newbuilding prices increased by some 10% during the year regardless ofvessel size and type, even for tankers, which were less in demand. This wasthe effect of tension in the newbuilding market. Orderbooks stretched wellbeyond the two-year yardstick, reaching three years for the busiest yards.2018Fleet EvolutionShould owners install scrubbers (exhaust gas cleaning systems) or not? Ifso, what type: open loop, closed loop or hybrid? Will open-loop scrubbersbe banned by more countries? Who pays for the equipment: owners orcharterers? And who is responsible in the case of scrubber breakdown? Howreliable will scrubbers be in a high-temperature, high-corrosion environment,and operating with different engine outputs?OrdersMillion dwtOrders300Million dwt250Will the price spread between ‘compliant’ fuel and high sulphur fuel widen ornarrow, and what will be the availability of both fuel types? Are scrubbersjust a temporary fix that will become redundant after a couple of years?What adjustments, if any, will the Baltic Exchange make to their indices (onwhich the FFA market and a good part of the physical market depends)? Whatproportion of the world fleet will in fact be fitted with scrubbers?2001505002003BulkDeliveriesMillion dwt1606140120m dwtShipsDeliveriesm dwtOrderbookActive 7,674m dwt1,804.71,855.7Ships7.8%7.9%12.5%20172018Market share43.7%43.1%Ships1,2341,283m dwt93.999.824.4%27.5%Ships396465m dwt52.463.825.1%24.0%750730Market shareShipsm dwt5455.51.6%1.6%Ships237288m dwt3.43.65.2%3.8%Ships267229m dwt11.18.9Market shareMarket shareROW95.5214.8Market shareEurope1,24583.1m dwtm /Active FleetChina2017While all these questions were raised during 2018, the answers will onlybecome apparent during 2019, 2020 and beyond. The uncertainty createdby the sulphur cap poses a challenge for everyone in the industry: owners,charterers, traders, shipbuilders, oil refiners, bunker suppliers, banks andbrokers. Opportunities for some, headaches for others.100180ShipsOrdersThe IMO 2020 sulphur cap caused more debate (and disagreement) than anyother issue in the market in 2018. It raised numerous questions, many ofwhich remain unanswered.200SummaryMillionMillion dwtMillionMillion leetThe trade dispute initiated by the US constituted the second hot topic in2018, but its impact was difficult to assess. Chinese exports shrank by 4.4%year-on-year in December 2018, the worst decline in two years and muchworse than economists expected. The same month, Chinese imports slumpedby 7.6% year-on-year, which also suggests that the world’s second-largesteconomy is struggling. Reuters’ analysts had expected a 3% decline and a 5%increase in exports and imports respectively but despite the year-end slumpin exports, China’s trade surplus with the US swelled to 323bn in 2018, thehighest on record.Newbuildingprices increased10% in 2018Million dwt2,0001,800BRS GROUP - Annual review1,60020191,400BRS GROUP - Annual review 20197
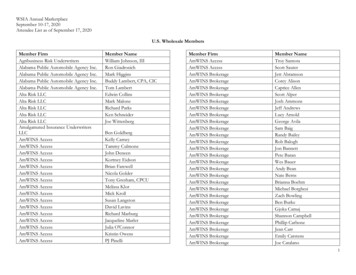
SHIPBUILDINGSHIPBUILDINGWORLD ECONOMY, MARITIME TRADE AND FREIGHT RATESWORLD ECONOMY, MARITIME TRADE AND FREIGHT RATESWORLD ECONOMY, MARITIMETRADE AND FREIGHT RATESGlobal Trade and World GDP & Active Fleet GrowthGlobal trade and world GDP & active fleet growthFreight RatesAverage Time Charter rates were:Dry bulk Aframax: 14,833 in 2017 and 14,220 in 2018 Suezmax: 18,196 in 2017 and 16,050 in 2018 VLCC: . 26,539 in 2017 and 25,750 in 201812%10.2%World EconomyThe world economy performed well in 2018, with agrowth of 3.7%, just 0.1% less than in 2017. However,seaborne trade growth went down from 4.2% in 2017 to3.1% in 2018. Inward-looking trade policies and the riseof protectionism threaten an otherwise positive outlookfor seaborne trade, according to the 2018 United NationsConference on Trade and Development (UNCTAD) reviewof maritime trade. Rising trade friction could derail therecovery seen in the past two years and reshape globaltrade patterns. UNCTAD also warned that competitionauthorities should remain vigilant over the accelerationof M&A activity in the liner shipping sector.8%However, the report warned the threat of growing globaltrade disputes would cloud prospects for shipping.Tensions between the world’s two largest economies, theUS and China, as well as with Mexico, Canada and theEuropean Union are “an immediate .5%3.5% 3.4%3.4% 3.5%3.3%3.5%2.0%0%-4%3.2% 3.0%4.2%3.7% 3.8%The BDI logged an averaged 1,352 points in 2018 versus 1,145 in 2017, albeitthere was the start of a decline at the end of the year.3.7%3.1%2.8%The Baltic Capesize 5TC averaged 12,962 in Q1, 14,980 in Q2, 22,207 inQ3, and 15,829 in Q4.-0.1%Tanker-3.8%Tanker rates were under greater pressure in 2018. The Baltic Exchange CleanTanker Index (BCTI) started 2018 at 655 and ended at 813, and averaged579 over the year, compared to 606 in 2017.-8%20092009Overall, UNCTAD predictions for seaborne trade arepositive, with a potential compound annual growth rateof 3.8% between 2019 and 2023.While volumes across all sectors are expected to grow,containerized and dry bulk shipments are expected to risethe fastest, at the expense of tanker volumes. “Projectionsof the rapid growth in dry cargo are in line with a fivedecade-long pattern that saw the share of tanker volumesbeing displaced by dry cargoes, dropping from 50% in1970 to less than 33% in 2017,” said UNCTAD.After an extremely difficult year in 2016 (in which the Baltic Exchange DryIndex (BDI) fell to its lowest level since launch), the dry bulk market saw therecovery started in 2017 continue into 2018.9.3%9.4%2010201020112011WorldWorld tiveActiveFleetFleetGrowthGrowth MR2: between 13,000 and 14,500 per day LR1: between 13,000 and 15,000 per day LR2: between 13,500 and 18,000 per dayFinally, container throughput growth fell to 4.6% in 2018, down from 6.7% in2017but up from 2.7% in 2016.120In the crude segment, the Baltic Exchange Dirty Tanker Index (BDTI) startedthe year at 700 and ended at 1266, with an overall average of 798 in 2018versus 787 in 2017.100Crude tanker rates had softened across the board in 2017 and the start of2018. However, rates increased sharply in Q4 2018 as a consequence of thefall in the oil price, which plummeted by more than 40%.80MaritimeTrade Growth60Maritime trade growth40Time Charter rates for VLCCs started the year at 27,000, dropped to a lowof 19,000 during the summer, and ended at Charter rates for cellular ships (6-12 month fixtures)10%2016 avg /day2017 avg /day2018 avg /day8,500 teu8,66713,39615,53879%2.6%5,600 teu6,12912,06313,078113%1.4%4,000 teu (Panamax)5,1337,53311,204118%2,500 teu5,9798,17910,79280%1,700 teu7,0047,4049,64638%1,000 teu6,6216,3757,2429%Alphaliner Index43.254.768.258%8.3%8%AlphalinerCharterIndex since 0%1506.0%6.5%3004%2%250The idle or unemployed containership pool increasedfrom about 0.4m teu (1.8% of the active fleet) at the endof 2017 to 0.6m teu (2.8%) at end 2018.During 2018, 1-year Time Charter rates fluctuated within the following bands:Growthin theChartertanker tradecontinuedslow, from 4.1% in 2016 to 2.7% inAlphalinerIndexsince to20102017, to 1.4% in 2018.2010Despite this, charter rates remained only slightly aboveoperating expenses. As carriers consolidated into eversmaller numbers of large alliances, they were able to usetheir bargaining power to keep rates under check. MR2: 13,147 in 2017 and 13,261 in 2018 LR1: 13,725 in 2017 and 13,240 in 2018 LR2: 14,789 in 2017 and 14,040 in 2018Dry bulk trade growth dropped to 2.6% in 2018, in contrast to 4.1% in 2017 and1.7% in 2016.12%Container charter rates continued to improve in 2018after the record lows seen in 2016 and the subsequentrecovery in 2017. The Alphaliner Charter Index averaged68 in 2018 versus 55 the previous year.Average 1-year Time Charter rates were as follows:Maritime -0.1%2015201620172018Dry Bulk Trades Growth (Mt)Oil Trades Growth (Mt)Container Throughput Growth (Teu)Dry Bulk TradesOil TradesContainer ThroughputGrowth (Mt)Growth (Mt)Growth (Teu)50082000200120022003200420052006BRS GROUP - Annual review 20192007200820092010201120122013BRS GROUP - Annual review 20192014201520162017Picture: HAFNIA SHANGHAI, 75,000 dwt shallow draft LR1 Tanker (IMO3), under sea trials at GSI before delivery to Vista Hong Kong.9
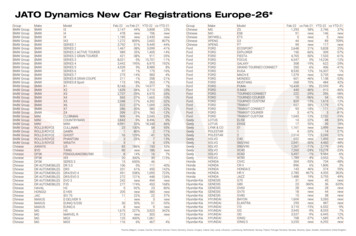
SHIPBUILDINGSHIPBUILDINGORDERS AND ORDERBOOKSORDERS AND r YearNew ordersvesselsper yearMillion dwtMillion dwt30Korea continued to dominate the segment and managed to increase its marketshare from 42% to 50% in 2018. Both China and Japan conceded ground, fallingfrom 29% to 24% and 20% to 18% respectively.14125Tanker deliveries declined to 28.1m dwt in 2018 from 38.6m dwt in 2017. Theactive tanker fleet grew from 570m dwt at the end of 2017 to 577m dwt atthe close of 2018. The tanker orderbook represented some 12.4% of the activetanker fleet at year end, distributed as follows:202134415187m dwt31.925.4m dwt38.428.9Orderbookm dwt75.471.9Active Fleetm dwt570.2577.8Orderbook/Active Fleet Panamax and LR1: orderbook 1.9 m dwt; fleet 32.3m dwt; ratio 5.8%7452228833 Suezmax and LR3: orderbook 8.2m dwt; fleet 89.7m dwt; ratio Panamax/LR1Aframax/ LR2 Panamax/ tainerships orders continued to rise in 2018, after the recovery seen in2017. Some 13.3m dwt of contracts were placed, compared to 8.1m dwt in2017, although this was below the yearly average of 14.2m dwt since 2000.New orders per year (2010-2018)no.shipsm 24.13.08.113.3Other 8114.1115.732.683.195.5Orders and orderbooksfor standard vessels100Newbuilding orders increased by 15% in 2018 to reach95.5mdwt. This follows the 155% increase seen in 20178075(83.1m dwt versus 32.6m dwt in 2016).Total60 2018 figure is very close to the yearly average ofThe97.5m dwt registered since 2000. As mentioned, ordersfor40 bulkers, container carriers and specialised ships34increased, while those for tankers declined.In 2018, only 18 VLOCs were ordered, 14 to be operated by Vale and 4 byMOL. Owners49 gave priority to Ultramax and Kamasarmax orders, with 14738 dwt)and 108 contracts placed respectively. Some 141 Capesizes ( 85,000were also contracted, of which 40% were Newcastlemax (55 ships).20Bulkerorders rose by 23% to 48.1m dwt in 2018, upfrom 39.2m dwt in 2017, and above the yearly averageof044.5m dwt seen since 2000.Deliveries declined in 2018 as a consequence of the drop in orders in 2016. Atotal of 28.1m dwt was delivered versus 38.6m dwt5in 2017. At the end of theyear, the dry bulk orderbook stood at 111m dwt and the dry bulk active fleethadFerriesgrownfrom 812m dwtto 835m dwt. Tonnageon order represented13.3%& Ro-paxRo-roCar carriersCruise vesselsof the active bulker fleet, broken down as follows:26Chemical carriersstainlessLNG carriersContractingin both2016 LPGandcarriers2017 was boostedbysteellarge orders for VLOCs to support the Brazilian ore trade201620172018(30x 405,000dwt VLOCs in 2016 and 2 x 405,000 dwtplus 33 x 325,000 dwt VLOCs in 2017).Bulk SummaryDeliveriesm dwt38.628.1Orderbookm dwt91.3111.4Active Fleetm dwt812.1835.611.24%13.33%53.469.158.5%62%m dwt5.95.8KoreaMarket share6%5%Japanm dwt27.932.9Market share31%30%Market shareContrary to previous years, China’s market share in this segment receded, fallingfrom 49% to 34%. This shortfall was snapped up by Korea, whose market shareclimbed from 25% to 34%. Japan’s share remained unchanged at 23%.In contrast to the bulker and tanker segments, container carrier deliveries rosein 2018 to 14.2m dwt in 2018 from 12.6m dwt in 2017. The active containercarrier fleet grew from 253m dwt at end 2017 to 266 m dwt at end 2018. Theorderbook represented about 11.3% of the active fleet at year end.12.44%22.117.1Market share29%24%m dwt31.535.7Market share42%50%m dwt15.413.3Market share20%18%Container Summary20172018Ordersm dwt8.113.3Deliveriesm dwt12.614.2Orderbookm dwt30.730.3Active Fleetm dwt253.5266.1Orderbook/Active FleetChinaKoreaJapan12.11%11.39%m dwt14.710.2Market share48%34%7.610.425%34%7.06.923%23%m dwtMarket sharem dwtMarket shareIt is interesting to note that there is basically no newbuilding activity in thesegments below 1,000 teu and between 4,000 and 10,000 teu.Existing Panamax and Kamsarmax: orderbook 24.6m dwt; fleet 166.9m dwt; ratio 14.7%Size range teu18,000-23,000 Capesize and Newcastlemax: orderbook 31.6m dwt; fleet 248.7m dwt; ratio 12.7%48.1In 2017, the focus was on Very Large Containerships (VLCS) with twogroundbreaking orders by MSC and CMA CGM for a total of twenty 23,500teu carriers (400m length overall and 61m beam). In 2018, Hyundai MerchantMarine ordered 12 x 23,000 teu VLCS at Daewoo shipyard. Supramax and Ultramax: orderbook 19.2m dwt; fleet 167.3m dwt; ratio 11.5% Post-Panamax and Babycape: orderbook 5.0m dwt; fleet 54.9m dwt; ratio 9.1%39.2It follows two highly volatile years: the complete collapse in orders in 2016,when just 3.0m dwt was contracted; and the vintage year of 2015 when 24.1mdwt was ordered, the third highest figure since 2000.13.22%m dwt Handysize and Handymax: orderbook 6.0m dwt; fleet 121.0m dwt; ratio 4.9%2018m dwtm dwt222017OrdersOrderbook/Active Fleet10HandyHandy2018NewOrdersANDfor SpecialisedVessels per YearORDERSORDERBOOKSChinaJapan VLCC: orderbook 31.6m dwt; fleet 226.5m dwt; ratio 13.9%-20162016Korea Aframax and LR2: orderbook 10.4m dwt; fleet 109.1m dwt; ratio 9.5%2018DeliveriesChina MR2: orderbook 8.3m dwt; fleet 74.9m dwt; ratio 11%2017Orders MR1: orderbook 0.1m dwt; fleet 19.5m dwt; ratio 0.5%12010Tanker Summary VLOC: 21.7m dwt; fleet 71.8m dwt; ratio 30.2%Chinese shipbuilders solidified their share of the dry bulk market at 62% in2018, while Japan’s market share slipped from 31% to 30%. Korean shipbuilders,who had previously been forced out of this market due to the prevailing lowprices, continued to hold around 5%.This was principally due to the VLOCs ordered by Korean shipowners Polaris,H-Line and Korea Line at Hyundai Heavy Industries backed by Vale employment.H-Line also ordered 3 Capesize bulkers at Hyundai shipyard, and the SM Group/Korea Shipping Corp ordered 2 Handysize bulkers at Dae Sun Shipyard.There was a steep decline in tanker (including chemical) orders at 25.4m dwtin 2018 (31.9m dwt in 2017). This is well below the average of 32.1m dwtrecorded since 2000. All sizes of tankers were affected except MR2 and to alesser extent LR1.BRS GROUP - Annual review 2019ships92Orderbookteu1,808,559ships46O/EOrders in 517,6443.1%53,280100-49919662,86511200.2%11205,284 22,321,0754202,774,15812.4%2001,223,170TotalBRS GROUP - Annual review 2019There was asteep decline intanker ordersPicture: PAUL A DESGAGNES, chemical/product tanker (IMO2), 15,100 dwt, delivered by Turkey’s Besiktas shipyard in 2018 to Groupe Desgagnes.11
SHIPBUILDINGSHIPBUILDINGORDERS AND ORDERBOOKSORDER CANCELLATIONS AND DEMOLITIONSHistorical LNG carriers ordersCbm20002,334,224NewOrdersfor 18In the specialised vessel segment, there was particular interest in LPG carriers,LNG carriers, ro-ros, ferries and cruise ships in 2018. Both LNG carriers andcruise vessels saw a 141record level of rs33.9129.875.946.620132014201531.215.111.6140.8 114.1 115.720162017201812.34.45.932.683.195.5Demolitions in 2018Others - 7%148 ShipsContainer - 5%48 ShipsDemolition prices in the Indian subcontinent rose sharply in 2018 and reachedan average of 420/LT for bulkers and 430/LT for tankers ( 350 and 375in 2017).orders for specialised vessels per year10080The average age of demolition climbed substantially in 2018, to 31 yearsfor bulkers (25 in 2017) and 23 years for container carriers (20 in 2017).However, the average age of tanker scrapped fell from 24 to 23 years.7560Going forward, the upcoming rules and regulations related to the Ballast WaterTreatment System (BWTS) and the 2020 sulphur cap will likely have a positiveimpact on demolition.4938403426m LNGLNGcarrierscarriersFerries& Ro-paxFerries& sCruisevesselsDeliveries2018Chemical carriersstainless steel (dwt)LPG carriers .1 150.1 162.2 152.4 51,47226,7681,182,7341,429,174LNG carriers 1,419,794Ferries & Ro-pax 21,47212,7708,58330,24660,53437,148114,740Car carriers e vessels 49,014Ro-ro (lm)2009LNG carriers sawrecord levelsof orderingDemolition ActivityOrders for specialised vessels2013* Incl. Chemical TankersDemolitions vs deliveries rrierssteelsteelstainlessBulk - 17%60 ShipsTanker* - 72%181 ShipsScrap prices for container carriers also rose, reaching an average of 445/LTversus 375/LT in 2017.N of ships122012Demolition activity declined in 2018 to 27.6m dwt from 31.7m dwt in 2017,reflecting the improvement in rates in most shipping markets. That trend wasaccentuated in the bulk and container carrier markets, where demolition plummetedfrom 14.3m dwt to 4.6m dwt and from 5.6m dwt to 1.3m dwt respectively. On thecontrary, tanker scrapping surged from 9m dwt to 19.7m dwt.Containershipno.ships2016201620118New Orders for Specialised Vessels per YearNew1202010DEMOLITION IN 20187425Aframax/ LR2 Panamax / LR1222009Bulk - 51%28 ShipsTanker* - 23%31 Ships28692018Container - 15%24 Ships12035903,550Others - 11%15 ShipsOrder cancellations - a potent sign of the crisis in the shipbuilding industry after2008 - fell to their lowest level in over a decade in 2017, at 4.4m dwt. 2018 sawa slight increase, at 5.9m dwt.m dwt1873,173,000Cancellations in 2018Orders vs cancellations (2009-2018)34223,903,963VLCCSuezmax2017per YearORDER CANCELLATIONS IN 201821320092015Orders and orderbooksfor specialised vesselsShipsPicture: WISBY PACIFIC, MR2 tanker, 49,686 dwt, built by GSI in 2018 for Wisby Tankers and on charter to Sweden’s Stena.N of ShipsChemical carriersstainless steelLPG carriers20162017201840262632434DwtscrappedAve Age ofscrapTankerScrap pricerange ( )DwtscrappedAve Age ofscrapContainerScrap pricerange ( )DwtscrappedAve Age ofscrapScrap pricerange ( 24421.36,148,82622424.2Ferries & 66,94528361.52,697,78822371.3355263738LNG carriersCar carriersCruise vesselsBRS GROUP - Annual review 07,34423445.8BRS GROUP - Annual review 201913
SHIPBUILDINGSHIPBUILDINGSHIPBUILDING CAPACITYDELIVERIES AND WORLDWIDE SHIPBUILDING CAPACITY IN 2017DELIVERIES AND WORLDWIDESHIPBUILDING CAPACITY IN 2018Total deliveries fell to 78.7m dwt in 2018, compared to 96.1m dwt in 2017.This was divided into 28.1m dwt of bulk carriers (38.6m dwt in 2017), 28.9mdwt of tankers (38.4m dwt) and 14.2m dwt of containerships (12.6m dwt).In China, annual shipbuilding production (which increased 63% between2006 and 2011 to reach a peak of 97.7m dwt) fell slightly from 38.5m dwtin 2017 to 34.5m dwt in 2018.In Japan, annual output (which declined 35% between 2006 and 2011 to45.1m dwt) inched down from 20.2m dwt in 2017 to 19.8m dwt in 2018.In South Korea, annual production (which rose only slightly by 2% between2006 and 2011 to 82.7m dwt) fell quite significantly from 30.8m in 2017 to19.0m dwt in 2018.It is interesting to note that the number of active building facilities (yardsthat either won new contracts and/or delivered tonnage during a given year)rose slightly in 2018 to 317, a sign of the additional demand. The numberof yards had previously fallen from a peak of 685 in 2007 to 310 facilitiesin 2017.The number ofactive yards roseslightly in 3.035.737.935.938.534.5South 25.022.421.121.620.219.8By contrast, increases were more targeted in 2017, when we saw hikes of15%-20% for larger bulkers, but more modest increases of 5%-10% for tankersof all sizes and smaller bulkers.We note that historically there is a certain correlation between newbuildingorders and deliveries, and that when the number of orders exceeds or is aboutto exceed the number of deliveries, prices tend to rise (see graph )World newanddeliveries(2000-2018)(Excluding offshore)HistoricalBuildingFacilitiespermain areasActive buildingfacilitiesper year& yearregion&(excludingoffshore)Million dwtMillion dwtN of facilitiesN of facilities800350685300700Million dwtMillion dwt300250When orders exceed deliveries,NB prices start to rise600250500200317150When ordersexceed deliveriesprices usually riseDue to increased demand, shipbuilders succeeded in raising newbuildingprices by some 10% across the board in 2018. This was less overall than in2017, but reflects a more even distribution of price rises.Ship deliveries in China, Korea & Japan (2008-2018)Deliveries (million dwt)NEWBUILDING PRICES IN 2018273400300100200When deliveries exceed orders,NB prices start to fall150NB pricesrise 002JAPANJapan200320032004200420052005SOUTH KOREASouth 0162017201720182018N of World Active ShipyardsN of facilitiesPicture: LA LOIRAIS, logger bulk carrier, 39,800 dwt, delivered by Jiangmen Nanyang in 2018 to LD Bulk.0rders2014201450020002000OrdersOrdersBRS GROUP - Annual review 20192001200120022002DeliveriesDeliveriesBRS GROUP - Annual review 20152015201620162017201720182018Newbuilding PricesPicture: STOLT EXCELLENCE, stainless steel chemical tanker, 38,000 dwt, delivered by Hudong Zhonghua in 2018 to Stolt Tankers.15
SHIPBUILDINGNEWBUILDING PRICES IN 2018Price rises weremore evenlydistributed in 2018Newbuilding prices (million )1993Low 4Q2002Peak 2Q2008End 2016China 1st tier**End 2016SK/JapanEnd 2017China 1st tier**End 2017SK/JapanEnd 2018China 1st tier**End 2018SK/JapanSHIPBUILDING IN THE uezmax634490-10050-5256-58535855/5964Aframax (A)LR245 (A)34 (A)70-75 (A)40-42 (A)42-44 (LR2)45-47 (A)47-49 (LR2)46 (A)48 (LR2)50 (A)52 (LR2)47 (A)48 (LR2)51 (A)55 (LR2)MR2 IMO 332,52748-5131-3334-35333634/3537Newcastlemax(205k 0k dwt)483690-10137-3847-52*464850/5255/57*Panamax (P)Kamsarmax (K)29 (P)21.5 (P)53-60 (K)23-2424-25*26.5 (K)28.5 (K)29/30 (K)34 (K)*Ultramax (U)Supramax (S)Handymax (H)25 (H)20 (S)47-50 (S)22-23 (U)19-20 (H)23-24 (U)*21-22 (H)*25.5 (U)23 (H)26.5 (U)24 (H)27/28 (U)31 (U)*BulkersShipbuilding in ChinaChina retained its position as the world’s leading shipbuilder in 2018, rankingnumber one in all three categories: the largest orderbook at 99.8m dwt (43%market share), the most newbuilding orders at 40.4m dwt (35% share), and thelargest number of deliveries, at 34.5m dwt (44% share).Chinese yards won some 20% more new orders in 2018 compared to 2017,while the other zones (Korea, Europe and Rest of World) registered a decrease.Japan was the exception in securing a remarkable 90% increase in new orders.It is interesting to note that 72% of Chinese orders were won by just 10shipyards out of a total 117 active facilities in 2018.* Japan only, ** Prices at China’s 2nd tier yards are an estimated 5% lowerMarket shareOrderbookSecond hand price evolution during 2018 for 5 year old vessels (million )Jan 201861.25VLCC16High63.41Low10 Dec2017China60.005 FebDec 2018Variation Jan- Dec63.253.2%Aframax29.3730.4226 Nov28.5010 Sep30.333.2%MR Tanker23.4926.4226 Nov23.258 Jan26.1111.1%Capesize32.8538.202 Jul32.408 Jan35.167.0%Panamax20.1621.8926 Jun20.162 Jan21.335.8%Supramax17.1018.5020 Aug17.102 Jan17.914.7%Picture: GOTHIA SEAWAYS, 6,700 lm on 7 decks plus 1 car deck. Delivered in January 2019 by Jinling Shipyard to DFDS and operated by DFDS.BRS GROUP - Annual review 2019OrdersDeliveriesm dwtShipsm 34117.1264Container14.723210.2209All 1083.885Container3.1652.781All 8.81623.7817.210638.552834.5502All shipsBRS GROUP - Annual review 2019Chinese shipbuilding output declined, however, in 2018to 34.5m dwt, down from 38.5m in 2017. However theratio orderbook/output rose from 2.4 at the end of 2017to 2.9 at the close of 2018.2018TankerContainerIn the dry bulk segment, China maintained its lead with32.6m dwt of new orders (about 70% of the global bulkorderbook). These ships represented 80% of China’s totalorder intake in 2018. In the tanker and containershipsegments, it had to settle for second place, with 15% (3.8mdwt) and 20% (2.7m dwt) respectively of world orders.72% of China'sorders were wonby just 10 yardsPicture: VISBORG, High Speed 30 knot ropax, 1,600 passengers, ice class 1A with Dual Fuel (LNG) Propulsion, delivered by GSI in 2018 to Sweden’s Gotlandsbolaget.17
Some newsworthy events of the year The world’s first VLCC with a wind-power auxiliarysail propulsion system was successfully delivered byDalian Shipbuilding (DSIC) in 2018. This is not only amajor innovation, but also a remarkable initiative thatunderlines cooperation between China’s shipbuildingand shipping industries. It is also another majorbreakthrough for DSIC and China Merchant Energ
Shipbuilding A promising rst half, an uncertain second one 5 VIIKKI LNG-fuelled forest product carrier, 25,600 dwt (B.Delta 25), built in 2018 by China's Jinling for Finland's ESL Shipping.