Transcription
Q2 2022 activity review& H1 2022 resultsWednesday 27th July 2022
DisclaimerThis document contains forward-looking statements. Any forward-looking statement does not constitute forecasts as defined in CommissionDelegated Regulation (EU) 2019/980. Forward-looking statements relate to expectations, beliefs, projections, future plans and strategies, anticipatedevents or trends and similar expressions concerning matters that are not historical facts. These forward-looking statements are based on SolocalGroup’s current beliefs, assumptions and expectations of its future performance, taking into account all information currently available. AlthoughSolocal Group’s management believes that the expectations reflected in such forward-looking statements are reasonable, investors are cautionedthat forward-looking statements are subject to various risks and uncertainties, many of which are difficult to predict and generally beyond thecontrol of Solocal Group, that could cause actual results and developments to differ materially from those expressed in, or implied or projected by,the forward-looking statements. These risks and uncertainties include those discussed or identified in the public filings made by Solocal Group withthe Autorités des marchés financiers (French Financial Market Authority) including, in particular, those listed under the section “Risk Factors” inSolocal Group’s universal registration document (document d’enregistrement universel). Solocal Group, its affiliates, directors, advisors, employeesand representatives expressly disclaim any liability whatsoever for such forward-looking statementsAll accounting data on an annual or half year basis is presented in the form of audited consolidated information. However, all accounting data on aquarterly basis is presented in the form of unaudited consolidated information. In Solocal results presentation and Solocal press release, SolocalGroup isolates continuing operations from discontinued operations. Financial performance indicators are commented on the scope of continuingactivities. Financial statement presented for 2021 and H1 2021 are reviewed in the light of the 30th June 2022 scope of continuing operations. Due torounding, numbers presented throughout this and other documents may not add up precisely to the total provided.All detailed financial indicators and data are published in the Consolidated Financial Statements Report as of 31st December 2021, available onwww.solocal.com (Investors and shareholders).P.2
Contents123Business update & strategic plan follow upP. 5H1 Financial ResultsP. 15Conclusion & Q&AP. 22
H1 2022 HighlightsPositive Model switch Renewal mechanism demonstrated its virtues over the semester Transformation process of ”Generalists” model well underway on acquisition & upsell / cross-sell(positive effects of new payplan )H1 2022 revenue decrease by -6.2% vs. H1 2021 Number of “hunters” lower than expected, negatively impacting business activity ARPA stable at 1,350 Customer base at 300k as at 30th June 2022, vs 304k as at 31 st March 2022 Adjustement of 2022 guidance, revenue & EBITDA expected at c.-5% vs. 2021Stable recurring EBITDA in H1 2022 at 55.8 million, i.e. 27.7% EBITDA margin (vs. 26.4% H1 2021)Cash repayment of the RCF, 10 million, as at 30th September, 2022P.4
Business update& strategic planfollow upHervé MilcentChief Executive Officer
Autorenewal impact on Solocal business modelMain drivers of the business modelTotal Order Intake1Majority of order intakes driven from « renewal »:H1 2021H1 2022RenewAcq/Cross/UpRenewal &Migration Virtuous effects of the subscription model Subject to churn2 management controlAn encouraging trend on the renewal allowing a focus itionGeneralistsHuntersAcquisition Order Intake1 TotalSalesforce’s main key driver based on: Ongoing development of hunter salesforce key for acquisition(60% of acquisition generated by field sales) Telesales dedicated to lower ARPA is now fully rolled-out andefficientOrder Intake: orders recorded by the salesforce, that gives rise to a service performed by the Group for its customers2 Churn rate calculation: nb of churned customers on a LTM basis / nb of customers
Customer satisfaction is the key pillar to manage churnChurn analysis in Q2 2022Churn1: 1 pt increasevs. Q1 2022 as expectedCohort’s effect thanks to the renew Renew of the first cohort of 24 months subscription’s customerin 2020 Contract cohort’s increase between H1 2021 and H1 2022 : 84%in volum (12 & 24 months)H1 2021Netchurn rate114.9%VS.Q1 2022 Q2 202113.7%13.9%First positive effects of customer satisfaction initiativesAcquisition 9%Value development 12%vs. Q2 2021vs. Q2 2021Support & requestRetention 11%vs. Q2 2021P.7H1 2022 21% Satisfaction survey2 sent duringthe customer’s journey Speech analytics rolled-outto analyze recorded calls andimprove customer’s interactionssince Q2 2022vs. Q2 20211 Churnrate calculation: nb of churned customers on a LTM basis / nb of customers2 General satisfaction grades from 0 to 5
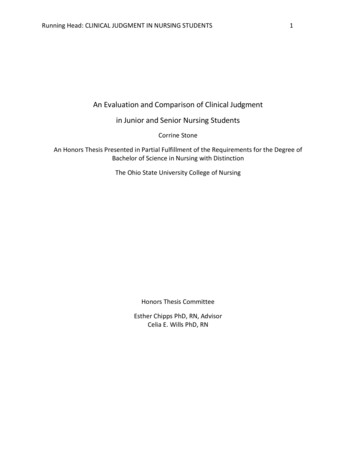
Slight erosion of customer base in Q2 2022Q2 2022 customer base overview1Customer base in Q2 202231/03/2022New customers(incl. winbacks)3Churn230/06/2022 300k customers vs. 304kas at 31st March 2022304k9k13k300k Level of new customersstill below expectations(9k nder: Q1 2022 customer base overview1Beginningof PeriodNew customers309k9kcustomersP.8(incl. winbacks)3customersChurn2Endof Period14k304kcustomersRetentionrate4c. 53%customers1 Group scoperate calculation: nb of churned customers on a LTM basis / nb of customers3 Winback: Acquisition of a customer who has been lost in the previous 12 months4 Nb of customers retained / nb of churn intentions2 Churn
Q2 2022: ARPA stable at c. 1,350ARPA evolution driverCustomer JourneyARPAAcquisition2ARPADIGITALQ2 2022 1.300c. 18%vs. Q1 2022Q1 2022 c. 1.360éARPAChurn2,3ARPA based on Group revenue1c. -1.4%vs. Q1 2022Q2 2021c. 1.320Q2 2022c. 1.350 ARPACross sell/ UpsellP.91 ARPA:Average Revenue per Advertiser, based on the last twelve months order intake for Solocal SA2 Based on order intake, Solocal SA customer base3 12 months equivalent
Increasing ARPA: illustration of field sales strategy on websites1Order intake1 - in volumeOrder intake1 - in valueField salesField salesQ1 20212 3 4Essentiel5Q2 20216Q1 20227 8 9 10Premium11Q2 202212 13 14Privilege15161Q1 20212 3 4Essentiel56Q2 20217 8 9PremiumQ1 20221011Q2 202212 13 isitionAcquisitionAcquisitionUpsell / cross-sellUpsell / cross-sellUpsell / cross-sellUpsell / cross-sellUpsell / cross-sellUpsell / cross-sell16 Field sales succeed in increasing ARPA thanks to upsell & cross-sell especially on “Premium” &“Privilege” websites Field sales benefit from dedicated onboarding to assist customersP.101 TotalOrder Intake: orders recorded by the salesforce, that gives rise to a service performed by the Group for its customers
EXECUTIONTRUSTStrategic plan follow-up over H1 20221Performance management2A strengthened management at a local levelBusiness performanceCompensation plan projectHR partnership3Sales CampusWelcome process & targeted trainingP.11Execution regionsStaffingON GOINGGoal at c. 190 huntersAs at end of July: 154 hunters in the salesforce4Methods & toolsNew methods & tools to supportacquisition activity
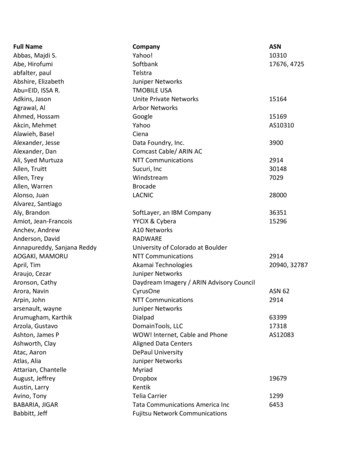
EXECUTIONTRUSTOngoing salesforce transformation program (1/2)Focus on Hunters field salesFocus on Generalists field salesField Salesforce (number of FTEs)Goal : 190 hunters89136154216198400212H1 2021A31st Dec. 202031st Dec. 2021Generalists31st March 2022 31st July 2022 (e)MigrationH2 2021AH1 2022Order intake excl. migrationHunters First positive effects of the new payplan roll-out Hunters (number of FTEs): not yet up to expectations Salesforce impacted by turnover due to a tough marketcontextP.12 Business developpement (acquisition/upsell/cross-sell) fullyoffsetting renewal Pure acquisition increasing but still below expectations Encouraging trend of the shift to the new business model
EXECUTIONTRUSTOngoing salesforce transformation program (2/2)H1 2022 Productivity geographical coverage1H1 2022 Productivity geographical coverage1HuntersGeneralistsProductivity x 3Region 1Region 2Region 3Region 4Productivity x 1.5Region 5Region 2Region 3Region 4Region 5Region 6Q1 weekly order intakePower zoneQ1 weekly order intakePower zoneQ2 weekly order intakeUnderperforming zoneQ2 weekly order intakeUnderperforming zoneHunters performance: Improved productivity across all regions (« power zone »& « underperforming zone ») Strong disconnect between the « Power zone »& « Underperforming zone »P.13Region 1Region 61 BasedGeneralists performance: Appropriation of the current model: strong performance on upsell& cross-sell but still below expect on acquisitionHistorical local footprint performanceon average weekly total Order Intake (orders recorded by the salesforce, that gives rise to a service performed by the Group for its customers) / Total FTI (Fieldsales)
EXECUTIONTRUSTH1 2022 Strategic plan follow upPHYSICAL SUPPORTBacked byFor new customersphygital approachCustomer Success Manager Systematic customer onboarding& more regular training A unique interlocutor, with steps frombeginning to end of customer journeyIn progress Easy access to performance in termsof digital exposureNew dashboards rolled-out300k customers &prospectsCustomer Care ManagerIn progressRELEVANCE & ACCURACYTRUSTUSER EXPERIENCEMore transparencyEnhanced performance Brand new app Optimized search engine for best results Quality scoringIn progress User generated contentIn progressP.14For all customers More impactful & comprehensible KPIsFor existing customers Handle customer questions, requests& complaints according to SolocalstandardsDIGITAL SUPPORTPageJaunesend users Professionals badges displayed PagesJaunes label to distinguishbest professionalsIn progress
H1 FinancialResultsOlivier RegnardChief Financial Officer
Q2 2022 revenue decrease by -1.7% quarter on quarterRevenue(in million -1.7%107.9-7.5%Revenue1 down by -7.5%, as a result of: Salesforce performance below expectationsfor H1 2022; Unfavourable product mix (websites vsbooster contact, low performance of largeaccount)Evolution of revenue20.6%-16.3%Q2 2020P.16-13.6%Q3 20200.4%6.4%-4.8%-10.2%-7.5%-16.7%Q4 2020Q1 2021Q2 2021Q3 20211Q4 2021Q1 2022% calculation based on Solocal SA order intake in value terms2 Revenue quarter n vs. quarter n-1Q2 2022
Overview of Solocal revenueConnect1Websites2Booster3TOTALH12022 72.4m 30.5m 98.3m 201.2mH12021 61.8m 31.3m 121.4m 214.6mChange 17.1%-2.6%-19.0%-6.2%Connect Access, Essentiel, Premium, Marketing Digital, Vocal, MDOffline2 Websites Essentiel, Premium, Privilege, Websites DIY Websites3 Booster Display / Adhesive, Booster Contact, Booster Site, Social, Local impact, Ranking1P.17
Stable order backlog1 at 240 m and 339 m of secured revenue for 2022Order backlog1(in r backlog1 stable,-(1.1%) vs. 31st March 2022Conversion of order backlog into revenueH2 2022 240.0 m 2023202459,5%36,6%Q2 revenue of 201.2m3,9% 138.2mSecured revenue2 for 2022 of 339.4 m as at 30.06.2022(vs 364.9 m as at 30.06.2021 still not fully comparable due to the change in business model)P.181 Calculatedas order backlog at end of previous period order intake of the quarter –revenue of the quarter2 / - cancellations & other effects as per management best estimate
56m recurring EBITDA in H1 2022In millionTotal RevenueH1 2021H1 2022Change Change (13) m revenue decrease in H1 2022 vs. H1 2021, offset bycosts reduction by 13 m coming from:214.6201.2(13.4)-6.2%External expenses(58.6)(55.1)(3.5)-6.1%- (9)m significant savings in staff costsPersonnel %c. (4)m of external expenses, driven by spend mediaand a strict cost monitoringNon-recurring items5.90.8(5.1)n.a.Consolidated ing income34.128.8(5.3)-15.6%Financial income(14.0)(14.4)(0.3) 2.3%Income before 7)-5.7%Recurring EBITDADepreciation and amortisationCorporate income taxConsolidated Net income GroupP.19 55.8 m flat recurring EBITDA 27.7% recurring EBITDA margin at in H1 2022 c. 28.8m operating Income Financial Income: - (9)m financial interest on RCF, Bonds and other loans- (2)m IFRS 16 impact (rents)- (2.8)m of non-cash amortisation of borrowingsCorporate income tax includes IS & CVAE
15m Recurring Operating Cash Flow in H1 2022In millionH1 2021H1 - Of which change in receivables(0.8)(2.3)(1.5)- Of which change in 4.325.6(8.7)Non-recurring items(7.3)(1.6)5.7Disbursed financial 2.8(8.3)-(2.0)(2.0)0.7-(0.7)(12.2)(8.6)3.6Net change in cash9.62.1(7.5)Net cash & cash equivalents BoP61.480.218.8Net cash & cash equivalents EoP71.082.311.3Operating free cash flows (including IFRS 16)317.015.4(1.6)Recurring EBITDA1Non-monetary items included in EBITDANet change in working capital- Of which change in other WCR itemsAcquisitions of tangible and intangible fixed assetsRecurring operating free cash flowCorporate income tax paidOthersFree cash flowIncrease (decrease) in borrowingsCapital increaseOthersP.203 Negative net change in WCR of (15)m- (3)m change in customers receivables;-Change in other WCR items includes (4)m fromsocial & fiscal liabilities repayment (French State)vs (2)m in H1 2021 Capital expenditure: 15 m Cash out interest: Bonds (7.6)m, RCF (1.1)m and BPIloan (0.4)m Decrease in borrowings: BPI repayment (2)m “Others” corresponds to rents (IFRS 16 impact) 82.3m of cash position end of June 2022Operating Free Cash Flows: recurring EBITDA (including IFRS 16 Rents) non monetary items included in EBITDA Change in WCR – Capex - non recurring items
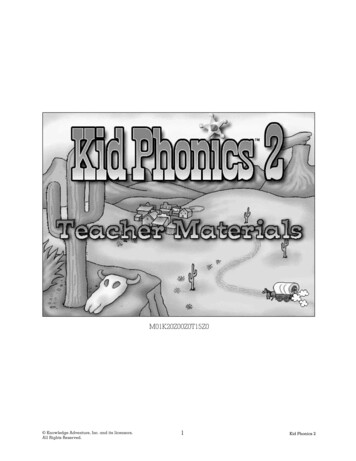
Focus on debt structure31st Dec202130th June2022Gross debt255253Cash8082Net debt175171Covenant EBITDA3105107Financial leverage1.7x1.6xISCR5.3x5.2xIn million eurosRCF 44 mBondsreinstated1 173 mNewly issued bonds2 18 m“Prêt ATOUT” loan 13 mOthers 5 mHeadroom30th June 2022 Consolidated Net Leverage ratio3 (Consolidated net debt / Consolidated EBITDA) 3.5x54% Interest Service Coverage ratio3 (Consolidated EBITDA / Consolidated Net Interest Expense) 3.0x75% 10 m full cash repayment of the RCF (max. mandatory repayement)P.212 Out1 Out of which 4.8m PIK interests fungible within the Bonds’ nominal as at 15.06.2022of which 604k PIK interests fungible within the newly issued Bonds’ nominal as at 15.06.20223 Calculated in accordance with the Bonds documentation
ConclusionHervé MilcentChief Executive Officer
Conclusion2022, a consolidation year Transition completed (renewal/ subscription mode) Subscription mode mechanism confirmed and stabilized Ramp-up of « hunters » model slower than expected (retention issues) Adjustment of Solocal revenue 2022 outlook, at -5% vs 2021 revenue 2022 Recurring EBITDA c. -5% vs 2021 thanks to strict cost monitoring Operating free cash flows1 expected at c. 30m, for 2022 Solid cash positon of 82 m as at 30th June 2022 & net leverage ratio2 of 1.6xOutlook P.23Solocal’s mid-term strategic plan remains unchanged. Mid term objectives will be updated at year-end1 Operating free cash flow Ebitda (including IFRS 16 rents) non-monetary items change in WCR – capex2 Calculatedin accordance with the Bonds documentation
Q&A
Connect1 Websites2 Booster3 TOTAL H1 2022 72.4m 30.5m 98.3m 201.2m H1 2021 61.8m 31.3m 121.4m 214.6m Change 17.1% -2.6% -19.0% -6.2% Overview of Solocal revenue P.17 1 Connect Access, Essentiel, Premium, Marketing Digital, Vocal, MDOffline 2 Websites Essentiel, Premium, Privilege, Websites DIY Websites