Transcription
Steeden et al. Journal of Cardiovascular Magnetic x(2020) 22:56TECHNICAL NOTESOpen AccessRapid whole-heart CMR with single volumesuper-resolutionJennifer A. Steeden1*, Michael Quail1,2, Alexander Gotschy2,3, Kristian H. Mortensen2, Andreas Hauptmann4,5,Simon Arridge4, Rodney Jones1 and Vivek Muthurangu1AbstractBackground: Three-dimensional, whole heart, balanced steady state free precession (WH-bSSFP) sequences providedelineation of intra-cardiac and vascular anatomy. However, they have long acquisition times. Here, we proposesignificant speed-ups using a deep-learning single volume super-resolution reconstruction, to recover highresolution features from rapidly acquired low-resolution WH-bSSFP images.Methods: A 3D residual U-Net was trained using synthetic data, created from a library of 500 high-resolution WHbSSFP images by simulating 50% slice resolution and 50% phase resolution. The trained network was validated with25 synthetic test data sets. Additionally, prospective low-resolution data and high-resolution data were acquired in40 patients. In the prospective data, vessel diameters, quantitative and qualitative image quality, and diagnosticscoring was compared between the low-resolution, super-resolution and reference high-resolution WH-bSSFP data.Results: The synthetic test data showed a significant increase in image quality of the low-resolution images aftersuper-resolution reconstruction. Prospectively acquired low-resolution data was acquired 3 faster than theprospective high-resolution data (173 s vs 488 s). Super-resolution reconstruction of the low-resolution data took 1 s per volume. Qualitative image scores showed super-resolved images had better edge sharpness, fewer residualartefacts and less image distortion than low-resolution images, with similar scores to high-resolution data.Quantitative image scores showed super-resolved images had significantly better edge sharpness than lowresolution or high-resolution images, with significantly better signal-to-noise ratio than high-resolution data. Vesseldiameters measurements showed over-estimation in the low-resolution measurements, compared to the highresolution data. No significant differences and no bias was found in the super-resolution measurements in any ofthe great vessels. However, a small but significant for the underestimation was found in the proximal left coronaryartery diameter measurement from super-resolution data. Diagnostic scoring showed that although super-resolutiondid not improve accuracy of diagnosis, it did improve diagnostic confidence compared to low-resolution imaging.Conclusion: This paper demonstrates the potential of using a residual U-Net for super-resolution reconstruction ofrapidly acquired low-resolution whole heart bSSFP data within a clinical setting. We were able to train the networkusing synthetic training data from retrospective high-resolution whole heart data. The resulting network can beapplied very quickly, making these techniques particularly appealing within busy clinical workflow. Thus, we believethat this technique may help speed up whole heart CMR in clinical practice.Keywords: Super-resolution, Whole-heart imaging, Machine learning, Rapid imaging, Convolutional neural network* Correspondence: jennifer.steeden@ucl.ac.uk1UCL Centre for Cardiovascular Imaging, Institute of Cardiovascular Science,University College London, 30 Guildford Street, London WC1N 1EH, UKFull list of author information is available at the end of the article The Author(s). 2020 Open Access This article is licensed under a Creative Commons Attribution 4.0 International License,which permits use, sharing, adaptation, distribution and reproduction in any medium or format, as long as you giveappropriate credit to the original author(s) and the source, provide a link to the Creative Commons licence, and indicate ifchanges were made. The images or other third party material in this article are included in the article's Creative Commonslicence, unless indicated otherwise in a credit line to the material. If material is not included in the article's Creative Commonslicence and your intended use is not permitted by statutory regulation or exceeds the permitted use, you will need to obtainpermission directly from the copyright holder. To view a copy of this licence, visit http://creativecommons.org/licenses/by/4.0/.The Creative Commons Public Domain Dedication waiver ) applies to thedata made available in this article, unless otherwise stated in a credit line to the data.
Steeden et al. Journal of Cardiovascular Magnetic Resonance(2020) 22:56BackgroundThree-dimensional whole heart, balanced steady statefree precession (WH-bSSFP) imaging is an importantpart of the cardiovascular magnetic resonance (CMR)imaging protocol in congenital heart disease [1]. This isbecause WH-bSSFP provides excellent delineation ofboth intra-cardiac and vascular anatomy. However, WHbSSFP sequences are usually cardiac triggered and respiratory navigated, resulting in long acquisition times(up to 10 min).Significant speed-ups can be achieved through the useof non-Cartesian sampling (i.e. spiral [2] or radial [3]) ordata under-sampling with state-of-the-art reconstructionstrategies (i.e. compressed sensing [4]). Unfortunately,these methods require major sequence modificationsand are often handicapped by long reconstruction times,even with the use of modern computing (i.e. graphicsprocessing units [5]). An alternative approach is singlevolume super-resolution reconstruction (SRR), wherehigh-resolution features are recovered from rapidly acquired low-resolution data. The benefits of SRR is that itcan be performed as a simple post-processing step without any sequence modification. However, conventionalalgorithms often produce unrealistic looking images,limiting the utility of this method [6]. Recently, machine learning has transformed SRR with the abilityto produce realistic high-resolution images from lowresolution data [7–9].In this study, we use a deep-learning SRR approach toreconstruct high-resolution data from rapidly acquiredlow-resolution WH-bSSFP images. This was achieved byfirst creating a ‘synthetic’ low-resolution training dataset from a library of reference standard high-resolutionWH-bSSFP images. The paired data were then used totrain a convolutional neural network (CNN) to map between low-resolution and high-resolution images (superresolution). The aims of this study were to: i) Assess theaccuracy of deep learning single volume SRR for recovering high-resolution data from synthetically downsampled WH-bSSFP data, ii) Assess the robustness ofthe resultant network, at recovering high-resolution datafrom different resolution input data, iii) Assess the feasibility of using deep learning single volume SRR for reconstruction of prospectively acquired low-resolutionWH-bSSFP data, and iv) Compare acquisition time,image quality, accuracy of vessel diameter measurementsand diagnostic value from single volume SRR, comparedto low-resolution and reference standard high-resolutionWH-bSSFP images.MethodsNetwork architectureThe CNN architecture chosen to perform SSR in thisstudy was based on a residual U-Net. This architecturePage 2 of 13has been previously shown to be robust in many applications, such as deep artefact suppression of real-time cineCMR data [10] and ventricular segmentation [11–13]. Aresidual U-Net is a multi-scale CNN where images aresequentially down-sampled and then up-sampled withthe network learning the difference between the inputand desired output (residual) rather than the desiredoutput directly [14]. In a residual U-Net, the learnt residual is added to the input data to produce the finaloutput data [15]. In this study, a 3D residual U-Net wastrained with paired high-resolution ‘ground truth’ dataand corresponding synthetic low-resolution images(Fig. 1). This network structure was chosen for the finalimplementation as it was found to be more accuratethan a conventional U-Net for this application (see Additional file 3). Each convolutional layer had a filter sizeof 3x3x3 and was equipped with a rectified linear unit asnonlinearity, except the last layer that produced the residual update. We used a smaller network size than theclassical U-Net architecture to avoid overfitting and lossof generalizability. The filters were equally weighted inall domains and hence no directions were favoured inthe training process. The output of the network was projected to positive numbers by a rectified linear unit toenforce non-negativity.Preparation of synthetic training dataThe synthetic training data was created from conventional high-resolution WH-bSSFP data (without any obvious artefacts due to breathing or arrhythmia) collectedfrom previously scanned children and adults with paediatric heart disease or congenital heart disease. The training data set contained 500 3D WH-bSSFP images (26 13 years, range: 5–80 years. Male: n 299. Heart rate:67 9 bpm, range: 41–86). A full list of diagnoses can befound in Additional file 1. Sequence parameters for thecardiac triggered, respiratory navigated high-resolutionWH-bSSFP sequence are shown in Table 1.Using these 500 data sets, low-resolution data was created by simulating 50% slice resolution and 50% phaseresolution. The first step was to crop/pad the highresolution data to a 256 256 matrix with 96 slices, tomake the data consistent for training. This was followedby Fourier transform to produce a synthetic k-space.The outer 50% of k-space in the slice and phase encodedirection were then zeroed, simulating two-fold downsampling of the data in both directions. In addition, 75%partial Fourier in both the slice and phase encoding directions was simulated by further asymmetric zeroing ink-space. The resultant simulated k-space was then inverse Fourier transformed back to image space, and theabsolute value taken. This produced the synthetic lowresolution data whilst maintaining a matrix size of256x256x96. Both the high- and low-resolution whole
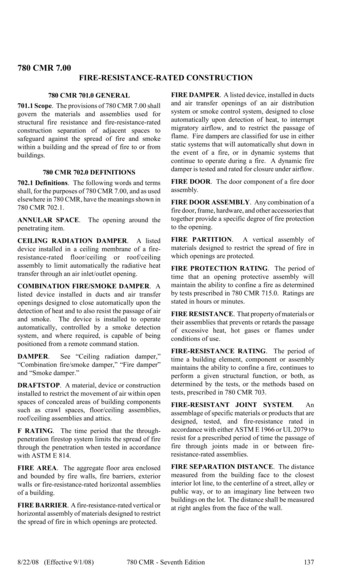
(2020) 22:56Steeden et al. Journal of Cardiovascular Magnetic ResonancePage 3 of 13Fig. 1 Network architecture. Chosen residual U-Net architecture used for 3D single volume super-resolution. The input is given by the lowresolution WH-bSSFP images. The numbers on top of the blue bars denote the number of channels for each layer. The resolution for eachmultilevel decomposition is shown on the left. Each convolutional layer is equipped with a Rectified Linear Unit as nonlinearity, givenby ReLU(x) max(x,0)Table 1 Imaging parameters. Imaging parameters for the training/testing of the network, as well as prospective dataOrientationHigh-resolution WH-bSSFPLow-resolution WH-bSSFPSagittalSagittalMatrix (kx-ky) 256 144 256 72Acceleration in ky 2 (GRAPPA) 2 (GRAPPA)GRAPPA reference lines2424Partial-Fourier in ky6/86/8FOV x-y (mm) 400 238 400 238Slices 96 48Slice thickness (mm) 1.6 3.2Partial-Fourier in kz6/86/8FOV z (mm) 154 154Flip angle (deg)90o90oTE/TR (ms) 1.6/ 3.6 1.6/ 3.6Bandwidth (Hz/Pixel) 592 592Lines per segment 30 30Cardiac triggeringYesYesRespiratory navigatorYes (window 3 mm)Yes (window 3 mm)Spatial resolution (mm) 1.6 1.6 1.6 1.6 3.2 3.2Temporal resolution (ms) 108 108Total acquisition time (mins) 8.1 (range: 3.3–14.8) 2.9 (range: 1.1–5.0)
Steeden et al. Journal of Cardiovascular Magnetic Resonance(2020) 22:56heart data were further cropped to a 192 192 matrix,in all 96 slices, to constrain the learning problem to theanatomy of interest (heart). Finally, each 3D data set wasnormalized to have signal intensities in the range [0, 1].All processing required for creation of the synthetictraining data was performed in MATLAB (2016b, TheMathWorks, Inc., Natick, Massachusetts, USA). A flowdiagram of the steps necessary to create the syntheticdata is included in Additional file 2.Network training and validationImplementation and training of the U-Net was done inPython with TensorFlow [16]. We minimised the ℓ1-lossof the reconstructed volume to the desired ground truth,as this was found to be more accurate than the ℓ2-lossfor this application (see Additional file 3). The trainingwas done for 200 epochs with the Adaptive Moment Estimation algorithm (ADAM) [17], with an initial learningrate of 10 3 and batches of two volumes. The total training time for each network took 38 h on a Titan XPGPU (NVIDIA Corporation Santa Clara, California,USA) with 12Gb memory.The trained network was validated with synthetic testdata created in the same way as the training data. Thesynthetic test data consisted of 25 previously scannedchildren and adults with paediatric heart disease or congenital heart disease. These patients were not includedin the training data set (27 12 years, range: 10–51.Male: n 13. Heart rate: 69 9 bpm, range: 52–85 . A fulllist of diagnoses can be found in Additional file 1). Theresulting super-resolved data were compared to theground truth, high-resolution data using mean squareerror (MSE) and Structural Similarity Index (SSIM).GeneralisabilityThe SRR network was specifically trained to superresolve a given low resolution data set. Therefore, wewanted to assess the robustness of the trained networkto inputs with different resolutions of the syntheticdown-sampled data. To do this, we used the 25 synthetictest data sets, described above. We simulated resolutionsfrom 10% slice and phase resolution to 100% slice andphase resolution, in increments of 10%. The test datawas created as described above, but with varying amountof zeros used in the outer portions of k-space in the sliceand phase encode direction. The resulting superresolved data were compared to the ground truth, highresolution data using MSE and SSIM. The results ofthese analyses were averaged over the entire volume foreach patient.Prospective clinical studyForty children and adults with paediatric or congenitalheart disease referred to our centre for clinical CMRPage 4 of 13were included in the prospective part of the study duringSeptember and October 2019 (27 14 years, range: 11–64. Male: n 20. Heart rate: 68 11 bpm, range: 45–95 .A full list of diagnoses can be found in Additional file 1).Exclusion criteria were: i) Significant metal artefact dueto implanted medical devices, and ii) Arrhythmia. All patients were imaged on a 1.5 T CMR scanner (Avanto,Siemens Healthineers, Erlangen, Germany) with vectorelectrocardiographic (VCG) gating. Low-resolution WHbSSFP data (spatial resolution; 1.6 3.2 3.2 mm) andhigh-resolution WH-bSSFP data (spatial resolution; 1.6 1.6 1.6 mm) were both acquired with cardiac triggeringand respiratory navigation, in all subjects (see Table 1 foracquisition parameters). The trained network was thenused to perform super-resolution reconstruction on thelow-resolution data to produce data with a spatial resolution of 1.6 1.6 1.6 mm.The use of retrospectively collected training and testdata, as well as collection of prospective whole heartdata was approved by the local research ethics committee, and written consent was obtained from all subjects/guardians (Ref: 06/Q0508/124).Analysis of prospective dataVessel diameters, as well as quantitative and qualitativeimage quality, were measured on both the lowresolution and super-resolutionWH-bSSFP data andcompared to reference standard high-resolution WHbSSFP data. All measurements were made using inhouse plugins for the OsiriX open source DICOM viewing platform (Osirix v.9.0, OsiriX Foundation, Geneva,Switzerland) [18]. For all analysis, the observers werepresented with each anonymized data set (including repeated volumes for intra-observer variability) in a randomised order, blinded to diagnosis, patient number andtype of sequence.Vessel diameter measurementsDiameters were measured manually by two CMR specialists (M.Q. and A.G.) from multi-planar reformats(MPR’s) of the ascending aorta (AAo), descending aorta(DAo), main pulmonary artery (MPA), right pulmonaryartery (RPA), left pulmonary artery (LPA) and proximalleft coronary artery (LCA). Each clinician was the primary observer for 20 unique patient data sets, of which10 were re-evaluated to assess intra-observer variability.In addition, each observer assessed 10 patient data setsfrom the other primary observer, to evaluate interobserver variability. Thus, each observer scored andprocessed 40 patient data sets. Overall 20 patient datasets were used to evaluate intra-observer variability andthe other 20 patient data sets used to evaluate interobserver variability. For each vessel, two perpendicular
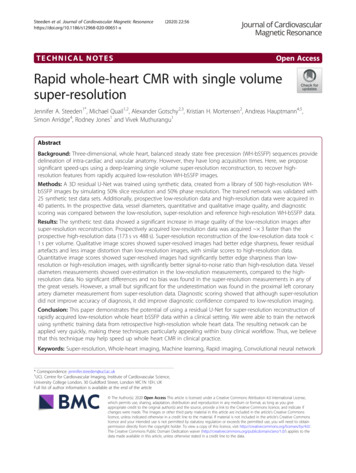
Steeden et al. Journal of Cardiovascular Magnetic Resonance(2020) 22:56diameter measurements were made, and the average wasused for all further analyses.Diagnostic accuracy and confidenceIdentification of abnormal anatomy was performed bythree independent clinical observers (M.Q., A.G. andK.M.). Patients were selected from the prospective cohort if they had congenital heart disease, resulting in 21patients being assessed (27 14 years, range: 11–64.Male: n 20. Heart rate: 68 11 bpm, range: 45–95. Afull list of diagnoses can be found in Additional file 1).Each clinician viewed the high-resolution, lowresolution and super-resolution 3D WH-bSSFP data in acompletely randomised order to identify the presence ofthe following abnormalities: 1) MPA stenosis, 2) RPAstenosis, 3) LPA stenosis, 4) Right coronary artery (RCA)abnormality (course or stenosis), 5) Left coronary arteryabnormality (course or stenosis), 6) Coarctation of theAorta, 7) Abnormal Aortic Arch anatomy (including presence of large aorta-pulmonary collaterals) and 8) Ventricular septal defect. Each abnormality was scored on a 5point Likert scale (1 Definitely not present, 2 Probablynot present, 3 Unclear, 4 Probably present, 5 Definitely present), allowing evaluation of both diagnostic accuracy and confidence. For diagnostic accuracy (sensitivityand specificity), scores of 1 and 2 were coded as absent,and 4 and 5 were coded as present. A score of 3 was codedas a misdiagnosis. For diagnostic confidence, scores of 1and 5 were coded as 2 (high confidence), score 2 and 4were coded 1 (intermediate confidence) and a score of 3was coded as 0 (low confidence).Qualitative and quantitative image qualityThe MPR data for the great vessels (AAo, DAo, MPA,RPA and LPA) was graded on a 5-point Likert scale inthree categories: sharpness of vessel borders (1 nondiagnostic, 2 poor, 3 adequate, 4 good, 5 excellent), image distortion (1 non-diagnostic, 2 severe,3 moderate, 4 mild, 5 minimal), and residual artefacts (1 non-diagnostic, 2 severe, 3 moderate, 4 mild, 5 minimal).Vessel edge sharpness (ES) was also calculated fromthe great vessel MPR’s by measuring the maximum gradient of the normalized pixel intensities across theborder of the vessel of interest as previously described[19]. Edge sharpness was calculated in 60 positionsaround the vessel, and the average value was used forcomparison.Estimated signal-to-noise ratio (eSNR) and estimatedcontrast-to-noise ratio (eCNR) were assessed in a midthoracic slice that included blood pool, ventricular myocardium and lung. eSNR was calculated as the ratio ofaverage blood signal intensity to the average noise signalintensity, taken in the lungs [20]. eCNR was calculatedPage 5 of 13as the ratio of blood signal intensity to average myocardial signal intensity [20].StatisticsStatistical analyses were performed by using the R software (Rstudio, v.3.5). Comparisons of continuous variables (vessel diameters, edge sharpness, eSNR andeCNR) across of all three groups was performed usingone-way repeated measures analysis of variance(ANOVA) with post hoc testing using Holm correctionfor significant results. Comparison of Likert data wasperformed using the Friedman’s test with post-hoc testing using the Nemenyi test for significant results. TheFriedman’s test with post-hoc Nemenyi comparisonswas also used to compare diagnostic confidence scores.Inter and intra-observer variability was assessed usingone-way intraclass correlations (ICC), displayed withtheir 95% confidence intervals. Comparison of acquisition time between the high-resolution and lowresolution WH-bSSFP sequences was performed using apaired t-test. For assessment of agreement of diametermeasurements, the high-resolution WH-bSSFP data wasused as the reference standard for Bland-Altman analysis. Sensitivity and specificity were calcaulted and displayed with their 95% confidence intervals. Interobserver agreement for identification of lesions wasassessed using Fleiss’s Kappa. A p-value of less than 0.05indicated a significant difference.ResultsNetwork validationFigure 2 shows examples of original high-resolutiondata, simulated low-resolution data and accompanyingsuper-resolved data. Due to the simulated downsampling, the low-resolution data had a SSIM of0.87 0.02, and a MSE of 1.28 0.57 10 3, compared to the high-resolution data. After SSR, theSSIM significantly increased (p 0.05) to 0.96 0.01and the MSE significantly decreased (p 0.05) to0.68 0.45 10 3. This demonstrates that SSR enablesrecovery of features lost in the low-resolution simulation. Additional file 3 shows the same synthetic tests,as trained with alternate network structures, demonstrating the residual U-net, with an ℓ1-loss functiongave the best results.GeneralisabilityFigure 3a and b show that SSIM is highest and MSE islowest when the input data has the same resolution asthe data used for training (50% phase and slice resolution. This can be seen visually in Fig. 3c – at lowerresolutions, the network is unable to recover high resolution features resulting in significantly blurred images.
Steeden et al. Journal of Cardiovascular Magnetic Resonance(2020) 22:56Page 6 of 13Fig. 2 Synthetic test data. Example image quality from the synthetic test data in three patients. Left: Original high-resolution WH-bSSFP data,Middle: Simulated low-resolution WH-bSSFP data, Right: Resulting super-resolved dataAt higher resolutions, the network created artificiallysharp edges in the resultant images (Additional file 4shows a table of the results).In-vivo studyHigh-resolution and low-resolution WH-bSSFP datawere successfully acquired in all 40 patients. Total acquisition time for high resolution WH data (488 138 s,range: 200 to 889 s) was significantly (p 0.05) higherthan the low resolution-WH data (173 54 s, range: 66to 302 s). The average speed-up in acquisition time was 2.9 0.8 (range: 1.5 to 5.4).SSR was successfully applied to all low-resolutionWH-bSSFP data sets. The network took 0.7 s to perform super-resolution per volume (on a Titan XPGPU with 12Gb memory). Representative images areshown in Figs. 4 and 5. It can be seen that imagesharpness is improved between the low-resolutiondata and the super-resolution reconstruction. This isparticularly evident in small vessels, such as the coronary arteries (Fig. 5).Quantitative vessel diameter measurementsVessel diameters measured from high-, low- andsuper-resolution data are shown in Table 2. Figure 6shows the Bland-Altman plots for all great vesselscombined, as well as the Bland-Altman plot forthe LCA. The Bland-Altman plots for the individualgreat vessels shown in Additional file 5. A small butsignificant overestimation was found in the AAo,DAo, RPA diameters using the low-resolution datacompared to the high-resolution data, and a trend foroverestimation in the MPA diameter. The proximalleft coronary artery diameter measurements alsoshowed a significant overestimation using the lowresolution data compared to the high-resolution data,of 0.3 mm representing 8% overestimation. Therewere no significant differences between the highresolution and super-resolution data in the great vessels. However, in the proximal LCA a small but significant underestimation of vessel diameter was seenin the super-resolved data compared to the highresolution data (of 0.1 mm, 3%).
Steeden et al. Journal of Cardiovascular Magnetic Resonance(2020) 22:56Page 7 of 13Fig. 3 Generalisability tests. Results from the generalisability tests performed on 25 synthetic test data sets. Agreement of super-resolved imageswith the reference high-resolution WH-bSSFP images at different amounts of down-sampling of the input data; a SSIM, b MSE. c Example lowresolution images at different amounts of down-sampling (input to network), the super-resolved results from the network, and the error mapscomparing the super-resolved images to the truth images. See Additional file 4 for full resultsThe inter-observer and intra-observer ICC’s are shownin Table 3. The largely overlapping confidence intervalsdemonstrated that there were no significant differencesin inter-observer and intra-observer variability betweenany of the techniques in any of the vessels.Diagnostic accuracy and confidenceThe sensitivities and specificities for detection of any lesion were similar in the high resolution -WH (sensitivity:0.74, CI: 0.63 to 0.83, specificity: 0.94, CI: 0.91 to 0.96),low resolution WH (sensitivity: 0.71, CI: 0.61 to 0.81,specificity: 0.86, CI: 0.83 to 0.90) and super resolution WH (sensitivity: 0.73, CI: 0.62 to 0.82, specificity: 0.91,CI: 0.88 to 0.94), with largely overlapping confidence intervals. This was also true for each individual lesion (seeAdditional file 6). In addition, there was no significantdifference the detection of lesions between observers(kappa 0.15 / 0.09 / 0.13 for HR- WH, LR- WH andSR respectively, p 0.05). See Additional file 6 for individual lesions.The highest confidence was found with high resolution WH (1.84 0.44), followed by super resolution WH (1.74 0.56) andlow resolution WH (1.59 0.66). The difference between high resolution WH andsuper resolutionWH was not significant (p 0.2), however there was a significant difference between the high
Steeden et al. Journal of Cardiovascular Magnetic Resonance(2020) 22:56Page 8 of 13image quality with the high-resolution data. However, asignificant improvement was seen in terms of sharpnessof vessel boarders and image distortion compared to thelow-resolution data.Quantitative analysis showed that the edge sharpness ofthe low-resolution data was significantly worse than thehigh-resolution. After super-resolution, the edge sharpness was significantly better than either the low-resolutionor high-resolution data. The eSNR of the low-resolutiondata was significantly higher than the high-resolution data.After super-resolution, the eSNR improved again, to become significantly higher than either the low-resolution orhigh-resolution data. The eCNR of the three techniqueswas similar, however the high-resolution technique wasfound to have be significantly lower than the lowresolution or super-resolution images.DiscussionThe main findings of this study were: i) It is possibleto train a 3D residual U-Net to perform single volume SRR on synthetically down-sampled WH-bSSFPdata, ii) The accuracy of the network is dependent onthe input resolution matching that of the trainingdata, iii) SRR of clinically acquired actual lowresolution WH-bSSFP data was successful using theresidual U-Net trained using synthetic data, iv) Superresolution data had better image quality than acquiredlow resolution data and was comparable to referencestandard high-resolution data, v) Vessel diametermeasurements made using super-resolved data werenot significantly different from reference highresolution data in the great vessels, but a smallunderestimation was seen in the coronaries.Super-resolution reconstructionFig. 4 Example images of vessels from the prospective study.Representative image quality from the prospective study. Multiplanar reformats of the ascending aorta (AAo), descending aorta(DAo), main pulmonary artery (MPA), right pulmonary artery (RPA),and left pulmonary artery (LPA), from the high-resolution and lowresolution acquisitions, as well as the super-resolved resultresolution WH and low resolution WH data (p 1.1 10 6) and between super resolution WH and low resolution WH (p 0.002).Image qualityQuantitative and qualitative image quality results can beseen in Table 4. Qualitatively, the low-resolution datawas found to have significantly lower sharpness of vesselboarders and more image distortion than the highresolution data, with no significant difference in residualartefacts. After super-resolution reconstruction, therewere no significant differences in terms of qualitativeThe main benefit of SRR is that it can be applied as apost-processing step and therefore, requires no significantsequence modifications. However, conventional SRR areoften computationally intensive and fail to properly recover high resolution features [21, 22]. Recently, deeplearning has been used to overcome these problems for arange of imaging problems including brain and body MRI[23, 24]. In this study, we have developed a deep learningframework for super-resolution of 3D WH-bSSFP data.This was done to speed up acquisition of this timeconsuming element of many congenital heart diseaseCMR protocols.The main requirement for deep learning is paired inputand output data that can be used to train the network.Often this must be prospectively acquired, restricting theability to quickly develop deep-learning platforms. However, simulating low-resolution data is relatively trivial.Thus, synthetic training data can be easily created frompreviously acquired high-resolution data, allowing rapid
Steeden et al. Journal of Cardiovascular Magnetic Resonance(2020) 22:56Page 9 of 13Fig. 5 Example images of the coronaries from prospective study. Representative image quality from the prospective study. Multi-planar reformatsof the coronary artery from the high-resolution and low-resolution acquisitions, as well as the super-resolved resultTable 2 Vessel diameter
Fig. 1 Network architecture. Chosen residual U-Net architecture used for 3D single volume super-resolution. The input is given by the low-resolution WH-bSSFP images. The numbers on top of the blue bars denote the number of channels for each layer. The resolution for each multilevel decomposition is shown on the left.