Transcription
INTERNATIONAL JOURNAL OF ENVIRONMENTAL & SCIENCE EDUCATION2016, VOL. 11, NO. 16, 8726-8739OPEN ACCESSAssessment of Consumers’ Satisfaction with theAutomotive Product QualityHadi Amineha and Nataliya KosachaaN.Zhukovsky National Aerospace University "Kharkiv Aviation Institute" Ukraine, Kharkiv,UKRAINEABSTRACTRelevance of article is caused by the fact that customers satisfaction currently serves asthe mechanism allowing the carmakers to be competitive in the market. The paperdescribes issues of assessment of the quality of products manufactured by automobilecompanies. The assessment is based on widely applicable complex characteristics of thequality. The obtained values of the quality index with the price criterion can be used atall stages of the automotive manufacture as well as of the price-quality ratio whichcompletes the process of decision-making on car purchase. Materials of article representthe practical importance, results of a research can be used by automobile companies indevelopment of strategy of product quality improvement.KEYWORDSProduct quality, quality levels, automotive industry,consumer satisfaction, satisfaction scoreARTICLE HISTORYReceived 12 April 2016Revised 11 May 2016Accepted 22 June 2016IntroductionCurrently the global market presents many different cars by well-knowncarmakers such as: Toyota Motors, Volkswagen, General Motors, Daimler, FordMotors, Honda Motors, Nissan Motors, Hyundai Motors, BMW, Peugeot. Inorder to maintain their products on the market, the companies have to conductcomplex studies of their brand quality, in particular, reliability, comfort,durability, etc. Based on the research results, the automobile companiesannually develop new strategic and operational goals on improvement of theirproduct quality and reliability for next three to five years.CORRESPONDENCE Hadi Aminehhadiamineh@hotmail.com 2016 Amineh and Kosach. Open Access terms of the Creative Commons Attribution 4.0 International /) apply. The license permits unrestricted use, distribution, andreproduction in any medium, on the condition that users give exact credit to the original author(s) and the source,provide a link to the Creative Commons license, and indicate if they made any changes.
INTERNATIONAL JOURNAL OF ENVIRONMENTAL & SCIENCE EDUCATION8727The product quality analysis is known to be based on the data obtainedduring advanced marketing studies of customers’ satisfaction. Following theobtained data, in particular, car rates by reliability are monitored, as well ascomplaints on characteristics of design, comfort, functionality, etc. Theautomakers’ marketers receive the data based on the subjective perception of theproducts through a consumer, which greatly depend on an individual's featuresand requirements to their automotive product.The higher the customers’ requirements to the product characteristics, theless chance the automakers have to satisfy them. Also, it should be emphasizedthat the customer’s confidence in the company and the brand plays an importantrole – the greater confidence level assumes the higher assessment of theproducts and the greater customer’s satisfaction (Durczak, 2011; Sadovnikova2016).Therefore, the paper is believed to be relevant because customerssatisfaction currently serves as the mechanism allowing the carmakers to becompetitive in the market.Literature ReviewThe concept of the quality became deeper while science was developing.Many scientists in Ukraine, CIS countries, USA, Europe contributed to creationand development of modern quality systems.All management theories for the recent years establish linkage between theefficiency on the market and the fact that the company is supposed to set as itsstrategy priority a consumer and its satisfaction of driving a car, purchased fromthe automaker through a dealer network, as well as satisfaction with after-saleservice. The other group of researchers adduced a survey of independentautodealer’s satisfaction by car brands (Independent automobile dealersatisfaction survey, 2009).Besides, many researchers consider interaction between a client, serviceand the product quality with customer’s satisfaction and loyalty torepresentative of the automotive industry (Asghar, 2011). Consumers’preferences for quality, such as emission levels, fuel consumption per kilometerper liter have also been studied by other researchers (Dean, 2007).Also, an interesting analysis is presented by the third group of researchesexploring the relationship of customer service and business opportunities forauto sale centers. The authors prove the impact of the service on the purchaseand return for repeat purchase (Aaker, Shanby, 2007; Jahanshahi & Afshar,2010).Design and assembly of a car is a complex task to be performed withinshorter time if the studied demand for certain car models is available, as buyers’requirements for reliability, durability, and comfort are getting higher everyyear.To cope with these conflicting constraints, it’s necessary to apply tools, tosimplify the analysis of the data obtained at all stages of the car development.For this purpose, the fourth group of scientists described methods for solving thetasks of modeling of a quality competitive car at the stage of development,manufacture, and planning, as well as of service and maintenance (David, 2009;Pitts, Lei, 2003; Springdal, 2012; Steinbrecher & Moewes, 2010).
8728H. AMINEH & N. KOSACHNot all car buyers would return to purchase again, the research authorsassert. Repeat purchases can be defined as a positive reaction to the brand (i.e.behavioral loyalty) and automatism caused by and associated with a contextualtip (for example, habit).The authors offer diagnostic tools to distinguish between two kinds ofrepeat purchases, and examine how they affect the consumers’ reaction and saleof automakers’ shares. This study deepens understanding of the causes ofchanges in automakers’ share sales, and provides important management ideasfor development of effective sales to regular customers (Dixon, Hopkins, Mador,Matthews, 2011; Levitt, 1981; Liu-Thompkins, 2010; Louw, Venter, 2006;Steiner, 2001).Thus a potential buyer creates an own template, considering ownrequirements to the products, in particular to operating characteristics anddesign. When driving, a buyer compares own expectations to reality, and on thisbasis concludes on own satisfaction. When characteristics correspond toexpected, the consumer is satisfied. According to W. Schneider (2014), thequality perception can be considered as a multifactorial phenomenon, which canbe divided into three stages: before purchase; during purchase and sale; after purchase, after-sale service at network of dealerships andunincorporated service stations.All the points of intersection of these stages can affect the customersatisfaction level - to increase or decrease it. It is therefore important so that the"customer focus" would be one of the priorities at the automobile enterprises andknown, obvious and applied by all employees.Opinion of different researchers and scientists on customer satisfaction andservice quality has been studied by the authors (Peng-Chan et al., 2015),considering the four main variables of perceived quality (PQ), service quality(SQ), customer satisfaction (CS), customer loyalty (CL). The primary analysiswas performed using SPSS 16.0 package and included the multifactor analysisof variance, reliability, accuracy of the proper analysis. A statistical analysis in asoftware environment was first performed for the study of the influence ofdemographic characteristics of four main variables PQ, SQ, CS. The analysisshows that users of different brands of sedans have significant differences ofcustomer satisfaction in all four variables.Representatives of the fifth group of researchers (Vinodini & Umarani,2014) studied clients’ ideas and expectations to improve the dealer’s efficiency,and to find discontents and to find out a way to eliminate them. This surveyhelps to determine the level of customer satisfaction after the sale, service, andoverall satisfaction.Analysis of customer satisfaction brings significant advantages to theenterprise, namely: Determination of the most important for the buyer product propertiesallows to use them for ads, avoiding the costs for benefits insignificant for theconsumer; It helps to accurately assess the market positions;
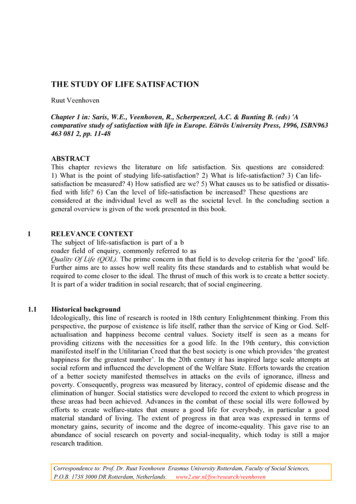
INTERNATIONAL JOURNAL OF ENVIRONMENTAL & SCIENCE EDUCATION8729 It reveals opportunities to improve, first and foremost, the quality ofproduct and processes, identifying improvement priorities.Thus, we can say that currently assessment of customer satisfaction isconsidered to be the mechanism allowing automakers to be competitive in themarket.Today, customer satisfaction is assessed by several methods, for example:- Methods aimed at unsatisfied consumers: complaints and suggestions, theguarantee workshops’ data;- Questionnaire methods: questionnaire "importance-compliance", CSI Customer satisfaction index;- Commissioned studies.However, they do not allow full estimation of the quality of automotiveproducts because of its comprehensiveness and diversity. In this regard, weattempted to develop a methodology for the study and evaluation of customersatisfaction with automotive products, which would allow the maximumevaluation of the quality, taking into account as many influencing factors aspossible.Approaches used in development of the methodology for customersatisfaction assessmentCurrently, the customer satisfaction is affected by various factors, thenumber and variety of which is steadily increasing. Therefore, for easeperception and evaluation, the most important factors can be represented by thescheme (Fig. 1), demonstrating that before buying, a consumer forms ownexpectations for automotive products.Figure 1. Factors affecting satisfaction of the carmaker’s consumersAn analysis of the existing methods and approaches to evaluation ofcustomer satisfaction showed that the most interesting are theoreticallyapproaches of J.J. Lambin (2008), A. Parasuraman, L.L. Berry & V.A. Zeitaml(1985), E. Juan (2010). Customer satisfaction was evaluated by the five-pointLikert scale, the Gap model, R. Kolman's (2009) scale, the method of complexresearch of integrated indicators of customer satisfaction. They allowed to formsix phases of the evaluation of customer satisfaction, namely:
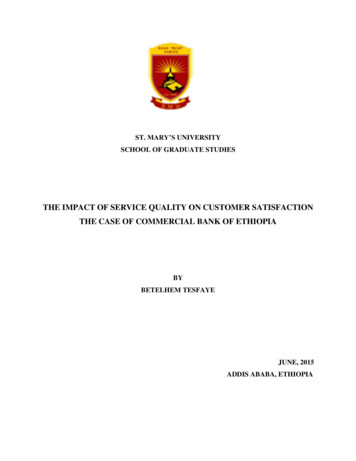
8730H. AMINEH & N. KOSACH1 – determination of the survey goal; in particular – detection of criticalindicators, entailing a decrease in demand for products; revealing of customers’expectations, essential for keeping market positions, separation of clients byvalues and so on;2 – creation and ranking of the main indicators principal both for themanufacturer and for the consumer, and allowing to get answers to the set thesurvey goal;3 – preparation of databases of companies-respondents;4 – development of survey questions, of the rating scale;5 – distribution of surveys by fax or e-mail to the companies-respondents,while their routing is clearly tracked.6 – evaluation of the collected survey data of consumers' satisfaction withthe product quality and service level.In order to increase the respondents’ motivation to fill questionnaires and toarrange feedback from consumers, the results of each survey should be followedby written notices of the events developed and to be executed on the basis of thereceived survey data (Kolman, 2009).The most promising approach to this issue is to use along with aquantitative assessment of satisfaction, its qualitative analysis. Thus aquestionnaire of customer satisfaction, realizing the function of forming buyers’opinion on the car quality and reliability, is supposed to provide the consumerwith a possibility to express own opinions on car driving problems and wishes ofthe automaker. Of course, this significantly increases the complexity ofprocessing survey data. But we should not forget that the productcompetitiveness depends not only on how reliably and completely "view of theconsumer" is measured but also on how well it is considered at the company’scurrent and future activities.As mentioned above, R. Kolman’s (2009) scale (Fig. 2) was applied to assessthe quality of cars. This multi-criteria method allows to accurately calculate thequality indicators.
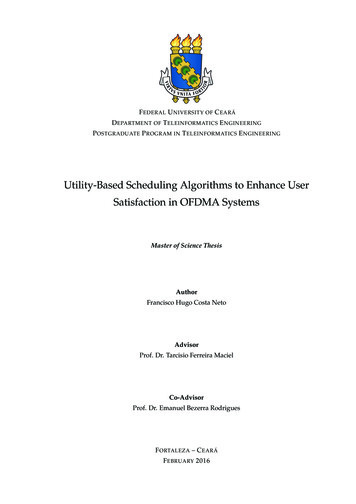
INTERNATIONAL JOURNAL OF ENVIRONMENTAL & SCIENCE EDUCATION8731Figure 2. The universal R. Kolman’s (2009) scale for assessing quality stateHowever, the quality represented in digital form can be only anintermediate stage in the decision-making process, for example, to buy a car.Thus the objective, efficient and versatile methodology should be applied toestimate the car quality that allows to determine the complex quality indicatorwith values in the range [0;1] based on the weight values of the measuredcharacteristics.R. Kolman (2009) measured the quality in the range from [0;1] and assertedthat among unlimited possibilities of the choice of any number for variations inthe reference quality state, 1 is best matching as allows to interprete the limitfinal value of a degree of quality perfection.The methods used in the development of the methodology for customersatisfaction assessmentBased on the R. Kolman's (2009) scale, an hierarchical structure of criteriaof the automotive product quality can be built, consisting of several levels Qi(where i 1, 2 . . n - number of the quality criterion), which in turn, can bedivided into sublevels consistings of basic and additional criteria of the qualityqij (j 1, 2 . . m – number of the sublevel). This structure is shown in Fig. 3.
8732H. AMINEH & N. KOSACHFigure 3. The structure of the car quality criteriaAn algorithm of the identification of the car quality (Fig. 3) should have themathematical apparatus that allows to rank all the criteria, characterizing thecar quality in the form of absolute and relative indicators with the tools used inquality engineering.The final result of the algorithm application is to bring the product qualityas a number in the interval [0;1]. Zero means that hypothetically there is acomplete lack of quality, and unit - quality, satisfying one hundred percent ofconsumers’ expectations.Since the degree of satisfying the expectations which for certain features ofcars deviates from consumers’ expectations, the global quality of cars takesintermediate values between 0 and 1.Determination of the product quality begins with the fact that the group ofexperts, referring to own experience, knowledge and intuition defines a numberof basic criteria (Qi) and sub-criteria (qij) and takes part in their ranking. Thusonly those criteria inherent in cars are taken into account, and those values arehighlighted which can not be considered as permanent and changing over time.The experts are also involved in the development of questionnaires andquestions which later provided for car estimation by the users. Following theinformation from the questionnaires, on the basis of the developed algorithm,the global quality indicator is calculated.Ratings of the individual experts to be controlled in terms of compliance. Totest rate compliance, a coefficient CR is used, which characterizes what share ofthe market is accounted for a predetermined number of the largestmanufacturers. Since the concept of "predetermined number" looks indefinitely,the abbreviation CR is added with the figure, showing number of the largestmanufacturers discussed (Method of ranked criteria weights). Basically, thefollowing indexes of concentration of quality indicators CR: CR2, CR3, CR4, CR5, CR8, CR10 are used. Actually the number of "the largest criteria groups" can
INTERNATIONAL JOURNAL OF ENVIRONMENTAL & SCIENCE EDUCATION8733be any. Matrix of even comparisons (its number of rows equals the number ofcolumns and equal n) has a structure that allows to assess which of the factors ismore important than others, and does not give a direct assessment of theimportance of a particular criterion.Therefore, to determine the balance of their factors (criteria of importanceof the car quality factors) for criteria, the method of factors of the relativeimportance is used. This method is based on calculation of arithmetic (additivex) or average geometrics (multiplicative) (Methods of the car qualityassessement from the point of consumers’ view).There are relatively simple operational methods for determining thecoefficients of the relative importance: Method of the direct numerical assessment (M1) when each expertshould directly indicate the importance coefficients for the elements satisfyingthe condition of normalization; Method of the score assessment (M2), when each expert should evaluatein a given scale an element dj Є D j 1, m in accordance with decreasing oftheir preference (for example, d1 d2 d3 . dm). Thus a scale 0:100] isoften selected, where the point 100 corresponds to the most preferred element; Method of relative frequencies of ranks (M3), when experts shouldstrictly order sets of presenting elements. The elements of an ordered set areassigned numbers (inverse ranks), corresponding to the number of the dominantelements. Thus, the best element would have rank т - 1 (it is better than anyonebut itself), and the worst - rank 0; Method of pairwise comparison with gradations (M4), when expertsshould make paired comparisons of elements, guided by a predetermined scale ofexpression of preference.The method of ranked weight coefficients for the criteria is, in fact, a specialcase of the method of weighted sums. It uses the same formula for calculatingthe rating, the expert ranks the criteria by importance - from most important toleast important.There are other methods of ranking their criteria:1. The linear decrease of the law.2. The exponential law.3. The Zipf-Pareto law.4. Predictive law.The analysis of the law showed that the determined task can be solved bythe predictive law, allowing to develop scientific substantiation forecasts offuture consumers’ preferences to the product quality. But there are no freeparameters in this law, and the criterion W weight depends only on its numberin the ranked list i and the total number of criteria m at this level. It isinteresting that the first two criteria in this law always have equal weight: W 1 W2 , decreasing with an increase n.ResultsUpon analysis of customers’ comments and their preferences, it wasrevealed that they most pay attention on certain quality criteria. In this regard,considering the specificity of the automotive industry, indicators of the global
8734H. AMINEH & N. KOSACHQMR quality (Quality Management Representative) were included in thepredictive law and the statement that the criteria always have different weightindicators. This is a new approach to the choice of weighting coefficients(Babenkova, 2010; Hadi, 2016). In this regard, the formula for calculation of thequality indicators is as follows:Wi i 21 im i 21 i K(1)i 1i - the number of the criterion in the ranked list;K - the importance criterion (to be defined for each criterion by theimportance level) ;m – the total number of criteria in the given sublevel.This formula does not contain a free parameter, the criteria weight dependson the value of the criterion for consumers in the ranked list i and the totalnumber of the criteria in a given sublevel m.The criteria, defined for the group of users of cars being studied, wereassessed at the following stage by criteria using the method of ranked criteriaweights.The study subject was the cars from different manufacturers, but with thesame parameters and in the same price category. For this purpose, thecorresponding questionnaire was developed to be completed by potential buyersat different car dealers (Kosach, Siroklyn & Hadi, 2016). About 50 potentialcustomers at auto shows in Kharkov and Zaporozhye were interviewed, namely:1) In Kharkov: Vehicle Service Station Autocentre "Horizon" Branch PAT "KharkivAvto" Vehicle Service Station No.2. Address: 5, Pyatihatskaya St, Kharkov; "Automotive Consulting Company" (Car Dealer VAZ Kharkov) at: 201B,Gagarina St, "Ovis" gas station, Kharkov; Car dealer "SAMAND" of "TASKO-Ukraine", 130/1, Moskovsky av,Kharkov; Car dealer "OOO Lada Ukraine", 247, Moskovsky av, Kharkov; Ltd. "Bogdan-Avto Kharkov", 256G, Moskovsky av, Kharkov.2) In Zaporozhye: Autocenter "ANT VOSTOK", 8, Skladskaya; Autocentre of Progress Company "Grad Auto", 124, Kosmicheskaya; to"Ltd),124/1, Car supermarket "STAN AUTO", 8, Skladskaya.A questionnaire of 2 sections with 20 questions was developed.Followed by the questionnaire data analysis, a group of the most importantcharacteristics was determined, significant for judgement about the productquality. The resulting list should be formed on the basis of customer satisfactionmeasurement.
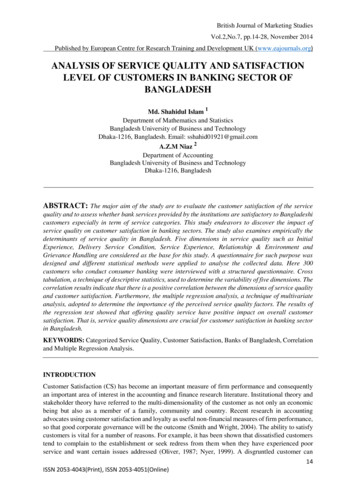
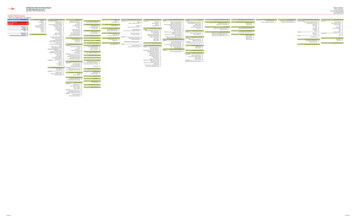
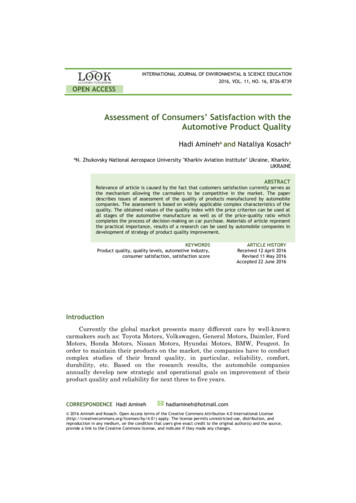
INTERNATIONAL JOURNAL OF ENVIRONMENTAL & SCIENCE EDUCATION8735Table 1 presents the criteria for assessing the car quality and their valuesby the survey data.Table 1. Criteria for assessing the car nce0.1K3Brand recognizability0.2K4Price of spare parts0.2K5Fuel consumption0.1K6Engine performance0.19K7Carrying 22K11Car interior noise0.18K 12Noise in the internalcombustion engine andgearbox during driving0.19K13Quality of facial gaps0.18K15Speed of the .20.060.190.160.160.160.180.160.150.20.16Criteria and their valuesZ3Z4Z5Z60.21 0.180.19 0.10.13 0.150.15 0.130.10.130.16 0.10.12 0.160.11 0.130.13 0.150.15 0.120.14 0.180.10.060.10.110.14 0.120.18 0.130.08 0.080.03 0.080.06 0.030.17 0.150.16 0.060.13 .020.50.040.050.060.10.040.190.060.120.14Applying the values of the global QMR indicator to the R. Kolman (2009)quality scale, the values of the quality criteria can be defined. The qualitycriterion Z3 and ZJ, Z6 - an identifier, Z1 - profitability, Z2, Z5 and Z7 –convenience, Z4 - golden price-quality ratio. (Z – quality criterion, W – criterionweight, K - characteristic) .During quantification (division, reduction of quality to quantity) of the carquality, only particularities are considered (K1-K19). Measurable particularitiescan be evaluated by a scale according to the selection on the basis of thepresented method of evaluation of the car quality.The main factors were evaluated by two subject groups, functional (K2-K5,K14-K19), and technical particularities (K1, K6-K13). The values of theweighting factors for the criteria of the car quality assessement using thespecialized additive method are shown in the graph in Fig. 4.
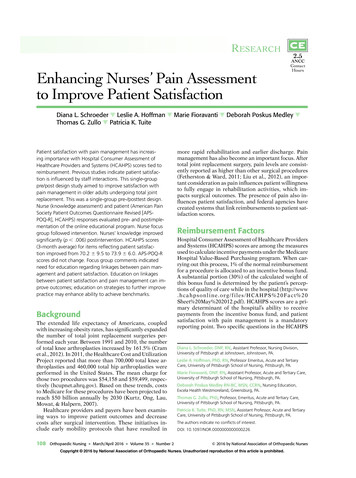
8736H. AMINEH & N. KOSACHFigure 4. Weight of the criteria of the car quality assessmentK1 - Price; K2-Convenience; K3 - the brand recognizability; K4 – Spareparts price; K5 - Fuel consumption; K6 - Engine performance; K7 – CarryingcCapacity; K8 - Service; K9 - Design; K10 - Durability; K11 - Car interior noise;K12 - Noise in the internal combustion engine and gearbox during driving; K13 Quality of facial gaps; K14 - Speed of the gearbox; K15 - Decoration; K16 Suspension; K17 - Frame; K18 - Heating; K19 - Material.The numerical values of the quality index with the price criterion can beused at the following stages, taking into account the price-quality ratio thatcompletes the decision-making on buying a car.Figure 5 presents a graph of the price-quality ratio and the car power (axis the price-quality ratio, this graph is constructed using an online graphingcalculator).Figure 5. The graph of the ratio of the car price and power
INTERNATIONAL JOURNAL OF ENVIRONMENTAL & SCIENCE EDUCATION8737According to Table 1 and Fig. 4, 5, the favorable offer by competitive priceand good quality are cars by selected criteria Z5 and Z1, since the largestnumber of respondents determined that they considered these criteria to be themost important at buying a car.Discussion and ConclusionTherefore, the analytical methods of the quantitative analysis for thequality calculation should be used to study the car quality, as well as to analyzeimportant for a consumer main quality elements. Only an efficient, objective anduniversal method of quality assessment is required. Such one is described hereinallowing to assess the car quality on the basis of accepted criteria sets.The quality criterion Z3 and Z6 - identifier, Z1 - profitability, Z2, Z5 and Z7– convenience, Z4 - the golden mean. Only the characteristics are considered(K1-K19) during quantifying the car quality. Measurable characteristics can beassessed by a scale in accordance with the selection on the basis of the providedmethod of the car quality assessment. The main factors were categorized intotwo subject groups - functional (K2-K5, K14-K19), and by technicalparticularities (K1, K6-K13).The resulting numerical values of the quality index with the price criterioncan be used at the subsequent stages, completing the process of decision-makingto buy a car.A huge number of quality assessment methods is revealed. The ownalgorithm of the car quality assessment has been developed. Car consumershave been interviewed. The consumers’ preferences have been revealed andprocessed into the numerical results. These results can be considered to bereliable and devoid of subjectivity, if independent experts from the industry.Implications and RecommendationsThe issues of assessement of the quality of products manufactured byautomotive companies. It is based on evaluation of commonly used complexquality characteristics. The conducted studies have shown a huge number ofquality assessment methods. All of them allowed to develop the own qualityalgorithm of the car quality assessment.The quality assessment calculations resulted in the following conclusions:1. The quantification assessment of quality as a decimal fraction in therange [0-1] of a final set of similar cars allows to evaluate the quality and,consequently, divide seemingly identical cars according to the quality criteria.2. The assessment of the car quality allows, in turn, to determine the ratingof the car in the form of the examination on the basis of a universal 10-stepquality R. Kolman’s (2009) scale.3. The car quality is expressed in numbers within a scale from zero to oneand allows to make the right decision about the quality.4. Methods of the product quality assessment generally contain an heuristicstage where the knowledge and skills of the group of the well-chosen experts areused.The results of these estimations can be considered as reliable and devoid ofsubjectivity, if made by independent experts from the industry. To assess the carquality, experts from universities, factories, service stations, car dealerships
8738H. AMINEH & N. KOSACHwith practical experience in engineering, or employees of research institutesshould be involved.Disclosure statementNo potential conflict of interest was reported by the authors.Notes on contributorsHadi Amineh is PHD student, Academic Department 303 “Aviation Devices andMeasuring” National Aerospace University. N.E. Zhukovsky "KhAI”, Kharkiv, Ukraine.Nataliya Kosach is Doctor of Technical Sciences, Professor, Department 303“Aviation Devices and Measuring” National Aerospace University. N.E. Zhukovsky"KhAI”, Kharkiv, Ukraine.ReferencesAaker, D.A., & Shanby, G. (2007) Positioning your product. Business Horizons, 22(5), 54-66.Asghar, A. (2011). Study the Effects of Customer Service and Product Quality on CustomerSatisfaction and Loyalty. International Journal of Humanities and Social Science, 7, 24-32.Babenkova, A. V. (2010). Evaluation of customers’ satisfaction as an indicator of the industrialenterprise efficiency. Direct access: http://vestnik.uapa.ru/ru/issue/2010/03/09David, F.R. (2009) Strategic Management. New Jersey: Prentice Hall, 183 р.Dean, A. M. (2007). The impact of the customer orientation of call center employees on customers’affective commitment and loyalty. Journal of Service Research, 2, 161-73.Dixon, S., Hopkins, M., Mador, M. and Matthews, R. (2011) Strategic Management I, 4th edition,Kingston upon Thames: Kingston Business School, 86 р.Durczak, K. (2011). System oceny jakości maszynrolniczych. Rozprawy naukowe 418, WydawnictwoUniwersytetu Przyrodniczego w Poznaniu, 12-18.Hadi, A. (2016). The product quality: characteristics, essence, evolution of approaches.Management. Modern problems and prospects of development, Kraków, 4, m.pl/EYP/WEB/eycom download.nsf/resources/Dealer Satisfaction eng/ FILE/Dealer Satisfaction eng.pdfJahanshahi, N. & Afshar, A. (2010). Study of the relation of Customer Service and EntrepreneurialOpportunities. Asian Journal of Management Research, 1, 48-57.Juan, E. (2010). Indicators of the product quality and methods of their assessment at an industrialenterprise Problems of modern science and practice, 31, 246-254.Kolman, R. (2009). Kwalitologia. Wiedza o różnychdziedzinachjakości. Warszawa. WydawnictwoPlacet. Direct access: http://nootron.net.ua/Help.htm?p chapter3.9.htmlKosach, N. I., Siroklyn, V. P. & Hadi, A. (2016). The quality of the system engineering company irankhodro management. All-Ukraine Scientific and Technіc Conferense of Young Scientists inMetrology, 5, 82-96.Lambin, J.J. (2008). Strategic marketing. European Perspective. St.Petersburg: Science, 589 p.Levitt, T. (1981) Marketing Intangible Products and Product Intangibles. Harvard Business Review,3, 37- 44.Liu-Thompkins. Y. (2010). Not all repeat purchases are the same: attitudinal loyalty and habit.College of Business and Public Administration. 21-26.Louw, L. and Venter, P. (20
carmakers such as: Toyota Motors, Volkswagen, General Motors, Daimler, Ford Motors, Honda Motors, Nissan Motors, Hyundai Motors, BMW, Peugeot. . E. Juan (2010). Customer satisfaction was evaluated by the five-point Likert scale, the Gap model, R. Kolman's (2009) scale, the method of complex research of integrated indicators of customer .