Transcription
AIAA2002-0841Summaryof DataFirst AIAA sberg,The BoeingRichardNASACo.,TomLangley40 thKSShreekantA. o.,Wichita,Longfrom theCAPirzadeh,Center,Hampton,AIAA AerospaceJanuaryMichaelJ. HemschVASciences Meeting14-17, 2002, Reno, NV
AIAA-2002-0841Summaryof DataCFD Dragfrom the FirstPredictionDavid W. Levy*, Tom Zickuhr tCessna Aircraft 6'0., Wichita, KSRichardAIAAWorkshopJohn Vassberg , Shreekant AgrawalThe Boeing 6'0., Long Beach, CAA. Wahls §, Shahyar Pirzadeh ¶, MichaelNASA Langley Research Center, Hampton,AbstractJ. Hemsch #VAIntroductionThe results from the first AIAA CFD Drag PredictionWorkshopare summarized.The workshopwasdesigned specificallyto assess the state-of-the-artofcomputationalfluid dynamics methods for force andmoment prediction.An impartial forum was provided toevaluate the effectiveness of existing computer codes andmodelingtechniques,and to identify areas needingadditional research and development.The subject of the study was the DLR-F4 wing-bodyconfiguration,whichis representativeof transportaircraft designed for transonic flight. Specific test caseswere required so that valid comparisons could be made.Optionaltest cases includedconstant-CLdrag-risepredictions typically used in airplane design by industry.Results are compared to experimentaldata from threewind tunnel tests.A total of 18 international participants using 14 differentcodes submitted data to the workshop.No particulargrid type or turbulence model was more accurate, whencompared to each other, or to wind tunnel data. Most ofthe results overpredicted CLo and CDo, but induced drag(dCD/dQ 2) agreed fairly well. Drag rise at high Machnumber was underpredicted,however, especially at highQ.On average, the drag data were fairly accurate, butthe scatter was greater than desired.The results showthat well-validatedReynolds-AveragedNavier-StokesCFD methods are sufficiently accurate to make designdecisions based on predicted drag.* Engineer Specialist, Senior Member AIAA* Engineer Specialist, Member AIAABoeing Technical Fellow, AIAA Associate Fellow§Asst. Head, Configuration Aerodynamics Branch,AIAA Associate Fellow¶ Senior Research Engineer# Aerospace Engineer, AIAA Associate FellowCopyright 2002 by David W. Levy. Published by theAmerican Institute of Aeronautics and Astronautics, Inc.,with permission.AmericanInstituteIt is well known that CFD is widely used in the aircraftindustry to analyze aerodynamiccharacteristicsduringconceptual and preliminarydesign. All major airframemanufacturersworld-widenow have the capability tomodelcomplexairplaneconfigurationsusing CFDmethods. To be useful as a design tool, the accuracy of amethod must be determinedthroughsome kind ofverificationand validation process.As CFD methodshave evolved, many such studies have been conducted.Some are reported in the open literature,but, due todeficienciesin the published studies, many more areconducted in-house with proprietary data that cannot bedisseminated freely throughout the industry.The majorityof publishedstudiesdescribeCFDalgorithm development.It is common to see results onrelatively simple configurationswithout any comparisonto experimentaldata. This is even true of literature thatdoes concentrate on drag prediction.When comparisonsare made, usually they are pressure distributions.To besure, accurate pressurepredictionis important,andmany CFD groups make early configurationdecisionsbased on evaluation of pressures alone. But pressure isnot the whole story.CFD methods and computer capabilities have advancedremarkably in the past decade.It is now practical toroutinely model complete airplane configurationsandanalyzemultipleflight conditionsusing Reynoldsaveraged Navier-Stokes(RANS) methods.With thiscapability, the focus of the analysis has shifted fromdetailed examinationof a single solution to trends withangle of attack and Mach number.Because of this shift in focus, we must now verify theaccuracyof integratedforces and moments.Inparticular,the ability to predict drag accuratelyisimportant.Once this ability is demonstrated (to the nonCFD community), the credibility of CFD will improvedramatically.of Aeronauticsand Astronautics
studiesarenot The geometry, test cases, and grids all combine tovery common,althoughthey do exist14. This is encourage wide participation and test the experimentaldata in the context of engineering application.thatarein thepublicdomain.Perhapstheclosesttype In the following pages, a complete description of theofstudytothepresentworkis describedin Reference6. geometry is included.This includeshow it wasThisworkwaspublishedin 1997.processed from a series of point-definedstations to aIt is in this contextthatthe presentworkshopwas completely surfaced, loft definition suitable for gridconceived.A technicalworkinggroupwasformed generation.The standard grids are described for thewithin the AIAA AppliedAerodynamicsTechnical multiblock structured, unstructured, and overset options.Committeein 1998with a focuson CFDdragand Then the test cases are defined.transitionprediction. This groupwas composed An overview of the participation is consensusresults are summarized, including lift curves, dragwasthat,whileCFDwasbeginningto be usedinpitching moment, and drag rise characteristics.industryfor dragprediction,it wasunclearwhatthe polars,Thedragdata are also broken out by grid type,stateof the art was. It wasdecidedto conductanturbulence model, and code to identify trends with theseinternationalworkshopinviting participantsfrom parameters. Complete listings of the data, includinguniversities,researchlabs,and industry. Several presentations by the participants, are included in themembersof the technicalworkinggroupformedan workshop proceedings tryDescriptionart of CFD with a primaryfocuson CFD dragprediction.Bybringingtogethera largesamplingofexpertsin this field,whowerewillingto sharetheir In choosing the geometry to be used for the workshop,experiencesin thepursuitof this criticalandelusive several criteria were considered. First, the geometryquantity,the state-of-the-artmayevenbe advanced. needed to be relatively simple, so that participation inSeveralkeyfeaturesoftheworkshopweredesignedto the workshop would be encouraged.However, thefacilitatethisend:geometry also needed to be complex enough to test1. Thesubjectgeometry,theDLR-F4wing-body7,was users' capabilities and to be relevant to the type of workin industry.These two factors led to the choice ofchosenas simpleenoughto do high quality donea wing-body as a good compromise.computationsandstill relevantto the typeofconfigurationusefulto industry.A largebodyof It was also desired to have experimental data availableexperimentaldatais alsoavailablein thepublic with which to make comparisons. The subject of the testdomainforthisconfiguration.needed to be available and well defined.It was beyondthe resources of the organizing committee to design a2. Lcondition,whichis withinreachofmost new, on-purpose geometry and to conduct the requiredCFDgroups,toaconstantCLMachsweeptypically testing.used by industry to determinedrag-rise A few options that fit these requirements were known tocharacteristics.the organizingcommittee,but the one that had thelargest body of data available was the DLR-F4 wing3. A standardset of gridswasprovidedto theshownin bilityin theresults. body,experimentaldata are described in detail in AGARDAll participantswererequiredtosubmitresultsfor303 (Ref. 7), which is a document specificallythe singleMach/Qcaseon oneof thestandard togenerate validation. to provide data for CFD verification andtheir eirexperience.The geometry of the body for the DLR-F4 is defined in7 with 90 defining stations composed of 66 points4. A rigorousstatisticalanalysiswasperformedon Ref.each.The wing is defined with 4 stations of 145 pointstheseresultsto establishconfidencelevelsin theeach.These coordinateswere uploaded into CATIA,data.and surfaces fit to the data using standardloftingtechniques.Certain features, such as the windshield andhorizontal tail flat were not explicitly defined, but wereAmerican2Institute of Aeronauticsand Astronautics
tailcap,and a substantial effort. Several of the participants wouldwingtip wereaddedasdefinedin AGARD303.Also not have been able to do the work if they had t required to generate their own grids. However, eis participants were encouraged to generate grids usingnowing-bodyfairing.Asa finalmodification,thewing best practices they had learned through experience. Bywastwistedbyapproximately0.4 ,perAGARD303,to sharing the details of their gridding techniques, thesimulatealoadedcondition.state-of-the-artcan perhaps be improved.A largeamountof experimentaldatais alsoincluded Four grids were built for use with the following types ofwithAGARD303.Thesamemodelwastestedin three codes:differentwind tunnels. The bulk of the data1. Multiblock uresare2. Unstructured,cell-basedgivenfora constantCL0.5MachsweepfromM 0.603. Unstructured,node-basedto 0.82,andfor CL0.30,0.40,0.50,and0.60at4. OversetM eps,atM 0.60,0.75,and0.80.All dataare The multiblock structured grid was built using the ICEMforaReynoldsnumberof3x106basedonthewingmean CFD module Hexa. It has 49 blocks all with nis fixed point matching at the block boundaries, and up to threeaccordingto a definedtrip strippattern. Standard levels of multigrid are available. Blocks around themethodsforcorrectingthedataduetowall,buoyancy, wing and body used an O-grid e The two unstructured grids were built with VGRIDns.shortcomingof the datais thatthe dragcoefficient They both used the same relative distribution, but globalvaluesareonlygivento a precisionofthreedecimals refinement was used for the nodal grid to get sufficient( 0.001,or 10counts).Attemptstoobtainmoreprecise resolution for node-based codes. The grids were fullytetrahedral. However, an advancing layer technique wasdatawereunsuccessful.used for the boundary layer grids, so the structurepresent to reconstruct prisms in the boundary layer.StandardTo minimizevariationGridsin the resultsand facilitatethestatisticalanalysis,a set of standardgrids weregenerated.These grids were built to a consistent set ofspecificationsregardingspacing and distribution.Inthis way, variations simply due to gridding differencescould be held to a minimum.The participantswererequired to submit the results from the first test caseusing one of the required grids. A sampling of the gridspecifications are listed in Table 1.Table 1.GridStandard Grids.specificationsused to generateWing LE Spacing:Wing TE spacing:Spanwise Spacing at Wing Tip:Cells on Blunt TE:the0.1% MAC0.125% MACFirst BL Cell Normal Spacing:BL Cell Stretching Ratio:Far Field Boundary Distance:0.5% span4.001 mm1.2 to 1.2550 chordsA second reason for providing the standard grids was tomaximizeparticipation.It is recognizedthat gridgeneration, even for a relatively simple geometry, can beAmericanwasThe surface mesh for the overset grid was built withGridgen V13. The surface abutting volume grids weregeneratedwith HYPGEN.Intermediatefields werecaptured with box grids, and finally a far-field box gridsurrounded the entire geometry and went out to the outerboundary.Hole cutting and fringe point coupling wasperformed with GMAN.A summary of the grid statisticsare listed in Table 2.Table 2. Grid StatisticsGridNodesfor the standardfor the uredMultiblockUnstructuredCell 3,29046,576UnstructuredNode rset*Non-Blanked3,231,377"NodesIt was recognizedthat the standard grids could notpossibly meet all solvers' requirementsand could haveshortcomingsaffecting certain solutions.Participants3Institute of Aeronauticsand Astronautics
AIAA-2002-0841were encouragedto generate their own grids accordingto their best practices and requirements.Also, someparticipants were unable to use any of the grids due toincompatibilitywith their codes.In these cases, theysubmitted data only with their grids.TestCaseDescriptionThere were several goals that contributed to the selectionof the test cases. From the outset, it was desired for thisto be a controlled study, so that the variation in theresults could be minimizedwhereverpossible, andsuitable for a statistical analysis. As with the geometry,the set of test cases needed to be simple enough tomaximize participationyet also test the practicalityofthe CFD codes when used in an industry environment.A set of required cases were determinedthat wouldenhance participation:RequiredCases:caseswereto be runat thewindtunnelandDataSubmittedA total of 18 participantsattended the workshop, givingresults from 14 different code types. Many participantssubmittedmore than one set of results,exercisingdifferent options in their codes (e.g., turbulence models)and/or using different grids. A breakdown of the totalsubmittals for each case is shown below:CaseSubmittals135228310For the 18 participants, the breakdownwere used is shown below:MultiblockStructuredUnstructured8testRyc 3xl06 based on the wing mean geometric chord.However, it was specified that the transitionpatternspecified in Ref 7 was not to be used. Because transitionspecification for 3D RANS codes is still relatively rare,all cases were run "fully turbulent."Note that this termis still fairly inexact, as different turbulence models willstill take some time to build up the turbulence level.For Case 1, one of the standard grids was to be used ifpossible. This requirement was designed to enhance thestatistical analysis by removing variability due to gridsas much as possible. Since the workshop was focused ondrag accuracy, a fixed CL was chosen instead of , toremove any variation in CD due to variations in Q. ForCase 2, the participantswere allowed to use their owngrids, if desired.Optional Cases:Case 3: M .50, .60, .70, .75, .76, .77, .78, .80CL 0.500 0.005Case 4: M .50, .60, .70, .75, .76, .77, .78, .80CL 0.400, 0.500, 0.600 0.005Note that Case 4 includes Case 3.These cases areincreasingly more difficult, but are more typical of thetype of data needed and used by industry. Of particularinterest was whether separation present at higher Machnumber/Qcombinations would be accurately predicted.Americanof Methodsof grid types thatOverset749Cartesian21Of the Case 1 results submitted,21 used one of thestandard grids, and 14 used other grids.A generalbreakdown of the turbulence models used for the Case 2results is shown below:Case 1" M 0.75, CL 0.500 0.005Case 2: M 0.75, -3 , -2 , -1 , 0 , 1 , 2 AllOverviewSpalartAllmaras14k-mk-aother1022A few of the Spalart-Allmarasresultsspecifiedaparticular version of the model, but most did not do so.The k-m results includethe Wilcox, MenterSST,EASM, and LEA models. Three of the participants usedwall-functions.ResultsandDiscussionThe first required case was run at a specified CL andMach number, and one of the standard grids was to beused. Average quantities are listed in Table 3.Table 3.CL 0.500Summary of ResultsRNc 3xl06.AvgAlphaeLMinfor Case 1: M terpolatedfrom wind tunnel4Institute of AeronauticsExpmt*and Astronautics.0481data in Ref 7.-.1303
AIAA-2002-0841TheCFDcodestendedto overpredictCLat a givenalpha.ToachievethetargetQ, anaverageoffsetof-0.414 incetherewasnolaminarrunaheadofthetrip strips,asin theexperimentaldata,thedragshould be too high. Thedecrease in drag due to the laminar portion of theboundary layer is estimated to be 13 counts. Taking thisinto account,the error is approximately4.2 counts.Also, the CFD runs were all computed in free air, andthe sting mount was not modeled.The effects of thesedifferences are difficult to quantify without specific studyto identify them.The validity of these comparisonsfree air CFD to windtunnel data, warrants some discussion.To match windtunnel data accurately, the computations should includethe mountinghardwareand tunnel walls (perhapsporous or slotted),and the tunnel data should notinclude some of the corrections normally applied (e.g.blockage).But this is not usually done in practice, andcould not be done here since the uncorrecteddata werenot available.Even though the tunnel data are correctedto a free air condition, the correction process introducessome error. In this respect, the CFD simulations moreaccurately represent the real case of free air than thewind tunnel.The final conclusion is that neither theCFD nor the experimentare exact.There is a muchlarger body of experience with wind tunnel testing, sothere is wider acceptanceof its validity.As moreexperienceis gainedwith CFD, it too will gainacceptance.The comparisons made in this paper shouldbe interpreted with these thoughts in mind.It is also seen from Table 3 that there is a considerableamount of scatter in the data. There is a range of over270 counts in the drag data, which is quite unacceptable.More detailed examinationof the data, Shown in Figure2, shows that the majority of the results are much betterthan indicated by the total range.There are five badresults, or "outliers,"which can be identified.Some ofthese outliers were determined to be due to errors in theruns performed by participants.The one Euler/IBLsubmission also had a larger error than most of the otherresults, which is not unreasonable.A comprehensivestatisticalanalysisof the data isperformedin Ref. 9.The effects of outliers and aquantitative determinationof the confidence level of theresults are included.AmericanA typical pressure profile for Case 1 is shown in Figure3a, taken from Ref 8. It shows the effect of a mismatchin cc the upper surface pressure peak is lower thanexperiment,and the post-shockMach number is toohigh.Most of the participantshad similar results.During the discussion associated with the presentations,many hypotheses were offered as to the source of themismatch,including offsets in angle of attack and achange in the effective Mach number due to blockage.The general attitude changeddramaticallywhen thepresentation was made for the code SAUNA, with the"better" result shown in Figure 3b. These results alsodiffered from most of the others in that the lift andpitching moment agreementwas very good.Theseresults were not run on the standard grid, as it was notcompatible with the code. Also of note, the geometry forthis result was altered in that the wing trailing edge andtip were made to be sharp. The point was raised that itmay be better to avoid the complicationof a blunttrailing edge, especiallyif the relevant flow featuresaren't capturedanyway.However, this is not theposition of the DPW organizingcommittee.In fact,technical issues such as this one are precisely what theworkshop was intended to expose. The first step towardscorrectinga problem is to recognizethat it exists.Furthermore,blunt trailing edges can be an integralelement to transonic airfoil design.Case 2 is representativeof a typical alpha-sweep whichis performed in wind tunnel testing and can be used tocompare trends with angle of attack and lift. The liftcurve results for all Case 2 submissions is shown inFigure 4. Note that several of these cases were run ondifferent grids than for Case 1, so there are somedifferences from the data in Figure 2. As with the Case1 results, most of the data are consistently higher in CLat a given than the wind tunnel data. The average liftcurve slope (derived from linear curve fits), however, isvery close to the experimentalvalue.Several of theresults show nonlinearitiesat c 2 , which agrees withthe experiment.The bulk of the CFD data tend to agreewith each other, however, four outliers can be identified.No trends with grid type (indicated by the line type) orturbulence model (indicated by the line color) can bereadily identified from this graphical analysis.The drag polars for Case 2 are shown in Figure 5. Anincrease in the relative scatter is apparent, which mightbe expected for C Most of the results are consistentlyhigher than the tunnel datasimilar to the Case 1results.Again, the four outliers are seen.A betterappreciation of the induced drag characteristicsis gainedby plotting CD vs. C L,2 shown in Figure 6, which is a5Institute of Aeronauticsand Astronautics
r.Theaverage give the same result regardless of where or by whom it ntresultsareshownin Figure7. Note The discussion of the Case 3 and 4 results is combined.that this configurationhasno tail, andis almost There was only one submission that ran Case 3 but didneutrallystable.Thereis a largerscatterbandin these not complete all of Case 4. Two participants augmentedresults in boththeCFDandthewindtunneldata. Case 4 with a drag rise curve for CL 0.30. Figure 11Mostoftheresultsaretoonegative.It shouldbenoted shows the drag rise characteristics.Wind tunnel datathattheonesetthatmatchesthewindtunneldatavery are only available for M 0.60, 0.75, and 0.80. Thewell(indicatedbythesymbol"Y" in Figure7),is from general scatter at the lower Mach numbers is similar tothe sameresultsthatproducedthe "better"pressure the previous data. The knee of the drag rise non appear to be in the right place, but the CFD results o underpredictthe drag more at higher Mach/CLcombinations.This would indicate that shock inducedIn a furtherattemptto gleantrendsin thedragdata separation is not accurately predicted.relatedtobasicmethodattributes,Figure8 odetypes As the participants presented their results, a overset, discussion often ensued that was open and iledrag2 Many of the users had difficulty with the standardisdefinedbytheformula:multiblock grid, leading to less accurate results.TheCDP CDCL2/(organizing committee acknowledgeslower quality than desired.AR)where AR is the aspect ratio.Plotting CDp generallyresults in a more compact presentationof the data,allowing more expanded scales. The two methods withthe most results (multiblock structured and unstructured)both have considerablescatter, overpredict basic draglevels, and have one or more outliers.The multiblockstructured results have a bit more scatter, but represent 4a larger numberof differentcodes and turbulencemodels than the unstructuredresults.Both of theoverset results are from the same code and grid, so theiragreement is to be expected.For all methods, drag athigher CL is underpredicted,which would indicate thatdrag due to shock-inducedseparation is not captured.However, for attached flow conditions,the averagedCFD results are about 10-15 counts higher than the testdata; this is consistent with the 13-count shift betweenfully turbulent(CFD) and partiallylaminar(windtunnel) flows.Results are sorted by turbulence model type in Figure 9.The most commonmodel used is from Spalart andAllmaras, and again it is seen that code and grid typecontribute to the scatter.The Menter SST k-m resultstend to agree better with experimentat higher CL,indicating that the CFL3D implementationdoes a betterjob predictingthe non-idealdrag than the otherturbulencemodels.Overall, no particularturbulencemodel appears to be more consistentacross code andgrid types than the others.Thecharacteristicsof differentcodesareshowninFigure 10. Here it is comforting to see that a code runon the same grid with the same turbulence model willAmericanthat the grid was ofMuch of the discussion centered on the ability to predictthe basic pressure distribution on a wing, and the effectsof trailing edge modelingtechniques.Some of theparticipants ran cases at a fixed c to compare with thewindtunneldata.Generally,the suctionpeakmagnitude agreed better but the shock was located toofar aft. Many of the participantsargued that leadingedge grid refinement and boundary layer transition canaffect the basic pressure distributionas well. At leastone participant pointed out that, to properly simulate theflow, basic freestreamturbulencelevels and lengthscales are required.These are parametersthat aretypically "hard-wired"into codes and are not specifiedby the user.Questions regardingdetails of the experimentaldatasuch as wall corrections,blockagecorrections,andeffectsof the sting mountswere raisedwhich,unfortunately,could not be answered.A betterunderstandingofexperimentaltechniques and windtunnel corrections by the CFD community could lead tomore accurate validation of CFD codes.ConclusionsandRecommendationsA workshop was held with the specific goal to assess thestate-of-the-artof computationalmethods to predict thedrag of a transport aircraft wing-bodyconfiguration.Standardizedgrids and test cases were used to facilitatethe comparisons.A large body of data was gathered6Institute of Aeronauticsand Astronautics
esentedin anAcknowledgementsobjectivemanner.In general,theCFDlift andminimumdraglevelsare The authorswish to thankthe AIAA licdrag Activities Committeeand the AIAA AppliedTechnicalCommitteefor financialis slightlylowerthan experimentat higherMach Aerodynamicsof theworkshop.Wealsowishto thankournumber/ combinations(i.e.,post-buffetconditions) eseparationispresent.Whilethecomparisonswith ntwerereasonable,thelargeamountofscatter le.doesnot promotea high levelof confidencein theresults. However,muchof the agreedto ardgridsdidnothelpto improvethe 1. Tinoco, E.N., "The Changing Role of Computationalconsistencyof theresults.Themultiblockstructured Fluid Dynamics in Aircraft Development," AIAAgriddidnothavethedesiredquality,whichdegraded 98-2512, 1998.theperformanceofseveralofthecodes.2. Tinoco, E.N., "An Assessment of CFD Prediction ofDragand Other teris toohigh,andneedstobeAIAA 2001-1002, 2001.reducedto ulencemodel,etc.Futureworkshouldtry 3. Agrawal, S. and Narducci, R., "Drag ality).using NonlinearComputationalMethods,," AIAA2000-0382,2000.Althoughthescatteris largerthandesired,muchofit isduetothevariousgrids,codes,turbulencemodels,etc. 4. Peavey, C., "Drag Prediction of Military Aircraftthatwereused.A singleorganizationthatusesoneorUsing CFD," AIAA 2000-0383, gtechniques,will experiencemoreconsistentresults.In 5. Cosner, R.R., "Assessment of Vehicle PerJbrmancePredictionsUsing CFD," AIAA 2000-0384, 2000.thissense,CFDis vantagesof oneconfigurationover 6. Haase, W. et. al., "ECARPEuropeananother.AerodynamicsResearch Project." Validation of CFDCodes and Assessment of Turbulence Models'," NotesMoreexperienceneedstobegainedwhereCFDis usedin conjunctionwithwindtunneldataondevelopment on Numerical Fluid Mechanics, Vol 58, 1997projectsthatculminatein a flightvehicle.Thenthe 7. Redeker, G., "DLR-F4 Wing-Body Configuration," Amethodscanbe"calibrated"toa knownoutcome.NoteSelectionof ExperimentalTest Cases Jotthethat experimentalmethodswentthrougha similarValidation of CFD Codes, AGARD Report edasAug. 1994."perfect",butit isusefulasanengineeringtoolbecauseits advantagesandlimitationsarewellknown.CFD 8. Anon, "Proceedings of the First AIAA CFD DragPrediction Workshop,"needstogothroughthesameprocess.ht p://ad-www.iarc.na a.g ov/t ab/cfdiarc/aiaaA secondworkshopis intheveryearlyplanningstages,d:.')w/index. [ tmi,andandis tentativelyscheduledforthe Summerof 2003.[at*e://www.aiaa. or redworkslao isScheduie a Jd Resuits.hm'.l, 2001.workshopis whattypeofconfigurationto arenot 9. Hemsch, M, "Statistical Analysis of CFD Solutionsfrom the Drag Prediction Workshop,"AIAA-2002donewell yet,andthatthe configurationshouldbe0842,2002.simpler. Otherswerereadyto proceedto morecomplicatedconfigurations,suchas a ingtool.American7Institute of Aeronauticsand Astronautics
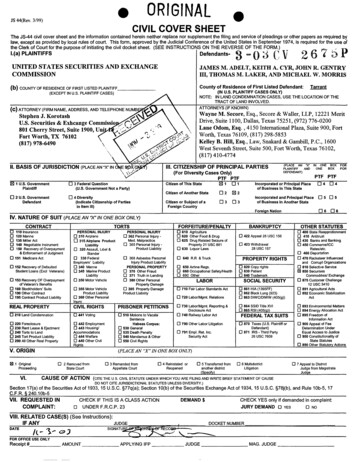
AIAA-2002-0841-2iFigure1. ituteof Aeronauticsand Astronautic
The multiblock structured grid was built using the ICEM CFD module Hexa. It has 49 blocks all with one-to-one point matching at the block boundaries, and up to three levels of multigrid are available. Blocks around the wing and body used an O-grid topology. The two unstructured grids were built with VGRIDns.