Transcription
Indiana’sLIFESCIENCEINDUSTRIESApril 2009TMA report produced by the IndianaBusiness Research Center for theIndiana Economic DevelopmentCorporation
Indiana’s Life Science IndustriesApril 2009Table of ContentsExecutive Summary . 1Key Findings . 2The Indiana Life Science Industry . 3Life Science Manufacturing . 4Indiana Life Science Manufacturing in Perspective . 7Life Science Research and Development and Wholesale Trade . 10The Indiana Life Science Occupations . 11Microbiologists . 13Biochemists and Biophysicists . 14Medical Scientists, Except Epidemiologists . 15Natural Sciences Managers . 16Biomedical Engineers . 16Biological Technicians . 17Environmental Scientists and Specialists, Including Health . 17Biological Science Teachers, Postsecondary . 17Life Science Exports .17Recent Life Science Investments in Indiana . 20Conclusion . 23Appendix . 24Life Science Investment Commitments in Indiana, 2005-2008 . 24Aggregate Industry, Occupation and Trade Definitions . 25Research conducted by the Indiana Business Research Center atIndiana University’s Kelley School of BusinessPrinting provided by Duke Energy Indiana Economic Development
Index of FiguresFigure 1: Life Science Industry Employment by Business Activity, 2007. 4Figure 2: Average Annual Employment and Output Change for Select Industries, 2001-2007 . 6Figure 3: Share of Indiana Total Manufacturing Output (Current Dollar) by Select Industries, 1997-2007 . 6Figure 4: Total Output and Productivity of Pharmaceutical and Medicine Manufacturing, Leading States, 2007 . 7Figure 5: Location Quotient of Pharmaceutical and Medicine Manufacturing Employment, Leading States, 2007. 8Figure 6: Total Output and Productivity of Medical Equipment and Supplies Manufacturing, Leading States, 2007 . 9Figure 7: Location Quotient of Medical Equipment and Supplies Manufacturing Employment, Leading States, 2007 . 9Figure 8: Indiana Location Quotients by Life Science Occupation, 2007 . 13Figure 9: Top States in Location Quotient of Microbiologist Employment, 2006 . 14Figure 10: Top States in Location Quotient of Biochemist and Biophysicist Employment, 2006 . 15Figure 11: Average Annual Change in Wages (Current Dollars) by Occupation, 2001-2007 . 16Figure 12: Top States in the Value of Life Science Exports, 2002-2007 . 18Figure 13: Ratio of the Value of Life Science Exports to State GDP, 2007 . 19Figure 14: Value of Indiana Life Science Exports by Product Type, 2002-2007. 19Figure 15: Share of Total Life Science Exports by Product Type, United States and Top Life Science Exporting States, 2007 . 20Figure 16: Life Science FDI Project Announcements in the United States by Business Activity, 2007-2008 . 23Index of TablesTable 1: Life Science Industry Overview, 2007. 3Table 2: Life Science Manufacturing Summary by Industry, 2007. 5Table 3: Life Science Research and Development and Wholesale Trade, 2007. 10Table 4: Life Science Manufacturing and Research and Development Jobs by Occupation Type, 2007*. 11Table 5: Summary of Indiana Life Science Occupations, 2007 . 12Table 6: Out-of-State Life Science Direct Investment Announcements, Indiana, 2007-2008 . 21Table 7: Top Destination States by Job Estimates for Out-of-State Life Science Investment, 2007-2008 . 22Table 8: Top Source Countries by Job Estimates for Life Science Foreign Direct Investment, United States, 2007-2008 . 22
Executive SummaryThe life sciences play a key role in the U.S.economy. In 2007, 1.4 million Americans wereemployed with companies engaged in the researchand development, production or distribution oflife science products. Even more life scientists areemployed at universities and public researchlaboratories around the country. Furthermore,between 2001 and 2007, average annualemployment growth in these industries faroutpaced that of total employment (1.2 percentcompared to 0.7 percent). Strong growth willalmost certainly continue in an effort to meet theever-expanding demand for health care goods andservices. As a case in point, the most recentprojections from the Bureau of Labor Statisticspredict that U.S. employment in pharmaceuticaland medicine manufacturing will grow 24 percentbetween 2006 and 2016.The importance of the life sciences extends beyond just employment numbers. This field is characterized byinnovation, significant public and private investment, highly skilled talent and excellent wages. For thesereasons, building or expanding the life sciences is a top priority of state and local economic developmentefforts across the country.Indiana is already an acknowledged leader in the life sciences. A June 2008 study by Battelle TechnologyPartnership Practice noted that Indiana, California and North Carolina were the only states to exhibitspecialization in three of their four bioscience sectors (biosciences is a broader industry definition thatincludes agricultural feedstock and chemicals). Certainly, with Eli Lilly and Company in pharmaceuticals andCook Group, Biomet and Zimmer in medical devices, the state is fortunate to be home to some of theindustry’s most recognizable and successful companies. Indiana life sciences extend beyond these industrygiants, however. The state was home to more than 300 life science manufacturing firms, more than 200biotechnology or physical science research laboratories and nearly 1,100 life science product wholesalers in2007.This report aims to provide an overview of Indiana’s position in this field by examining four aspects of thelife sciences. The first section presents information on the employment, typical wages and output of Indianafirms engaged in life science industries. The second section offers a different perspective on life scienceemployment by analyzing occupation-level data. Unlike industry figures, these data allow for a focus on thesegment of Indiana’s workforce with the scientific or technical skills that are specific to the life sciences. Thefinal two sections observe Indiana’s position in the global marketplace with a look at the state’s life science–related foreign exports and the direct investment of foreign companies in Indiana. As with any study usingsecondary or survey data—especially sparse survey data such as the Occupational Employment Statisticssurvey at a state level—care must be taken when making inferences about trends. Secondary data lacks theanalytical richness that can be gained from those in direct contact with the companies that make up anindustry. An industry expert can provide a more complete and accurate picture of industry dynamics andstructure.1
Key Findings The life sciences now rival the auto industry as Indiana’s most dynamic manufacturing sector.Between 1997 and 2007, the life science share of total manufacturing output has increased from 11percent to 20 percent—a mark that now narrowly exceeds the transportation equipment sector’scontribution. The manufacture of pharmaceuticals and medicine are a particular strength. The totaloutput of Indiana firms engaged in this sector was nearly 9 billion in 2007. Only California, NewJersey and New York can boast a higher figure. Furthermore, Indiana ranked second nationally inthe share of total workforce engaged in pharmaceutical manufacturing. Indiana ranks third amongthe nation’s top producers in output per pharmaceutical worker with a mark of 450,000. Indiana’s 3.7 billion in medical equipment and supplies output was second only to California in2007. Indiana led all states in the share of total workforce engaged in this industry. Among thenation’s top 10 producers, Indiana exhibited the highest output per medical device worker( 199,000). Employment in all Indiana life science industries grew at a 2.8 percent average annual rate between2001 and 2007 compared to a rate of 1.2 percent nationally. Indiana’s 2007 average annual wage fora job in this field was 82,000—more than twice the state’s average wage for all employment. Indiana also exhibits employment concentration in several key life science occupations. The state’sshare of total employment exceeded the national share for microbiologists, biochemists andbiophysicists, medical scientists, natural science managers, and biomedical engineers in 2007. Themicrobiologist occupation and the biochemist and biophysicist occupation are also noteworthy inthat they are the two life science occupation groups in which Indiana’s average wage was greaterthan the national average. Indiana does not rate highly in all life science–related occupations, however. Most notably, Indiana’sconcentration of postsecondary biological science teachers was among the lowest in the nation in2007. In this same year, the state’s average annual wage of 71,200 in this occupation also laggedwell behind the national average of 84,130. The value of Indiana’s life science exports totaled 5.1 billion in 2007. This value accounted for 6percent of the U.S. total and was the third highest among all states behind California andMassachusetts. Indiana’s life science exports are heavily dependent on pharmaceuticals which madeup 72 percent of the total. By comparison, pharmaceuticals were responsible for 40 percent of totalU.S. life science exports. Seven life science investments in Indiana by out-of-state firms announced between 2007 and 2008are expected to generate 1,900 new jobs according to the investment monitoring service FDIMarkets. Chief among these deals is the 2007 announcement by New Jersey-based Medco HealthSolutions, which expects to create 1,300 jobs with its new automated pharmacy facility inWhitestown. According to FDI Markets, this is the largest out-of-state life science–related jobannouncement in the United States over this period.2
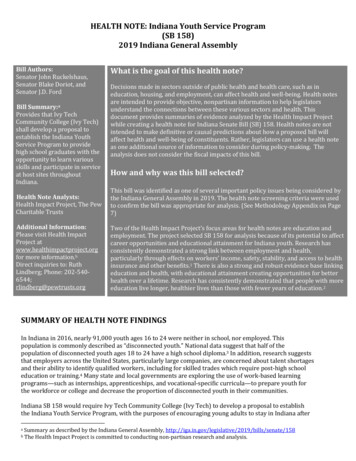
The Indiana Life Science IndustryThe growth of the life sciences is emblematic of the broad restructuring of Indiana's economy. As theautomobile industry contracts, the state’s large manufacturing base has shifted toward producing other typesof goods, and life science manufacturing is an important part of that shift.Indiana was home to 1,650 life science–related firms (most are in the wholesale trade sector) that employed50,000 Hoosiers in 2007. At 1.7 percent of total employment, these industries represent a small yet rapidlygrowing segment of Indiana’s workforce. Table 1 shows that payroll employment in Indiana life scienceindustries has grown by nearly 3 percent annually. This average annual rate of growth is more than twice asgreat as the nation.The important role that the life sciences play in the state is more evident when compared to Indiana’semployment picture overall. Total payroll employment in the state increased by 33,000 between 2001 and2007—a 0.2 percent average annual growth. Meanwhile, life science employment expanded by 7,600 jobs,representing 23 percent of Indiana’s total growth during this period.What makes the growth of the state’s life science industries so important are the high wages associated withthese jobs. The annual wage of a typical life science job was 82,000 in 2007—a mark that was more thandouble the average wage for all employment. Furthermore, the average wage of an Indiana life science jobmore closely resembles the national average than is the case for employment overall.Table 1: Life Science Industry Overview, 2007IndianaUnited States1,65262,38833317,4851,09828,53822116,365Life Science 9Wholesale Trade8,227400,597Research and Development3,433532,749Life Science as a Share of Total Employment1.7%1.2%Average Annual Change in Life Science Employment, 2001-20072.8%1.2%Average Annual Change in Total Employment, 2001-20070.2%0.7%22.9%2.0%Average Annual Life Science Wage 81,974 84,992Average Annual Wage (Total Employment) 37,447 44,450Number of Life Science EstablishmentsManufacturingWholesale TradeResearch and DevelopmentLife Science as a Share of Total Employment Growth, 2001-2007Source: IBRC, using Bureau of Labor Statistics dataLife science industries, as defined in this study, consist of firms operating in three business activities:manufacturing, wholesale distribution, and research and development. Not surprisingly given Indiana’sindustrial heritage, employment in the manufacturing sectors accounts for 77 percent of the industry total3
compared to 43 percent nationally (see Figure 1). Meanwhile,life science wholesale trade employment is relatively small yetgrowing rapidly in the state—a trend that is likely to continuegiven the emphasis on developing Indiana’s logistics sector.One glaring gap in Indiana’s otherwise strong life scienceindustry is found in the research and development (R&D)sector. At the national level, a far larger share (37 percent) ofthe life science workforce is employed with firms focused onR&D than is the case in Indiana (7 percent). Furthermore,Indiana life science R&D wages are well below the nationalaverage. By contrast, the state’s 2007 average annual lifescience manufacturing wage was 81,000 compared to 78,000for the nation. The 2007 wage differential in medicalequipment wholesale trade was over 6,000 in Indiana’s favor.The annual wageof a typicallife sciencemanufacturing jobin Indiana was 81,000 in 2007.It is important to note that firms are categorized by their“primary business activity” for the purposes of industry classification. Primary business activity is typicallydefined by the pursuit that accounts for the greatest share of production costs, capital investment or revenue.Therefore, firms with a major manufacturing presence, for instance, may still heavily engage in R&D.Figure 1: Life Science Industry Employment by Business Activity, 2007Source: IBRC, using Bureau of Labor Statistics dataLife Science ManufacturingIndiana life science manufacturing is led by pharmaceutical and medicine production. In 2007, this industryaccounted for half of life science manufacturing employment and 38 percent of all life science jobs (seeTable 2). Furthermore, with an average wage of 102,000, Indiana pharmaceutical firms pay above thenational industry average and their wages are nearly three-times greater than Indiana’s average for all jobs.The manufacturing of medical instruments and surgical appliances is another area of strength. In 2007, eachof these industries employed 8,200 people which combined to account for 33 percent of Indiana’s total lifescience workforce. Additionally, with strong average annual growth since 2001, medical instruments (5.4percent) and surgical appliances (8.3 percent) are high-growth industries in Indiana, far outpacing U.S. growthrates in these same sectors. Each industry had an average wage well above Indiana’s total manufacturing markof 51,000. The surgical appliances industry, in particular, provided high wages with an average of 71,500 in2007—nearly 12,000 above the national average.4
Table 2: Life Science Manufacturing Summary by Industry, 2007EmploymentManufacturing IndustryAvg. Annual EmploymentChange, 2001-2007IndianaUnited States19,104 102,158 98,5870.8%0.7%8,241 71,481 59,7548.3%*1.2%*8,205 57,574 66,6155.4%0.5%1,294 31,150 36,141-0.8%0.7%Ophthalmic Goods608 27,940 52,0234.9%-1.9%In-Vitro Diagnostic Substance253 54,352 90,7379.3%5.0%Analytical LaboratoryInstrumentDental Equipment andSuppliesBiological Product (exceptDiagnostic)**Electromedical Apparatus**251 61,813 83,7961.8%-0.9%221 41,155 50,5460.2%-0.8%n/an/a 84,919n/a0.8%n/an/a 82,534n/a1.9%Irradiation Apparatus**n/an/a 90,190n/a1.4%n/an/a 91,617n/a-0.2%Pharmaceutical PreparationSurgical Appliance andSuppliesSurgical and MedicalInstrumentDental LaboratoriesMedicinal andBotanical**IndianaAvg. Wage per JobIndianaUnited States*Some North American Industry Classification System (NAICS) sectors were revised in 2007. The surgical appliance and supplies manufacturing industryreceived a portion of the now eliminated NAICS 339111. Therefore, a portion of this growth can be attributed to this revision.**Indiana data are not available due to Bureau of Labor Statistics non-disclosure requirements.Source: IBRC, using Bureau of Labor Statistics dataGains in life science manufacturing employment are in sharp contrast to the dominant trend in manufacturingoverall. Indiana’s total manufacturing employment declined by nearly 66,000 between 2001 and 2007.Transportation equipment manufacturing, the state’s hallmark industry, contracted by roughly 8,000 jobsduring that period.Despite employment declines, the value of Indiana’s manufacturing output continues to climb. Current dollaroutput of total manufacturing has grown at an average annual rate of 2.8 percent, while the production oftransportation equipment specifically has increased at an annual rate of 2.2 percent (see Figure 2). Thebifurcation of employment and output reflect several underlying forces: improvements in technology,increases in productivity and the divestment of lower value-added functions.The relative strength of the state’s life science manufacturing sector is illustrated not only by employmentgrowth but also by the nearly 8 percent average annual growth in output. This rate of growth was twice aslarge as the state total for all industries.5
Figure 2: Average Annual Employment and Output Change for Select Industries, 2001-2007Source: IBRC, using Bureau of Labor Statistics data and Moody’s Economy.comThis exceptional growth in life sciences relative to total manufacturing signals a potential realignment of thestate’s industry mix. The life science share of total manufacturing output has grown to 20 percent which, asFigure 3 illustrates, now narrowly exceeds the transportation equipment sector’s contribution.Figure 3: Share of Indiana Total Manufacturing Output (Current Dollar) by SelectIndustries, 1997-2007Source: IBRC, using data from Moody’s Economy.comWhile life science manufacturing output has surpassed that of transportation manufacturing in recent years, ithas done so with less than one-third the workforce. The importance of this sector’s tremendous productivitycannot be overstated. Yet it is important to keep in mind that, in terms of employment alone, gains in lifescience manufacturing will not offset losses in the broader manufacturing sector if recent trends persist.6
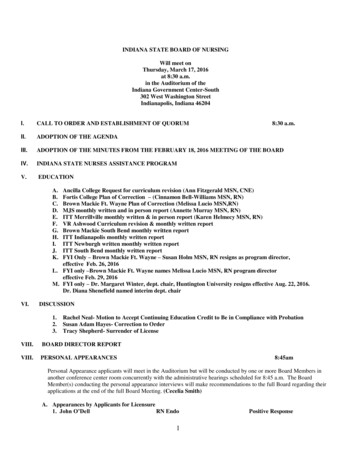
Indiana Life Science Manufacturing in PerspectiveClearly, manufacturing of pharmaceuticals and medical devices isan increasing strength of Indiana’s economy. Perhaps moreimportantly, Indiana stands as a national leader within these keyindustries. For instance, Indiana firms generated 8.8 billion inpharmaceutical and medicine output in 2007 (see Figure 4). Thislevel of output was fourth among all states behind California, NewJersey and New York—some of the nation’s largest economies. Infact, Indiana is unique in this list in that it is the only state that isnot also among the top 10 nationally in total output.Sheer output alone does not offer a complete account of a state’sproductivity given these variations in relative size of stateeconomies. Output per worker helps to compare states on a levelplaying field. Indiana ranks third among these top producers inoutput per pharmaceutical worker with a mark of 450,000, whichplaces the state ahead of California and New Jersey and behindonly Texas and New York. Indiana’s output per worker for allindustries was 82,500 in 2007.Indiana firmsgenerated 8.8 billion inpharmaceuticaland medicineoutput in 2007.Figure 4: Total Output and Productivity of Pharmaceutical and Medicine Manufacturing,Leading States, 2007*Output per worker is a common measure of productivitySource: IBRC, using data from Moody’s Economy.com7
Another indication of Indiana’s position as a national leader is the relatively large share of total employmentthis industry holds. Indiana had a pharmaceutical employment location quotient (LQ) 1 of 3 in 2007, meaningthat the state’s share of total workforce dedicated to this sector was three times greater than that of thenation. This measure was second only to New Jersey, which had a location quotient approaching 5. Not onlyis Indiana highly concentrated but this concentration has increased since 1997 when its LQ was 2.6. Indiana’s10-year change in LQ (at an annual average rate) ranked third—behind Rhode Island and Utah—among thestates featured in Figure 5.Figure 5: Location Quotient of Pharmaceutical and Medicine Manufacturing Employment,Leading States, 2007Source: IBRC, using data from Moody’s Economy.comAt 3.7 billion in output in 2007, the state’s medical device sector does not match the exceptional outputgenerated by the pharmaceutical industry, yet Indiana’s position nationally is equally significant. The stateranked second in output and exhibited the highest output per medical device worker ( 199,000) of these topproducers. California led the nation with a total output that was more than twice as large as Indiana’s. TheHoosier State’s strong performance in this sector is especially evident when one considers that each of thestates listed in Figure 6 has a larger total economy than Indiana, which ranked 18th in total output in 2007.California’s total output, for instance, was more than seven times larger than Indiana’s.Indiana led all states in the share of total employment in medical device manufacturing with an LQ of 2.8 in2007. This mark was up from 2.0 in 1997, which was the largest LQ increase of the states shown in Figure 7.Location quotient is a measure of industry concentration which in this study calculates a ratio of an industry’s share oftotal employment locally to its share nationally. The national average equals 1 and an LQ above 1 indicates that a state ismore specialized than the nation in that industry.18
Figure 6: Total Output and Productivity of Medical Equipment and SuppliesManufacturing, Leading States, 2007*Output per worker is a common measure of productivitySource: IBRC, using data from Moody’s Economy.comFigure 7: Location Quotient of Medical Equipment and Supplies ManufacturingEmployment, Leading States, 2007Source: IBRC, using data from Moody’s Economy.com9
Life Science Research and Development and Wholesale TradeWhile Indiana is clearly one of the nation’s top manufacturers of pharmaceuticals and medical devices, thisposition of leadership does not extend to other life science–related industries. Most notably, the state lags wellbehind national averages in the research and development sector. Table 3 shows that employment inphysical, engineering, and life science research 2 has declined at an average annual rate of 1.6 percent inIndiana since 2001, while the nation has seen an annual growth of 2.4 percent over the same period. Thesedivergent trends lead to an employment LQ of 0.3 in 2007. Indiana’s underperformance in life science R&Dis further highlighted by an average annual wage that is nearly 19,000 below the national average.Indiana companies engaged in the wholesale trade of druggists’ goods employed 4,000 people in 2007. Thesejobs paid an average annual wage near 90,000, which was Indiana’s second highest-paying life science sectorbehind pharmaceutical manufacturing. Furthermore, Indiana’s average wage in this sector exceeded the U.S.average in 2007, yet employment growth over the 2001-2007 period trailed the nation. In contrast, themedical equipment wholesale trade sector has made great strides in Indiana in recent years. The sector’saverage annual employment growth of 8.4 percent since 2001 is far greater than the national average and haspushed the state’s employment LQ to 1.1 in 2007. Furthermore, Indiana’s average annual wage for lifescience wholesale trade jobs is more than 6,000 greater than the national average and well above the 2007average annual wage of 51,430 for all Indiana wholesale trade jobs.Table 3: Life Science Research and Development and Wholesale Trade, 2007EmploymentMedical Equipment MerchantWholesalersDruggists’ Goods MerchantWholesalersPhysical, Engineering and LifeScience Research*Avg. Wage per JobAvg. Annual EmploymentChange, 2001-2007IndianaIndianaUnited States4,239 87,214 80,850Indiana8.4%United States3.6%3,952 89,510 88,3000.9%1.0%3,426 76,191 94,864-1.6%2.4%*This industry classification includes scientific research firms outside of the life sciences. Data are not available for life science research specifically.Source: IBRC, using Bureau of Labor Statistics dataThis industry classification includes scientific research firms outside of the life sciences. Data are not available for lifescience research specifically. 2001 was selected as the starting point for comparison because that was the year of the lastrecession.210
The Indiana Life Science OccupationsThere is no mistaking Indiana’s position at the forefront of the nation’s life science industries. With 85percent of employment in manufacturing-oriented firms, it stands to reason that Indiana’s life scienceworkforce would be more heavily concentrated in production-related occupations (see Table 4). Does thismean that Indiana is simply a production hub? Or does the state support the high-skill, high-wage scientificand technical jobs commonly associated with this industry?Occupation data provide a useful supplement to industry-leveltrends and present a different perspective that can helpanswer this question.Indiana’semployment innearly all lifescienceoccupations hasgrown since 2001.The difference between the two perspectives—industry versusoccupation—is that an establishment classified as apharmaceutical and medicine manufacturer, for instance,employs many different types of occupations. In addition tothe production workers on the shop floor, there areadministrative employees that take care of payroll and billing.There are managers, quality inspectors, financial analysts andcustodians. There are also chemists and biologists. All theabove occupations are integral to the operation of a successfulfirm, but this section focuses on occupations requiringscientific or technical skills specific to the life sciences becauseth
Indiana's 3.7 billion in medical equipment and supplies output was second only to California in 2007. Indiana led all states in the share of total workforce engaged in this industry. Among the nation's top 10 producers, Indiana exhibited the highest output per medical device worker ( 199,000).