Transcription
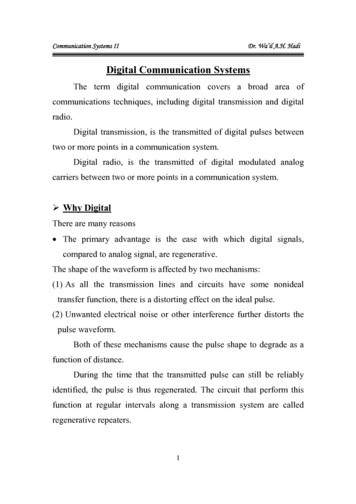
C O U N CI L O F E CO N O MI C A DV I S ER S I S SU E B RI E FM AR C H 2016THE DIGITAL DIVIDE AND ECONOMIC BENEFITS OFBROADBAND ACCESSIntroductionThis issue brief provides an overview of the state ofbroadband in the United States using the most recentdata available from the 2014 American CommunitySurvey and building on the Council of Economic Advisers’previous analysis of the digital divide. 1 Much progresshas been made connecting Americans to broadbandInternet, but a substantial digital divide remains. Thisbrief reviews the benefits of Internet connectivity,highlighting one in particular—better labor marketoutcomes—that can accrue to American workers fromaccessing broadband Internet, especially through onlinejob searches. Addressing the remaining digital divide willrequire a focus on affordability—which can be addressedby a range of measures including policies to foster morecompetition between broadband providers—as well ason access to devices, and digital literacy.The main findings highlighted in the issue brief include:1 The number of U.S. households subscribing to theInternet has risen 50 percent from 2001 to 2014, andthree-quarters of American households currentlysubscribe; A digital divide remains, however, with just underhalf of households in the bottom income quintileusing the Internet at home, compared to 95 percentof households in the top quintile; Supply-side factors may also have an importantinfluence on the rate of broadband subscription:areas with more wireline providers have higherInternet subscription rates; Broadband provides numerous socio-economicbenefits to communities and individuals,The speed required for an Internet plan to be categorizedas “broadband” is ever-evolving, both in terms of theofficial FCC definition (currently speeds of 25 Mbpsdownload and 3 Mbps upload) and in terms of the speedrequired to derive maximum value from using theimproving labor market outcomes for subscribers,increasing economic growth, providing access tobetter health care, and enhancing civic participation; Academic research shows that using online jobsearch leads to better labor market outcomes,including faster re-employment for unemployedindividuals, yet because of a digital divide, lowincome households are less able to use these toolsthan high-income households; Unemployed workers in households with Internetwere 4 percentage points more likely to be employedone month in the future than those in householdswithout Internet. This difference persists over time.State of Broadband in the United StatesSince 2009, more than 260 billion has been invested inbroadband infrastructure, largely by the private sectorbut also by the public sector. Investments from theFederal Government alone have led to the deploymentor upgrading of over 115,000 miles of networkinfrastructure. The President has announced concretesteps to ensure that fast and reliable broadband isavailable to more Americans at the lowest possible cost,and these initiatives are bearing fruit. For example, in2013 roughly 40 million students lacked access tobroadband at their schools and, in response, thePresident’s ConnectED initiative was created to helpconnect 99 percent of American students to high-speedbroadband in their classrooms and libraries by 2018.Data from 2015 show that since ConnectED waslaunched in 2013, an additional 20 million students and1.4 million teachers now have access to fast broadbandInternet. In recent years studying the effect of Internetuse on outcomes such as job search has essentiallybecome equivalent to studying the effect of broadbanduse, again because of the speeds required to get the mostout of Internet-based platforms.
Table 1: Percent of U.S. Households with Internet Access, 2001 to 20142001 2003 2007 2009 2013 2014All Households50.6 54.7 61.5 68.7 74.4 75.8Race of head of householdWhite aloneBlack aloneAsian aloneNative American AloneHispanic of any 6.777.663.387.658.368.5Educational attainment of head of household*Less than high schoolHigh school graduateSome collegeCollege graduate or .9*Internet access by educational attainment is displayed here for those households where the head of the household is aged 25 orolder.Source: Current Population Survey, Census (1998, 2000, 2001, 2003, 2007, 2009); American Community Survey, Census (2013,2014); CEA calculations.in the classroom, about halfway to ConnectED’s goal. 2 Asanother example, in July 2015, the U.S. Department ofHousingandUrbanDevelopmentunveiledConnectHome, a new initiative involving communities,the private sector, and the Federal Government,designed to expand broadband access to more familiesacross the country. The pilot program launched in 27cities and one tribal nation and will initially reach over275,000 low-income households, including 200,000children.Analysis of recently released data from the AmericanCommunity Survey (ACS) 3 presented in Table 1 indicatesthat the percent of U.S. households who subscribe to theInternet continues to increase. In 2001, 51 percent of2These data are available through EducationSuperhighway’s 2015 State of the States report.3The 2014 American Community Survey data, released inDecember 2015, are the most recent ACS data available.4The ACS defines Internet access as whether “anyone inthis household uses the Internet from home.” The resultsand overall trends in the data are qualitatively similar evenwhen instead analyzing the question of whether or not theindividual used the Internet at all over the past year,irrespective of having a subscription. Between 2012 and2013, Census switched from using the Current PopulationSurvey to the American Community Survey as theirU.S. households subscribed to the Internet; this numberhas risen to over 75 percent in 2014. 4 Minorityhouseholds saw even larger gains over this time period.For example, households with a Black or Hispanic headof household both saw their rate of Internetsubscriptions double from 2001-2014 (compared to a 50percent increase for all households). 5Challenges remain, however. As indicated in Table 1,Black, Native American, and Hispanic households reportlower Internet subscription rates compared to nationalaverages. Households headed by individuals with a highschool education or less also report lower Internetsubscription rates. These racial and educationalattainment disparities are indicative of a digital divide.primary measure of Internet use, as the latter facilitatedmeasurement at a higher level of geographical resolution.As a result, the magnitude of the increases in adoptionrates observed between years on either side of this breakmay not be precisely measured. In addition, the numberof observations for Native American households in thesesamples is so small that the exact magnitude of year-toyear increases in their adoption rates may also beimprecisely measured.5“White alone” indicates that the heads of household arewhite only, and similarly for the other categories.2
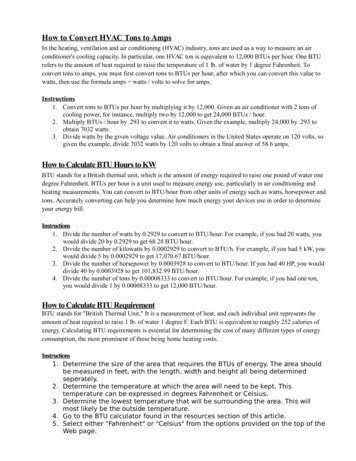
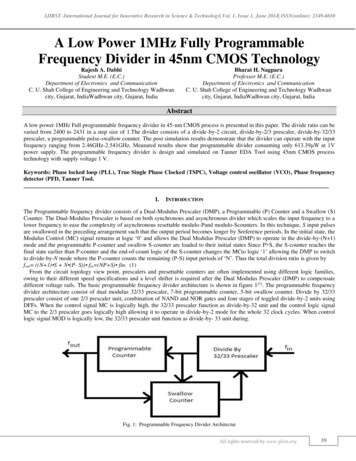
The digital divide was explored in depth in an issue briefpublished by the Council of Economic Advisers (CEA) inJuly 2015 that used 2013 ACS data.One way to visualize the digital divide in the U.S. is to plothow home Internet use varies by household incomeacross different areas of the country. In Figure 1 below,each dot represents a single area (technically a PublicUse Microdata Area or PUMA), containing roughly100,000 residents. The figure uses data from the 2014ACS data (the most current data available) to plot themedian household income for each area versus the shareof households in the same area that report using theInternet at home. The figure shows a strong positivecorrelation between income and Internet use. Areas ofthe country with higher household income exhibit higherhome Internet use, and areas of the country with lowerhousehold income report lower home Internet use. Butincome is not the only factor; it only explains 64 percentof the variation in home Internet use and even whenholding income constant—for example, when comparingareas around the average median household income—the percent of households using the Internet varies byplus or minus about 10 percentage points.Figure 1: Household Income and Home Internet Use, 2014Percent Using Internet by PUMA100use between urban and rural populations. For thepurposes of this brief, areas are defined as rural whenthey have a density of fewer than 1,000 persons persquare mile and urban when they are above thatthreshold. 6 According to data from the 2014 ACS,approximately 79 percent of urban households use theInternet at home, compared to 74 percent of ruralhouseholds. 7Figures 2a and 2b use household level data from the2014 ACS to provide additional analysis of the ways inwhich Internet use varies with income. Figure 2aindicates that only about 49 percent of households withincome in the bottom quintile of the household incomedistribution—those households that are earning lessthan 21,700 per year—are using the Internet. Incontrast, approximately 95 percent of households in thetop quintile of the income distribution are using theInternet. Figure 2b indicates that of the estimated 62million Americans not using Internet at home,approximately 21 million of them, about 35 percent, arein the lowest income quintile. 8 These estimates werecalculated by totaling the number of persons living inhouseholds in each household income quintile with andwithout internet in the home.Figure 2a: Households Using Internet at Home by Income, 2014Percent of 000150,000Median Household Income by PUMA200,000Source: Census, American Community Survey; CEA Calculations.01234Household Income Quintile5Source: Census, American Community Survey; CEA calculations.Another dimension of the digital divide, though less starkthan the divide by income, is the difference in Internet6As a result of this definition, approximately two-thirds ofthe areas are classified as urban, and the remaining onethird as rural.7According to the issue brief published by CEA in July2015, the spread between the lowest density quartile ofareas and the highest was 9 percentage points. In contrastthe spread between the lowest income quartile of areasand highest was 24 percentage points (Table 2).8There are not an equal number of persons in eachincome quintile because the quintile boundaries aredetermined by household income quintiles, and higherincome households tend to be larger.3
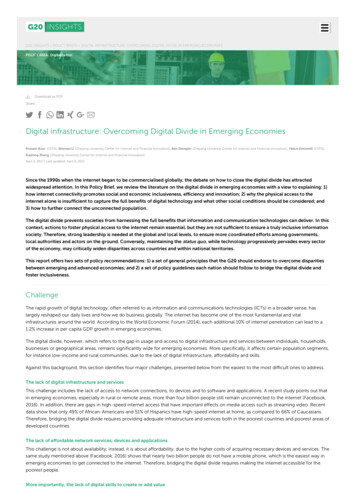
Figure 2b: Persons Using Internet at Home by Income, 2014Millions of 052With Internet at HomePercent Using Internet10064Without Internet at Home60Figure 3: Number of Provider Choices and Internet Use, 20147234Household Income Quintile4205012345Average Number of Wireline Choices67Source: Census, American Community Survey; NTIA/FCC, Broadband Map; CEA Calculations.Source: Census, American Community Survey; CEA calculations.Role of CompetitionAddressing the digital divide requires effort on multiplefronts, including policies that make broadband moreaffordable (NTIA 2013; GAO 2015). There are substantialdifferences in levels of competition across differentgeographic areas of the United States, which are likely tocorrelate with both service quality (i.e. speed) and price.That is, in areas where there is more competition, all elseequal, we should see higher levels of service quality andlower prices which, in turn, should lead to higherpercentages of Internet usage. Figure 3 plots each areaby the average number of choices for wireline Internetavailable in the area against the percent of households inthe area that use the Internet at home.9 In general, thereis a positive relationship between the number ofproviders (x-axis) and the percent of households usingthe Internet (y-axis).It is important to point out that the relationship betweenthe number of wireline choices and Internet use in Figure3 is a correlation and not necessarily causal. Usingregression analysis to further investigate the relationshipbetween the number of wireline choices and Internetuse, and controlling for a number of potentially relevantdemographic variables like income, age, race, education,and population density, reveals a statistically significantrelationship between the number of wireline choices andthe share of households using Internet at home. That is,this result suggests that as the number of wirelinechoices increase, so too does the probability of Internetuse. This positive relationship has been documented inother studies. For example, Kolko (2010) matches datafrom the Federal Communications Commission (FCC) onthe number of broadband providers at the zip code levelwith data from Forrester Research on the percent of thesurvey respondents in the zip code using broadband.Kolko finds a strong positive correlation between thenumber of competing providers and the probability ofbroadband use.The positive correlation between the number ofproviders and the probability of broadband use is likelydriven by the increase in competition between providersas their number increases, which in turn leads to lowerprices and/or higher quality offerings. The benefits ofcompetition have been documented elsewhere, in bothinternational and domestic contexts. A 2014 OECD9The average number of wireline choices for a givenPUMA is calculated using data from the NationalBroadband Map, a collaboration between FCC and NTIA.We calculate this average by taking the sum of thecumulative access rates for each number of wirelinechoices (i.e. the sum of percent of the PUMA with at least1 provider, the percent with at least 2 providers, thepercent with at least 3 providers, etc.).4
survey of eleven OECD member countries found thatnew entrants in wireless markets have a substantialimpact on both prices and quality of service, even whena market already had several participants (i.e. the fourthentrant into a wireless market with three existingparticipants substantially improved costs and services).Even the threat of new competition can lead to serviceimprovements (Seamans 2012). When Google Fiber wasto be rolled out in Kansas City, speeds on existingnetworks in Kansas surged 86 percent, which was, at thetime, the largest year-over-year jump in bandwidthobserved in any state in 2012 (Talbot 2013). Likewise,when Google Fiber indicated it would begin offeringextremely fast connection speeds in Austin, TX, AT&Tresponded by announcing its own gigabit network (Steffy2014).Competition can take many forms, including additionalprivate Internet service providers, cable companies, andeven city-owned systems. As envisioned by theTelecommunications Act of 1996, the FederalGovernment’s role has been to promote competitionand reduce regulation for the sake of lower prices andhigher quality service in “any communications business,”which explicitly includes Internet. One potentiallyimportant source of such competition is that offered bymunicipal providers, whose role the Presidenthighlighted in Cedar Falls, Iowa in January 2015. Severalcommunities have made use of these services, which insome localities approaches speeds of 1 Gbps, toencourage competition, drive innovation, and saveconsumers money. 10Until recently, some of the communities that have reliedon municipal broadband to increase competition,10For more detail on the specific communities(Chattanooga, TN, Wilson, NC, Lafayette, LA, ScottCounty, MN, and Leverett, MA, among others) that haveunveiled this service and the benefits they enjoy, see thefollowing Executive Office of the President les/docs/communitybased broadband report by executive office of the president.pdf11North Carolina and Tennessee have since sued the FCCin the D.C. Circuit. DOJ has formally announced that itwould not take a position in those cases.12A study of OECD countries by Czernich, Falck,Kretschmer, and Woessmann (2011) finds that a 10percentage point increase in broadband penetrationnamely those in North Carolina and Tennessee, weresubject to state laws designed to protect privatebroadband providers from government competition. TheFCC ruled in February 2015 that it would preempt suchregulations—a move supported by the Administration. 11In doing so, the FCC relied on the broad authorities it isgranted by Section 706 of the Telecommunications Actof 1996 to “promote competition in the localtelecommunications market, or other regulatingmethods that remove barriers to infrastructureinvestment.”Benefits of BroadbandAddressing the digital divide is critical to ensuring that allAmericans can take advantage of the many welldocumented socio-economic benefits afforded byInternet connections. These benefits are most evidentwhen consumers have access to the Internet at speedsfast enough to be considered broadband; these speedsare required to facilitate full interaction with advancedonline platforms.By 2006—before the widespread availability ofstreaming audio and video—broadband Internetaccounted for an estimated 28 billion in U.S. GDP(Greenstein and McDevitt 2011). Nearly half of this totalwas due to households upgrading from dial-up tobroadband service. By 2009, broadband Internetaccounted for an estimated 32 billion per year in netconsumer benefits (Dutz, Orszag, and Willig 2009). Thesefindings are broadly consistent with studies that coverother countries. 12 Broadband expansion is alsoassociated with local economic growth in some cases. 13boosts per capita growth rates by 0.9 to 1.5 percentagepoints. A cross-country analysis by Najarzadeh,Rahimzadeh, and Reed (2014) finds that a one percentincrease in the size of a country’s Internet-usingpopulation increases GDP per employed person by 8 to 15dollars.13DiMaggio and Bonikowski (2008) use CPS data from2000 and 2001 and find that Internet use leads to higherwages. Forman, Goldfarb, and Greenstein (2012) showinvestments in broadband infrastructure are correlatedwith wage and employment growth in 6 percent of UScounties, representing 42 percent of the U.S. population.Whitacre, Gallardo, and Strover (2014) find that ruralbroadband adoption in the United States was positivelyassociated with income growth between 2001 and 20105
Kolko (2012) finds that growth is particularlyconcentrated in industries that are more IT-intensive andin areas with lower populations. In addition, insofar as itallows a person to participate more fully in the economy,developing Internet skills may even positively affect aperson’s wages (Goss and Phillips 2002).Broadband has made medical care and medicalinformation more convenient and more accessible.Finkelstein, Speedie, and Potthoff (2006) show thatbroadband-enabled virtual visits with trained medicalprofessionals can improve patient outcomes at lowercost and with a lower risk of infection than comes withconventional care provided in person. GAO (2010) findsthat telemedicine is particularly valuable for ruralpatients who may lack access to medical care, astelemedicine allows them to receive medical diagnosesand patient care from specialists who are locatedelsewhere. Broadband can also be used to moreaccurately track disease epidemics. Various studies havedemonstrated how large datasets from search enginesand social media can be exploited in this way (e.g.,Ginsberg et al. 2009; Paul and Dredze 2012).Broadband also enables access to lower-cost onlineeducation. Deming et al. (2015) find that a 10 percentincrease in college students taking all their coursesonline is associated with a 1.4 percent decline intuition. 14 The importance of the role that the computerand broadband more specifically play in enablingstudents to do their homework is evidenced by the factthat nearly half of 14 to 18 year olds report that they usea library computer, commonly for homework (Becker etal. 2010). This finding suggests that library computers canprovide a crucial source of access for students whowould not otherwise have the ability to get online.between 2000 and 2004 (Rainie et al. 2005). As of 2013,50 percent of the public cited the Internet as their mainsource of national and international news (Caumont2013). Access to broadband also may increase civicparticipation. Tolbert and McNeal (2003) find that accessto the Internet was associated with an increasedprobability of voting by 12 percent in the 2000 election.Other studies have also found a positive associationbetween Internet access and voting behavior, thougheffect sizes have been smaller (Boulianne 2009).As noted in the FCC’s National Broadband Plan (FCC2010), broadband can provide other benefits as well,such as supporting entrepreneurship and smallbusinesses, promoting energy efficiency and energysavings, improving government performance, andenhancing public safety, among others. In addition,broadband has become a critical tool that job seekers useto search and apply for jobs, as highlighted in more detailbelow.Online Job Search & Labor Market OutcomesBroadband can help individuals to search for jobs in avariety of ways. They can find openings on job postingwebsites, submit applications and resumes online, andcommunicate with potential employers via email. Theprevalence of these search methods has increased sincethe early days of the Internet. For instance, from the late1990s to 2008, the share of unemployed individuals intheir 20’s who used the Internet for job search increasedfrom 24 to 74 percent (Kuhn and Mansour 2014).Furthermore, an increasing share of all job openings nowadvertise through online ads. One estimate suggests thatin June 2013, online ads were posted for 60 to 70 percentof total job openings (Carnevale et al. 2014). 15Research has also highlighted that the Internet hasbecome an increasingly important source of information.A study by the Pew Research Center finds that thenumber of registered voters who cited the Internet asone of their primary sources of news about thepresidential campaign increased from 11 to 18 percentData from the Current Population Survey’s (CPS)Computer and Internet Supplement and questions on jobsearch (the combination of which are available in 1998,2000, 2001, 2003, and 2011) indicate that the percent ofrespondents using online job search has increased overand that growth in unemployment rates was lower than itwould have been in the absence of broadband.14However, there is mixed evidence as to whether onlineinstruction offers similar quality as off-line instruction.Bowen et al. (2014) find little difference in quality,whereas Joyce et al (2014) find that students enrolled in a“traditional” course format scored 2.3 points higher onmidterms and finals, on average, compared to thoseenrolled in a “hybrid” course format.15Online ads are, however, not representative of all jobopenings and disproportionately represent high-skill andhigh-education openings (Carnevale et al. 2014).6
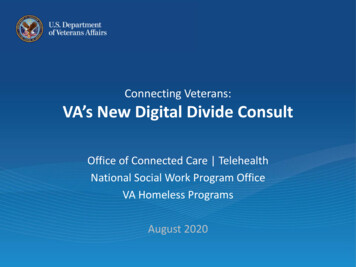
time (Figure 4). 16 This increase is due to both expandedInternet use and an increase in the use of online jobsearch among individuals with Internet access. However,the incidence of use varies by family income. In 2011,respondents in households making more than 75,000annually were nine percentage points more likely to useonline search than those in households making less than 20,000. 17Figure 4: Percent of Individuals using Online Job SearchPercent Using Online Search40Annual Family35Income ( Thousands)0-2020-403040-7575 252015105019982000200120032011Source: Current Population Survey Computer and Internet Supplements.Note: The sample includes all individuals age 16 with and without access to the internet.There are many potential benefits to online job search,relative to traditional search. The Internet allowsindividuals to search a larger set of job postings and tofind very specific openings. Transaction costs ofsubmission are much reduced; clicking a mouse is lesscostly than printing and mailing applications. Recently,online search websites have started using algorithms tocreate better matches between potential employees andemployers. 18 Thus, potential employees as well asemployers benefit from better matches. These benefitsall increase the likelihood that online searchers will finda better job match while spending less time and effortsearching.16The CPS provides some information on computer andInternet use in 2007, 2009, 2010, 2012, and 2013 as well,but items on job search were not included in those years(with the exception of 2012, which lumped job searchtogether with job training, and 2013, where discrepanciesbetween the questions prevent comparison).17Family income is defined as “combined income of allfamily members during the last 12 months. Includesmoney from jobs, net income from business, farm or rent,pensions, dividends, interest, social security paymentsand any other money income received by family memberswho are 15 years of age or older.”On the other hand, lack of broadband access can be anobstacle to finding a job. Recent Pew research indicatesthat job seekers without broadband at home have aharder time contacting potential employers, filling outonline job applications, creating a professional resume,and highlighting employment skills on social media(Smith 2015). Public libraries have become an importantresource to help fill the need of job seekers that lackbroadband at home. Becker et al. (2010) estimated that30 million Americans used library computers andInternet access to conduct job searches, submit onlinejob applications, and receive job-related training in 2009.Recent academic research finds evidence that one of thepotential benefits of online job search is that it decreasesthe duration of unemployment spells for onlinesearchers. Kuhn and Mansour (2014) find that youngunemployed individuals who used the Internet in theirjob search from 2005-2008 were re-employedapproximately 25 percent faster than comparableindividuals who used only traditional methods. Theirresults are robust to controlling for Internet access,cognitive ability, and individual characteristics. There isalso academic research that finds that it is common foremployed workers to engage in online job search andthat employed individuals who use the Internet to searchfor jobs are more likely to transition to a new job(Stevenson 2009). 19 In addition, Atasoy (2013) finds thatbroadband Internet is associated with higheremployment rates, especially in rural counties. Dettling(2013) finds that broadband Internet is especially helpfulin increasing labor force participation for marriedwomen.Figure 5 presents data from the 2010-2013 CurrentPopulation Surveys on the relationship between use ofthe Internet and the percent of unemployed individuals18For example, eHarmony recently launched anemployment service that uses algorithms similar to itsmatchmaking algorithms to match potential employeesand employers based on skills, background, personality,and culture (Reaney 2015).19Other studies on the effect of the Internet on individuallabor market outcomes find positive effects (Choi 2011;Bagues and Labini 2009). However, Kroft and Pope (2014)find no evidence that the rapid introduction of Craigslist’sjob boards between 2005-2007 reduced localunemployment rates during that same time period.7
who were later employed. 20 (If an unemployed individualdoes not become employed, then that individual eitherremains unemployed or exits the labor force.) Figure 5shows that one month in the future, 19 percent ofunemployed individuals in households where someoneused the Internet are employed compared to only 15percent of individuals in households without Internetusage. 21 This difference persists and actually increasesover the next 12 months (46 percent vs. 34 percentemployed for those in households who do or do not usethe Internet, respectively).Figure 5: Share of Unemployed Individuals whowere Later Employed, 2010-2013Percent Later Employed50Internet Usedin Household40NoYes3020100132Months in the Future12Source: 2010, 2011, 2012, and 2013 Current Population Survey and CEA calculations.The differences in the employment outcomes betweenhouseholds that do or do not use the Internet in Figure 5are statistically significant, meaning there is a lowprobability that the differences are random. The basicrelationship—where those households who use theInternet exhibit better employment outcomes—remainseven after controlling for a number of demographicvariables such as age, education, race, and familyincome, as well as the number of weeks that theindividuals were previously unemployed for. Moreover,previously cited research (e.g., Stevenson 2009; Kuhnand Mansour 2014) has undertaken sophisticated20The figure includes all unemployed individuals in theOct. 2010 and Oct. 2012 School Enrollment and InternetUse CPS Supplements and the Jul. 2011 and Jul. 2013Computer and Internet Use CPS Supplements. These arethe last four CPS supplements that include home Internetaccess. The figure presents the share of all unemployedindividuals (not only individuals in their first month ofunemployment) that are employed in the future. Thesample weights are scaled such that the sums of weightsfor each year are equal. Although these results are fromstatistical techniques that suggest that at least part ofthese correlations may be causal relationships.It is also possible that the labor market benefits of onlinejob search have increased over time. In an earlier study,Kuhn and Skuterud (2004) do not find lowerunemployment durations for online searchers in 1998and 2000. However, in a more recent paper that findslower unemployment durations, Kuhn and Mansour(2014) suggest that increases in the labor market benefitof online job search over time is due to the technologicalimprovements in search websites and the increasedprevalence of online search.Social media may be another way that potentialemployees are con
Internet subscription rates; 1.4 million teachers now have access to fast broadband Broadband provides numerous socio-economic benefits to communities and individuals, 1 The speed required for an Internet plan to be categorized as "broadband" is ever-evolving, both in terms of the official FCC definition (currently speeds of 25 Mbps