Transcription
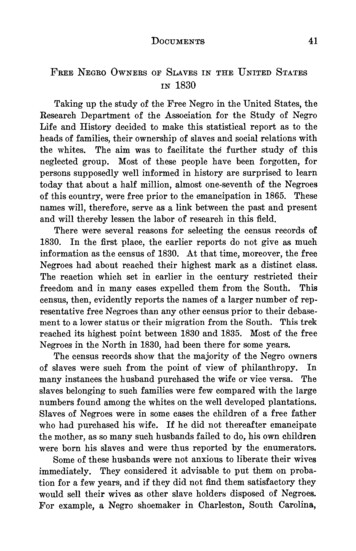
peak early in 1950, the proportion of Negroesemployed in nonagricultural industries, particu-Employment andIncome of Negrolarly in manufacturing, decreased markedly.However, changes in the employment status ofNegroes have been attributed partly, by someobservers, to the effects of such other forces asgrowing governmental concern with the questionWorkers - 1940-52of racial and group discrimination. The FederalGovernment, early during the World War IIperiod, initiated executive action to promote fairemployment practices; the Committee on FairMary S. Bedell*Employment Practice continued in operation untilJuly 1945, when the Congress discontinued itsappropriation. Subsequent Executive Orders pro-hibited discrimination in the Federal Civil Serviceand the Armed Services. Since 1943, Federalcontracts and subcontracts have contained fairNegro workers, in terms of employmentandemploymentclauses; and in 1951, PresidentTruman establisheda Committee on Governmentincome, were less well off than white workersinContractCompliance to find ways of strengthening1952, although the comparison was morefavor-able than in 1940. The improvement wasdue with those provisions.2 All of thesecompliancehave diminished discrimination in Fedalmost entirely to the fact that Negroes, measuresin shiftingeral toemployment(both direct and indirect) .to nonagricultural industries, were ablegetbetter jobs and were, therefore, less heavilycon- 11 States and 25 municipalities hadIn addition,centrated in the traditionally unskilledand lowadoptedsome form of fair employment practicewage occupations. The relatively greatergains between 1945 and mid- 1952. On thelegislationof Negroes during this period of unprecedentedlatter date, it was estimated that " enforceablelevels of economic activity suggest theirFEPparticularlaws [were] in operation in areas that includesensitivity to economic developments.1 about a third of the Nation's total population. . . and about an eighth of the nonwhites." 3Administrators of these laws have reported theFactors in the Changing Employment Pictureopening of many job opportunities to workersformerlybarred by reason of their race, color,The narrowing of the differentials in theemployment status of Negro and white workers reflectsthe combined effect of broad economic and social*Of the Bureau's Office of Publications.i The statistics used in this analysis were drawn principally from BLSBulletin No. 1119- Negroes in the United States: Their Employment andviewforces. Many authorities have expressed theEconomic Status. Other sources are shown at the point of reference.that the high level of economic activity prevalentThe term Negro is used in the text of this article, as in the Bulletin, althoughmost of the data presented refer to nonwhites, of whom Negroes compriseduring virtually all years from 1940 to 1952 wasmore than 95 percent.the more directly responsible for the recorded ima In January 1953, the Committee issued its report, entitled "EqualEconomic Opportunity."provements in the Negro's employment position.3 State and Municipal Fair Employment Legislation, Staff Report to theSupport for this position is found in the fact thatSubcommittee on Labor and Labor-Management Relations, Committee onLabor and Public Welfare, United States Senate, 82d Congress, 2d Session,employment rates increased twice as much forWashington, 1952.Negroes as for whites from 1950 to 1951, whenThe 11 States are: Colorado, Connecticut, Indiana, Massachusetts, NewJersey, New Mexico, New York, Oregon, Rhode Island, Washington, andtotal employment expanded by about 1 million.Wisconsin. The 25 municipalities are: Ohio - Akron, Campbell, Cincinnati,Conversely, there is some evidence that reconCleveland, Girard, Hubbard, Lorain, Lowellville, Niles, Steuben ville,Struthers, Warren, Youngstown; Pennsylvania - Farrell, Monessen, Philaversion affected Negroes more severely than whitedelphia, Sharon; Illinois - Chicago; Indiana - East Chicago, Gary; MinneMinneapolis; Wisconsin - Milwaukee; Arizona- Phoenix; California Richmond; and Iowa- Sioux City. The cities of East Chicago and Gary, Inincreaseddiana, and Milwaukee, Wisconsin, are in States that have educational FEPworkers: from July 1945 to April 1946, for example,sota -unemployment rates among nonwhitesmore than twice as much as among whites. Andlaws. Several communities have since adopted fair employment practiceordinances, the largest being Pittsburgh, Pa.when the unemployment rate reached a postwar596
NEGRO EMPLOYMENT AND INCOME 597religion, or national origin.ofSomeLabor andhavethe Congressexpressedof Industrial Organizaconcern, however, that the fairlytions aresmallactive proponentsnumberofofFederal fair emcomplaints alleging discriminationployment practicesdoeslegislation,not fullyand several nationaland international unionshave special programsmeasure the extent of noncompliance,althoughtheir experience has been thatthe tomereexistencedesignedeliminatediscrimination in employof enforcement powers is a potentment. Recognizingfactorthis,in theproPresident's Commit-on fact,GovernmentCompliance 2 commoting merit employment.teeInno Contractcompre-mented,however,legislationthat "At local levels,hensive measure of the effectof suchis unionavailable, and some interpretationsdiscriminationofagainstexistingN egroes anddataother minoritiespersists. TheCommittee has maywitnessed examplesrecognize that favorable economicconditionsof uniondiscriminationwhich havehindered emhave influenced the operationofthese laws.Onereporter commented: "Thatployerstheseappearfromlawscomplyingwith thetonondiscrimination clause inexistingtheir Governmentcontracts."have worked satisfactorily underconditions does not give assurance that they wouldcontinue to do so in a period Employmentof widespreadunemand Unemploymentployment . . . [for] the tendency to discriminatefewerNegroes than whites whoon the basis of race, color, or Relativelyreligionis obviouslyrather slight [in a tight labormarket]as comparedwantedto work couldfind jobs in 1952, although,with the temptation to do percentagewise,so under adverseecomore Negroeswere actually innomic conditions." 4the labor force. This was also true in 1940.Quite apart from legal sanctions, the adminisDuring this 12-year period, of course, total etrators of fair employment laws have relied ployment and the size of the labor force expandheavily upon educational efforts to build up publicsharply for both groups, with marked declinessentiment, and particularly to influence the atti-unemployment rates.tudes of both employers and workers. A recent To get an overall perspective of the separafigures, it is useful to note that in 1950 about 1report 3 indicated that "Many [employers] have. . . expressed their belief that such legislationmillion Negroes represented 10.5 percent of ttotal population. Birth rates have been conhas not prevented them from hiring the mostcompetent employees available and has had posisistently higher for Negroes than for whites, buttive beneficial effect." Some evidence of workers'so have mortality rates, and the age structures ofattitudes on this subject was revealed in a surveythe two populations are quite different. In conconducted by Factory magazine 6 in 1949 to findsequence, Negroes 14 years old and over comout, among other things, how factory workersprised only 9.8 percent of the population offelt about Federal fair employment legislationworking age.then pending in Congress. About two-thirds of The civilian labor force in 1952 totaled nearlythe workers favored the legislation: the percent of63 million and included 56.9 percent of the whitethose who approved ranged from 48 in the South and 62.2 percent of the Negro population of workto 85 in New England. Slightly more than a ing age. Virtually all of the difference was duefourth disapproved, and the remainder expressedto the fact that 44.2 percent of the Negro women,no opinion.compared to 32.7 percent of the white women,Paralleling governmental action, many privatewere working or seeking work. In 1951, only ingroups, both national and local, have become the age group from 18 to 24 years was the proporincreasingly interested in ameliorating or checkingtion of Negro women in the labor force below thatdiscrimination. Some leaders of organized labor,for whites. The rates for men were practicallyparticularly in recent years, have been outstandingidentical, although in 1951 a significantly higherin such activities: both the American Federation* W. Brooke Graves, Chief, Government Section, Legislative ReferenceService, U. S. Library of Congress, "Fair Employment Practice Legislationin the United States, Federal-State-Municipal," Washington, D. C., April1951.8 Factory Management and Maintenance, Vol. 107, No. 11, p. 102, November 1949. The survey covered a representative sample of workers, distributedamong 34 States which account for 97 percent of total factory employment.proportion of Negro men under age 20 and over age65 were in the labor force. In 1940, the civilianlabor force was 55.6 million; no participation ratescomparable with those for 1952 are available.There is, however, evidence that the differentialbetween Negro and white rates narrowed over this
598 NEGRO EMPLOYMENT AND INCOME MONTHLY LABORTable 1. - Percent distribution of employment among major indus19401950Industry group White Nonwhite White NonwhiteTotal Male Female Total Male Female Total Male Female Total Male ed3)i Less than 0.1 percent. a Figures do not necessarily add to totals because of rounding.Source: U. S. Bureau of the Census.entered the labor force, the proportion of employed12-year period, due almost entirely to a relativelywomen who were Negroes decreased. The progreater increase in the proportion of white thanportion of Negroes in the number of employedof Negro women in the labor force.About 1 in 4 white women was in the labor forcemen was practically unchanged.in 1940; the ratio was approximately 1 in 3 in 1952.Industrial and Occupational DistributionMarried women were responsible for most of thisincrease, the proportion of white married couplesIn terms of the types of employers for whomwith the wife in the labor force having grownfrom about 11 percent in 1940 to more thanthey22 worked and the kinds of jobs they had, thedifferences between Negroes and whites narrowedpercent in 1950. Among Negro couples, the comsomewhat more between 1940 and 1952 than didparable figures were 24 and 37 percent - considerdifferences in the overall employment ratios. Theably above those for white couples on both dates,although the relative difference was less atmostthe striking change in both the industrial andoccupational composition of employment was aend of the 10-year period.much more pronounced shift away from agriculUnemployment rates also are consistentlyture for Negroes than for whites. The geographihigher for Negroes than for whites. From 1940cal distribution of Negro employment also changed,to 1952, unemployment decreased from 8.1 millionbecause 90 percent of all Negro agricultural workto 1.7 million - from about 14.5 percent to 2.7ers in 1940 were in the South. Many of thempercent of the civilian labor force. In the lattermovedto urban areas - in the North and West, asyear, 4.6 percent of the Negroes and 2.4 percentof the whites in the labor force were unemployedwell as in the South. As a result, during the 1940's- the lowest rates for both groups recorded in theany proportion of all employed Negroes workingin the South fell from three-fourths to two-thirdsyear since the end of the war. Further, a com-parison of 1950 unemployment rates for Negro andand the Negro population became predominantlywhite men in different age groups reveals thaturban,the for the first time.Agriculture, in 1950, still represented about amost significant difference is within the age groupfifth of all Negro workers, and the service indus25 to 34 - the workers most sought by employers.tries continued to provide jobs for about a third.The overall unemployment rate was then 5 perWhile these two industry groups remained thecent; among men in this age group, the rates werelargest sources of Negro employment, they were10.5 percent for Negroes and 3.8 percent for whites.considerably less important in the total than inTotal employment rose from 47.5 million in 1940to 61.3 million in 1952. In April of the latter1940, when more than two-thirds of all employedNegroes worked in one or the other. In contrast,year, 9.6 percent of all persons with jobs wereless than a third of all white workers were so emNegroes. This was slightly less than the 1940ployed in 1950, as shown in table 1.ratio because, as relatively more white women
REVIEW,JUNE1953Negroesmademanyservice increased,with a marked rise gainsin the semiemployment skilledduringWorldW"operatives" classification.In spite ofportunitiesforindustrialemsubstantialreductions in the percentage of Negrotothem.Ingeneral,wworkers who were either laborers or theirservice workers,beenretainedinthepostwain 1950these occupationswere stillthe most imevenlargerproportionsofemportant for Negro men and women, respectively.workinginnonagriculturaliThey accounted for more than half of all employedin 1950. These recent increases more than offsetNegro workers; in contrast, less than one fifth ofthe interruption of the trend away from agriculwhite workers were so employed, as shown inture which occurred in 1949 and 1950 when unem-table 2.Negro men, by 1952, had made additionalNegroes made notable employment gains ingains as operatives, and in April of that yearployment rates reached postwar peaks.manufacturing, construction, and trade from 1940 accounted for nearly 10 percent of all men em-to 1952, and the proportion employed in the do-ployed as operatives, although fewer than 9mestic and personal services segment of the service percent of all employed men were Negroes. Theyindustries declined in spite of a slight postwar up- continued to hold about the same small share ofswing which culminated in 1950. An even largerprofessional, clerical, and craftsman jobs as inproportion of Negro men worked in the first two 1950. In these three occupational groups, theindustries in 1952 than in 1950; the proportion of proportion of Negroes in total employmentNegro women in manufacturing, on the other hand, increased relatively more between 1940 and 1952had declined slightly, but this decrease was morefor women than for men. However, in the latterthan offset by a somewhat higher proportion em- year, the proportion of women employed in suchployed in trade. The percentage of Negro womenjobs who were Negroes was very small in comworking in professional services increased sharply parison with the 11.4 percent of all womenafter 1950, accentuating a steady growth since workers who were Negroes. In even more1940. By 1952, this industry group accounted for striking contrast with this overall ratio, morenearly 14 percent of all employed Negro women;than half of all women employed in privatework in domestic and personal services, however, households were Negroes.still comprised more than half the total.Another important aspect of the Negro'sWith the shifts in the industrial distribution oíemployment pattern was the heavy concentrationNegro employment came changes in their occupa- in occupations characterized by lower job stational patterns, particularly in farm and manufac-bility and by casual and part-time work whichturing jobs. The proportion of Negroes workinginterrupts job tenure. A Census survey6 inin all nonagricultural occupations except domestic6 For discussion, see Monthly Labor Review, September 1952 (pp. 257-262).Table 2. - Percent distribution of employment among major occupational groups , by color and by sex , April 1950 and March 194019401950Occupational group White Nonwhite White NonwhiteTotal Male Female Total Male Female Total Male Female Total Male redworkersmanagersManagers, officials, and proprietors, excluding farm 9.1 10.6 4.3 1.4 1.6 .8 9.8 11.6 4.8 1.5 2 0 : U. S. Bureau of the Census.donotnecessarilyadd
Emoneyincomefamiliesfor Negrostudents were ofinferiorin the southern,19J¡.5-50blocalities involved in the test cases. Throughoutthe South, the public schools are segregated onthe basis of race, under the prevailing "separateresidence nonwhiteTntfli Total WhitPWhiteNon- t0 whitebutequal" doctrine.Tntfli Total WhitPWhitewhite [percent]Median money income ralnonfarmRural1945:farmTotalUrbanRuralRuralThe cumulative effect of all these differences infarmTotalnonfarmfarm* Urban-rural data not available for 1950.2 Data for total and rural farm not available for 1946.3 Information not available.* Median not shown where there are fewer than 100 cases in the samplereporting on income.Source: U. S. Bureau of the Census.the number and type of job opportunities forNegro and white workers was evidenced by theparticularly sharp contrast in their averageincome. In 1950, Negroes' income averaged butlittle more than half that of whites, although theirposition was relatively better than prewar. Notonly did the Negro have less purchasing powerthan the average white worker, but he faced aless secure old age and his dependents were not sowell provided for in the event of his death.The median income of Negro wage earners andsalaried workers was 1,295 in 1950 - 48 percentless than for comparable white workers. (Theoverall ratio showed the combined effect of a muchearly 1951 showed that whites had consistentlyless favorable comparison for women than forlonger tenure on their current jobs than didmen and the considerably larger proportion ofNegroes - the median number of years being 3.5Negro than of white earners who were women.)compared to 2.4. The difference was least fornonfarm workers - about 8 months for men and 7The difference was smaller than in 1939, largelybecause of a greater relative increase in themonths for women - but it prevailed for both menearnings of Negro men. Family income toldand women and for farm and nonfarm residents.Significantly, the percentage of white workers about the same story, although a substantiallywho had started on their jobs before 1940 was 18.3; higher proportion of Negro families had morefor Negro workers, it was only 10.7.Lower levels of education and vocationalTable 4. - Factors affecting OASI insurance status ofworkers with 19Jt9 earnings in covered employment 1training of Negroes in comparison with whiteshave been cited frequently as an importantMale Femaleunderlying factor for their occupational employ-Itemwork-ersment pattern. In 1950, Negroes aged 25 and over(comprising about four-fifths of the NegroPercentlabor permanentlyinsured 3 . 29.1 21.9 36.7 5.9 17.0Average wage credits, 1937-49:*force) had completed only 7 years of school,Per quarter of employment.almost 3 years less than the average for Averagewhitequarters in covered employment:persons. Although the educational differencesTotal 437 330 495 226 316TotalCreditable toward insur-narrowed between 1940 and 1950, the 9 percentance6Percentageof Negroes of high school and college age who wereoftotalqcreditablein school was still below the comparable figureMedianageof 14 percent for white young people. In addition,1 Based on a 1-percentprogram.recommendations of the President's Committee2 Includes all persons of races other than Negro.sam3 Includes workers who received at least 50 of wages in covered employon Government Contract Compliance 2 pointedment in each of 40 or more calendar quarters as well as others who were fullyinsured on reaching age 65. .* Wage credits are the amounts ofwhich OASI benefits are computed.« Only quarters of employment in which taxable wages are 50 or more countup the existence of discrimination against minoritygroups in some vocational, apprenticeship, andas quarters of coverage, in general.on-the-job training programs. Furthermore, re-Source: Federal Security Agency, Social Security Administration, Bureaucent court decisions held that the facilities providedof Old-Age and Survivors Insurance.w
REVIEW, JUNE 1953 NEGRO EMPLOYMENT AND INCOME 601than one earner. In 1950, the median annualincome of Negro families was 1,869 - 54 percentof the 3,445 average for white families - asIt should be pointed out that white workers withlow incomes are also insecure, and of course theirnumber is much larger, although smaller in propor-shown in table 3, and more than 80 percent of the tion to total white employment; however, manyNegro families had smaller incomes than the Negroes face a less secure old age than do whitemedian for white families. Concealed withinworkers in the same income classes. Both groupsthese figures is a major incentive for Negroesfind it todifficult to finance private insurance, butshift to nonagricultural employment duringonly 7theStates 7 prohibit discrimination on grounds1940's: the Negro who left the farm in 1950ofcouldcolor in life insurance premium rates and beneimprove his money income relatively morefits;thanhigher premiums for Negroes than for whitescould the white farm worker. Average familyare common. In the South, however, Negroincome derived chiefly from farm wages was37.7insurancecompanies service Negro clients on apercent of that from nonfarm wages or nondiscriminatorysalariesbasis.for Negroes, compared with 47.5 percent Inforaddition, the shorter length of a Negro man'swhites.Lower income also will affect the amount ofworking life has significant effects upon thesecurity of his dependents. In 1940, the medianbenefits for which a worker is eligible under agetheof separation from the labor force was 57.7Old Age and Survivors Insurance program.yearsFor for Negro and 63.6 years for white men,8the great bulk of Negroes working in agricultureprincipally as a result of higher death rates forand domestic service, the benefits they canNegroeslook at all working ages. Particularly signifforward to are also seriously affected by theicant for urban workers were the higher incidencerecentness of their coverage under the OASIof disability and a much greater concentration ofprogram (although all eligible workers are guar- Negroes in jobs in which age and physical disaanteed minimum retirement benefits of 25 ability were likely to be greater handicaps to conmonth). Such workers have been able to actinued employment. Negro men working oncumulate OASI credits only since 1950, and thenfarms retired later in life than white farm workers,only if they met the minimum tests of earnings andwith the result that the average retirement age fordays worked. These standards are particularly all Negro men was about 8 months above that forimportant for Negroes in view of the casual andwhite men.part-time nature of much of their employment.Table 4 presents data on the comparative status,under the OASI program, of Negro and white 1 Connecticut, Massachusetts, Michigan, Minnesota, New Jersey, NewYork, and Ohio. See Report of the Commission on Other Civil Rights, tomen and women as of January 1, 1950, before thethe 1952 Conference of National Association of Intergroup Relations Officials,relatively low-paid agricultural and domesticoccupations were covered by OASI.Washington, D. C.8 Tables of Working Life- Length of Working Life for Men, Bulletin No.1001, U. S. Department of Labor, Bureau of Labor Statistics, table 10.
and 62.2 percent of the Negro population of work-ing age. Virtually all of the difference was due to the fact that 44.2 percent of the Negro women, compared to 32.7 percent of the white women, were working or seeking work. In 1951, only in the age group from 18 to 24 years was the propor-tion of Negro women in the labor force below that for whites.
