Transcription
FIRST HALF 2021 RESULTSAUGUST 3, 2021
SAFE HARBOR STATEMENTThis document, in particular references to “2021 Guidance”, contains forwardlooking statements. In particular, statements regarding future financialperformance and the Company’s expectations as to the achievement of certaintargeted metrics, including revenues, industrial free cash flows, vehicleshipments, capital investments, research and development costs and otherexpenses at any future date or for any future period are forward-lookingstatements. These statements may include terms such as “may”, “will”, “expect”,“could”, “should”, “intend”, “estimate”, “anticipate”, “believe”, “remain”, “ontrack”, “design”, “target”, “objective”, “goal”, “forecast”, “projection”, “outlook”,“prospects”, “plan”, or similar terms. Forward-looking statements are notguarantees of future performance. Rather, they are based on the Group’s currentstate of knowledge, future expectations and projections about future events andare by their nature, subject to inherent risks and uncertainties. They relate toevents and depend on circumstances that may or may not occur or exist in thefuture and, as such, undue reliance should not be placed on them.Actual results may differ materially from those expressed in forward-lookingstatements as a result of a variety of factors, including: the impact of the COVID19 pandemic; the ability of the Group to launch new products successfully and tomaintain vehicle shipment volumes; changes in the global financial markets,general economic environment and changes in demand for automotive products,which is subject to cyclicality; changes in local economic and political conditions,changes in trade policy and the imposition of global and regional tariffs or tariffstargeted to the automotive industry, the enactment of tax reforms or otherchanges in tax laws and regulations; the Group’s ability to expand certain oftheir brands globally; its ability to offer innovative, attractive products; its abilityto develop, manufacture and sell vehicles with advanced features includingenhanced electrification, connectivity and autonomous driving characteristics;various types of claims, lawsuits, governmental investigations and othercontingencies, including product liability and warranty claims and environmentalAugust 3, 2021claims, investigations and lawsuits; material operating expenditures in relationto compliance with environmental, health and safety regulations; the intenselevel of competition in the automotive industry, which may increase due toconsolidation; exposure to shortfalls in the funding of the Group’s definedbenefit pension plans; the ability to provide or arrange for access to adequatefinancing for dealers and retail customers and associated risks related to theestablishment and operations of financial services companies; the ability toaccess funding to execute the Group’s business plans and improve theirbusinesses, financial condition and results of operations; a significantmalfunction, disruption or security breach compromising information technologysystems or the electronic control systems contained in the Group’s vehicles; theGroup’s ability to realize anticipated benefits from joint venture arrangements;disruptions arising from political, social and economic instability; risks associatedwith our relationships with employees, dealers and suppliers; increases in costs,disruptions of supply or shortages of raw materials, parts, components andsystems used in the Group’s vehicles; developments in labor and industrialrelations and developments in applicable labor laws; exchange rate fluctuations,interest rate changes, credit risk and other market risks; political and civil unrest;earthquakes or other disasters; the risk that the operations of Peugeot S.A. andFiat Chrysler Automobiles N.V. will not be integrated successfully and other risksand uncertainties.Any forward-looking statements contained in this document speak only as ofthe date of this document and the Group disclaims any obligation to update orrevise publicly forward-looking statements. Further information concerning theGroup and its businesses, including factors that could materially affect theGroup’s financial results, is included in the Group’s reports and filings with theU.S. Securities and Exchange Commission, AFM, CONSOB and AMF.H1 2021 RESULTS 2
STRONG START WITH RECORD PROFITABILITYRecord 11.4% Group AdjustedOperating Income (AOI) Margin(1)Strong Start to SynergiesExecution, with 1.3B of netMarket leader(2) inSouth America in H1 2021All In On ElectrificationEstablished Purposeand Values of GroupGovernance Fully Operativedriven by North America at record 16.1%cash synergies in H1 2021with 11 BEVs currently availablewith 23.6% share, up 620 bps y-o-yNew Peugeot 9X8Hybrid Hypercar(1) On a Pro Forma basis(2) Passenger cars (PC) plus light commercial vehicles (LCV)Note: Market share information is derived from third-party industry sources (e.g. European Automobile Manufacturers Association (ACEA), Ward’s Automotive, Associação Nacional dos Fabricantes de Veículos Automotores (ANFAVEA)) andinternal informationAugust 3, 2021H1 2021 RESULTS 3
NORTH AMERICA – RECORD PROFITABILITYRecord 16.1% AOI Margin(1)despite unfilled semiconductor orders,with strong pricing and mixAll-New Jeep Wrangler 4xe#1 Selling PHEV in U.S. Retailin Q2 2021 following commercial launchin Mar ‘21Highest U.S. Retail ATP(2)across portfolio in May and Jun ‘21at 46K and 48K, respectively,vs. competitorsAll-New Grand WagoneerProduction Startedin June, with commercial launchlate Q3 2021JeepWrangler PHEV(1)(2)Grand WagoneerTop 50Diversity Companyin U.S. from DiversityIncAll-New JeepGrand Cherokee 2-Rowto be revealed at NY Auto ShowJeepGrand Cherokee PHEVOn a Pro Forma basisPer J.D. Power and Associates Power Information Network (PIN) data and excludes Premium OEMsAugust 3, 2021H1 2021 RESULTS 4
ENLARGED EUROPE – MEANINGFUL PROFITABILITY IMPROVEMENT8.8% AOI Margin(1)CO2 Complianton Standalone BasisGrowing Market Sharein EU30(2)Ellesmere Port (UK)to be First All-BEVwith commercial and industrialperformance improvementswith 23.1% share, up 80 bpsvs. H1 2020Expansion in Eurasiawith ramp-up of LCV businessSigned PerformanceAgreements in Italy andAnnounced ThirdEuropean Gigafactorymanufacturing site from late 2022at Termoli (Italy) Powertrain PlantTermoliPlantFiat ProfessionalE-Ducato(1)(2)VauxhallCombo-eOn a Pro Forma basisEU 27 (excluding Malta), Iceland, Norway, Switzerland and UK (PC LCV share)August 3, 2021H1 2021 RESULTS 5
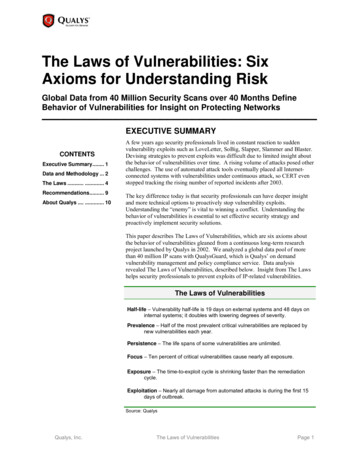
REST OF WORLD – STRONG GROWTHSouth AmericaMiddle East & AfricaMarket Leader(1) in Region,Brazil and Argentina9.7% AOI Margin(2)with strong pricing performancewith share of 23.6%, 31.6% and27.7%, respectivelyChina andIndia & Asia PacificMarket Share(1) Up 20%in India & Asia Pacificvs. H1 2020Fiat Strada #1 SellingVehicle in BrazilMarket Share(1) Up 30 bpsto 11.9% in H1 2021 vs. prior yearSuccessful Launches ofJeep Compass andCitroën C5 Aircross in IndiaFiat Toro and Jeep CompassAmi Production IncreasingDeveloping NewChina Strategymid-cycle refreshes launched in Apr ‘21FiatToro(1)(2)PC LCVOn a Pro Forma basisAugust 3, 2021with expansion intocommercial businessCitroënAmi CargoCitroënC5 AircrossH1 2021 RESULTS 6
GLOBAL SUVPricing Power 2.8%, 0.1%and 4.4% vs. BenchmarkAchieved 30%LEV Mix in EU30(2)in Jun ‘21with 14.9% SUV segmentshare in H1 2021Record WranglerU.S. Retail Sales in H1 2021Compass and RenegadeBest Selling PHEVsRecord H1 Salesin Japan and Koreafor H1 2021 in Brazil, EU G7(1) and U.S.,respectivelywith 115k unitsJeepWrangler(1)(2)in Italy for H1 2021Market Leaderin South Americawith Wrangler and Renegadetop sales modelsJeepRenegadeBelgium, France, Germany, Italy, Netherlands, Spain and UKEU 27 (excluding Malta), Iceland, Norway, Switzerland and UKAugust 3, 2021H1 2021 RESULTS 7
AMERICAN BRANDSPacifica #3 SellingPHEV in U.S.Best Ever H1 Global andU.S. Retail Sales for BrandBest H1 Muscle CarMarket Share Ever(2),for H1 2021since becoming standalone brand in 2009with 49.3% U.S. retail segment sharePricing Power -1.6%vs. BenchmarkPricing Power -0.2%vs. BenchmarkPricing Power 6.3%vs. BenchmarkPacifica PHEV AchievedHighest U.S. SalesRecord H1 U.S. ATP(1)for Ram 1500Durango Achieved Best H1U.S. Retail Sales Since 2005,for H1 2021 in U.S.in H1 2021, with 10k unitsChryslerPacifica PHEVAugust 3, 2021(1)(2)Per J.D. Power and Associates Power Information Network (PIN) dataRecord since at least 1986for H1 2021 in U.S.for H1 2021 in U.S.at 49k/unitwith 31k units and 2021 Durango SRTHellcat awarded SUV of TexasRam 1500DodgeDurango SRT HellcatH1 2021 RESULTS 8
UPPER MAINSTREAMH1 2021 Market Share Up inEU30(1), Germany and UKPricing Power 0.6%vs. Benchmark 50% Sales Growthoutside of Europe vs. H1 2020#2 in EU30(1)with 7.1% market sharefor H1 2021More Than 40 CountriesWorldwide with Record H1Market Share since 2015Corsa #1 inGermany and UKPricing Power 2.3%vs. BenchmarkRegional Launches of NewLandtrek Pickup Continue,All-New 308 Launchy-o-y to 4.4%, 6.1% and 6.6%,respectivelyfor H1 2021 in Europe G7(2)with 21.3% and 18.9% segmentshare, respectively in H1 2021OpelAstra(1)(2)for H1 2021 in Europe G7(2)on track for Q4 2021Peugeot308EU 27 (excluding Malta), Iceland, Norway, Switzerland and UK (PC LCV share)Belgium, France, Germany, Italy, Netherlands, Spain and UKAugust 3, 2021H1 2021 RESULTS 9
COREH1 2021 Volumes andMarket Share Up in EU30(1)y-o-y with 363k units and 4.8%shareAll-Electric Ami CargoLaunched in FiveEuropean Markets#1 Electric City Carin 10 Countriesfor last mile delivery solutionsMarket Leader(3) in Brazil,Italy and Turkey; First TimeLeader in South AmericaPricing Power 2.4%vs. BenchmarkLaunch ofAll-New C5 X,Pricing Power 1.2%vs. BenchmarkBrand to Return toB-Segment in 2023for H1 2021 in Europe G7(2)flagship model,on track for H2 2021CitroënC5 X(1)(2)(3)EU 27 (excluding Malta), Iceland, Norway, Switzerland and UK (PC LCV share)Belgium, France, Germany, Italy, Netherlands, Spain and UKPC LCVAugust 3, 2021with 14.8% share in H1 2021 dueto success of Fiat Toro and Stradafor H1 2021 in Europe G7(2)30K sold to datewith first vehicle oncommon platformFiat500eH1 2021 RESULTS 10
COMMERCIAL VEHICLESMarket Leader in EU30(1)and South AmericaAccelerating Sharing ofElectrification TechnologyLarge e-Van Launched inin Europe in May 2021, Smalle-Van to Launch in H2 2021H1 Market Share Growth100% Electrified Van Rangein Europe by End of 2021Hydrogen Fuel CellMedium Vans Availableby End of 2021for H1 2021 with 34.4% and 33.4% share,respectivelyin South America, Enlarged Europeand Middle East & Africa, along withU.S. light and heavy-duty pickup shareRamChassis Cabbetween Europe and North AmericaCitroënË-BerlingoCitroënË-Jumpy(1) EU 27 (excluding Malta), Iceland, Norway, Switzerland and UKNote: Commercial vehicles market share refers to LCVs (all vehicles excluding passenger cars)August 3, 2021H1 2021 RESULTS 11
PREMIUM100% BEV in 2027100% Electrified in 2024,with 100% BEV Launches from 2026100% BEV Launches from 2024Pricing Power 0.7% and-0.6% vs. BenchmarkPricing Power -19.3%vs. BenchmarkPricing Power 2.4%vs. Benchmarkin basecamps of Enlarged Europe,North America and Chinafor H1 2021 in Europe G7(1) andNorth America, respectivelyResidual Value ManagementProcess LaunchedAlfa RomeoGiulia(1)for H1 2021 in Italy B-Segmentfor H1 2021 in Europe G7(1)Ypsilon #1 in Italy B-Segment4 Cars in Line-upwith Addition ofAll-New DS 4 and DS 9with 13.9% market share in H1 2021LanciaYpsilonDS 9Belgium, France, Germany, Italy, Netherlands, Spain and UKAugust 3, 2021H1 2021 RESULTS 12
LUXURYBack in the Blackin H1 2021with AOI(1) of 29MH1 2021 Market Share Upin All Key Marketsy-o-y, with China 50 bps to 2.2%(2)Successfully LaunchedLevante, Ghibli andQuattroportemid-cycle refreshesAll-New LevanteMild-HybridAll-New MC20deliveries to begin in Sept ‘21All-New Grecaleto be unveiled in Q4 2021deliveries started in JulyMaseratiLevante Mild-Hybrid(1)(2)MaseratiMC20On a Pro Forma BasisCalculated based on IHS data and Maserati competitive segmentAugust 3, 2021H1 2021 RESULTS 13
MOBILITY BUSINESS ACCELERATINGGrowth Sustained By Lease and Mobility BusinessGrowth Across All Business Lines End user revenues, with strong recovery of rental offers, up 42%vs. H1 2020 Short/medium-term rental, subscriptions and car-sharing revenues up 128% vs. H1 2020 B2B leasing and fleet management offers, up 51% y-o-y Long-term rental/leasing contracts originated, up 56% y-o-yNew Deployments to Accelerate GrowthSpearheading Electrification Transition Expanding mobility offers in U.S. Deploying eSolutions as a bundle, with wallbox, home green energy andpublic chargingElectric mobility innovation (unlimited mileage, pay-as-you-drive,subscriptions) Free charging at expanding proprietary network of 1,130 eParkinglocations at the 555 Leasys Mobility Stores across EuropeAugust 3, 2021H1 2021 RESULTS 14
21 PHEV AND BEV LAUNCHES OVER NEXT 2 YEARSStart of SaleH2 20212022H1 2023Alfa RomeoChryslerCitroenDS Automobiles20 electrified nameplates to belaunched in next 24 months:DodgeFiat/AbarthFiat Professional10 – BEV only option1 – BEV & PHEV options9 – PHEV only optionJeepLanciaMaseratiBattery Electric (BEV)Opel/VauxhallPlug-in Hybrid (PHEV)PeugeotRamAugust 3, 2021H1 2021 RESULTS 15
FINANCIAL RESULTSAugust 3, 2021H1 2021 RESULTS 16
BASIS OF PRESENTATION Completed merger of Peugeot S.A. (PSA) with and into Fiat Chrysler Automobiles N.V. (FCA) on Jan 16 ’21 (Merger) On Jan 17 ’21, combined company was renamed Stellantis N.V. (Stellantis or Group) PSA was determined to be the acquirer for accounting purposes, therefore, historical financial statements of Stellantisrepresent the continuing operations of PSA, which also reflect the loss of control and the classification of Faurecia S.E.(Faurecia) as a discontinued operation as of Jan 1 ’21 with the restatement of comparative periods Acquisition date of business combination was Jan 17 ’21, therefore, results of FCA for the period Jan 1 -16 ‘21 are excludedfrom H1 2021 results unless otherwise stated For purposes of this presentation, the captions noted below represent the following information:o H1 2021: excludes results of FCA for the period Jan 1 – 16 ’21o H1 2021 Pro Forma: results are presented as if Merger had occurred on Jan 1 ’20 and include results of FCA for the period Jan 1 – 16 ’21o H1 2020: represents results of the continuing operations of PSA only and are not directly comparable to previously reported results of PSAand reflect accounting policies and reporting classifications of the Groupo H1 2020 Pro Forma: results are presented as if Merger had occurred on Jan 1 ’20Note: The fair values assigned to the assets acquired and liabilities assumed are preliminary and will be finalized during the one-yearmeasurement period from the acquisition date, as provided for by IFRS 3. Refer to Appendix for additional information related to Pro Formaresults and reconciliations to applicable IFRS metrics.August 3, 2021H1 2021 RESULTS 17
RECORD 11.4% MARGIN DESPITE VOLUME CONSTRAINTSRESULTS FROM CONTINUING OPERATIONS Pro Forma Consolidated Shipments 44% primarily due to impact of H1 2020COVID-related temporary productionsuspensions, partially offset by H1 2021production losses of 20% of plannedproduction, or 700k units, due tounfilled semiconductor orders Pro Forma Adjusted OperatingIncome up 7.9B to 8.6B, and marginat 11.4%, with all segments profitable Pro Forma Industrial Free CashOutflows of 1.2B reflecting negativeworking capital impacts due to unfilledsemiconductor orders, offsetting positivenet synergiesH1 2021Pro FormaH1 2021H1 2020H1 2021 (1)H1 2020 (1)Pro Forma (1)Pro Forma (1)Pro FormaCombined Shipments (2) (000 units)3,1811,0323,2742,274 44%Consolidated Shipments (2) (000 units)3,0801,0103,1712,198 44%Net Revenues72,61019,61475,31051,668 46%Adjusted Operating Income *8,438n.a.8,622752 1,047%Adjusted Operating Income Margin *11.6%n.a.11.4%1.5% 990 bps million, except as otherwise statedH1 2021Pro FormaIndustrial Free Cash Flows *Industrial Net Financial Position *Industrial Available LiquidityH1 2021H1 2021 (1)H1 2020 (1)Pro Forma (1)650n.a.(1,163)11,506n.a.n.a.51,445n.a.n.a.(at Jun 30 ‘21)(at Jun 30 ‘21)H1 2020Aggregated(3)(13,573)17,826(at Dec 31 ‘20)57,278(at Dec 31 ‘20)(1) Refer to Basis of Presentation for additional information regarding amounts presented for the respective period and Appendix for additional information related to Pro Forma results and reconciliations to applicable IFRS metrics(2) Combined Shipments include shipments by Group’s consolidated subsidiaries and unconsolidated JVs, whereas Consolidated Shipments only include shipments by Group’s consolidated subsidiaries(3) Simple aggregation of FCA and PSA (excluding Faurecia) metrics and does not reflect purchase accounting adjustments required by IFRS. Refer to Appendix for additional information related to aggregated figures.* Refer to Appendix for definitions of supplemental financial measures and reconciliations to applicable IFRS metricsn.a. – Not applicableAugust 3, 2021vs.H1 2020vs.H1 2020Aggregatedn.m.- 35%(Jun vs. Dec)- 10%(Jun vs. Dec)H1 2021 RESULTS 18
NET PROFIT OF 5.9BRESULTS FROM CONTINUING OPERATIONSH1 2021 Pro Forma Net Revenues up 23.6B,or 46% Pro Forma Net Financial Expensesup 138B, primarily due to H1 2020including 216M remeasurement gainrelated to Dongfeng/PSA sharerepurchase commitment and one-offgains on unwinding of hedges in H1 2021 Pro Forma Tax Expense up 821M,primarily due to increase in NorthAmerica Profit before Taxes; Pro FormaEffective Tax Rate of 24%Pro FormaH1 2020vs.H1 2020H1 2021 (1)H1 2020 (1)Pro Forma (1)Pro Forma (1)Pro FormaNet Revenues72,61019,61475,31051,668 46%Operating Income7,3447167,51765n.m.217(160)22991 152%Profit/(Loss) before Taxes7,1278767,288(26)n.m.Tax Expense1,7291551,757936 88%Share of the Profit of Equity MethodInvestees40276405149 172%of which Results of Finance Companies329169338277 22%5,8007975,936(813)n.m. million, except as otherwise statedNet Financial Expenses/(Income)Net Profit/(Loss) (2)(1)(2)H1 2021Refer to Basis of Presentation for additional information regarding amounts presented for the respective period and Appendix for additional information related to Pro Forma results and reconciliations to applicable IFRS metricsRefer to Appendix for reconciliation of Net Profit/(Loss) to Pro Forma Adjusted Net Profit and Pro Forma Diluted Earnings Per Share (EPS) to Pro Forma Adjusted Diluted EPS, along with definitions of supplemental financial measures andreconciliationsAugust 3, 2021H1 2021 RESULTS 19
REVENUE GROWTH OF 46%NET REVENUES billion17.04.64.975.372.6(4.2)51.7H1 2020Pro Forma1.3(1)(2.7)Volume &Market MixVehicleNet Price& ContentVehicleLine MixFXTranslationOther 33% 9% 10%- 8% 3%H1 2021Pro Forma(1)ExcludePro FormaAdjustmentsH1 2021 (1) 46%(1)Refer to Basis of Presentation for additional information regarding amounts presented for the respective period and Appendix for additional information related to Pro Forma results and reconciliations toapplicable IFRS metricsFigures may not add due to roundingAugust 3, 2021H1 2021 RESULTS 20
RECORD DOUBLE-DIGIT MARGIN OF 11.4%ADJUSTED OPERATING INCOME * million% Adjusted Operating Income 98,438(184)11.6%11.4%7521.5%OperatingEnvironmentH1 2020Pro Forma (1)(1)*Industry &Market MixPerformance: 4,071 or 541%VehicleNet Price& ContentVehicleLine MixMarket Share& Market MixIndustrialSG&AR&DFX & OtherH1 2021Pro Forma (1)ExcludePro FormaAdjustmentsH1 2021 (1)Refer to Basis of Presentation for additional information regarding amounts presented for the respective period and Appendix for additional information related to Pro Forma results and reconciliations toapplicable IFRS metricsRefer to Appendix for definitions of supplemental financial measures and reconciliations to applicable IFRS metricsAugust 3, 2021H1 2021 RESULTS 21
RECORD 16.1% MARGINSHIPMENTSNET REVENUES(000 units)( billion)32.4697H1 '21North America( million)5,236873Pro Forma (1)ADJUSTED OPERATING INCOME & MARGIN22.8H1 '21H1 '20Pro Forma (1)Pro Forma (1) Up 25%, mainly due to COVID interruptedH1 2020 and discontinuation of Dodge GrandCaravan and Journey in H2 202016.1%H1 '208763.8%H1 '20H1 '21Pro Forma (1)Pro Forma (1) Up 42%, primarily due to increased volumes,favorable vehicle and market mix, as well asstrong net pricing, partially offset by unfavorableFX translation effectsPro Forma (1) Up 4.4B, primarily due to higher NetRevenues, partially offset by increased costs asbusiness normalized compared to COVIDinterrupted H1 2020ADJUSTED OPERATING INCOME million% Adjusted Operating Income 415)R&DFX & 1 2020Pro Forma (1)(1)Industry &Market MixPerformance: 2,294 or 262%VehicleNet Price& ContentVehicleLine MixMarket Share& Market MixIndustrialSG&AH1 2021Pro Forma (1)ExcludePro FormaAdjustmentsH1 2021 (1)Refer to Basis of Presentation for additional information regarding amounts presented for the respective period and Appendix for additional information related to Pro Forma results and reconciliations to applicable IFRS metricsAugust 3, 2021H1 2021 RESULTS 22
STRONG COMMERCIAL PERFORMANCESHIPMENTSNET REVENUES(000 units)( billion)ADJUSTED OPERATING INCOME & MARGIN( million)3264.94246.6%2.2186(63)(2.9)%H1 '21South AmericaPro Forma (1)H1 '21H1 '20Pro Forma (1)Pro Forma (1) Up 128%, primarily due to reduced COVIDinterruptions and success of all-new Fiat Strada,as well as mid-cycle refreshes of Fiat Toro andJeep CompassH1 '20H1 '21Pro Forma (1)H1 '20Pro Forma (1) Up 125%, primarily due to increased volumesand higher net pricing, partially offset bynegative FX translation effects, mainly fromBrazilian realPro Forma (1) Up 389M, primarily due to increased NetRevenues, partially offset by product costinflation and unfavorable FX translation andtransaction effectsADJUSTED OPERATING INCOME million% Adjusted Operating Income %ExcludePro FormaAdjustmentsH1 2021 (1)(63)(2.9)%H1 2020Pro Forma (1)(1)OperatingEnvironmentIndustry &Market MixPerformance: 215 or 341%VehicleNet Price& ContentVehicleLine MixMarket Share& Market MixIndustrialSG&AR&DFX & OtherH1 2021Pro Forma (1)Refer to Basis of Presentation for additional information regarding amounts presented for the respective period and Appendix for additional information related to Pro Forma results and reconciliations to applicable IFRS metricsAugust 3, 2021H1 2021 RESULTS 23
MEANINGFUL PROFITABILITY IMPROVEMENTSHIPMENTSNET REVENUES(000 units)( billion)1,664H1 '21Enlarged Europe2,82922.7H1 '21H1 '20Pro Forma (1)Pro Forma (1) Up 41%, primarily due to COVID interruptedH1 2020 and increased volumes of Peugeot2008, all-new Citroën C4, all-new Opel Mokkaand all-new Fiat 500e8.8%H1 '20Pro Forma (1)H1 2020Pro Forma (1)ADJUSTED OPERATING ndustry &Market MixPro Forma (1) Up 2.6B, primarily due to increased NetRevenues, purchasing and manufacturingefficiencies, as well as reduced compliancecosts, partially offset by increased labor andadvertising costs(81)2,829492,8789.1%8.8%1940.9%1940.9%H1 '20H1 '21Pro Forma (1) Up 41%, primarily due to higher volumes,improved vehicle mix, positive net pricing, andincreased parts and services, as well as used carbusiness million% Adjusted Operating Income Margin1,355( million)32.01,181Pro Forma (1)ADJUSTED OPERATING INCOME & MARGINPerformance: 1,280 or 660%VehicleNet Price& ContentVehicleLine MixMarket Share& Market MixIndustrialSG&AR&DFX & OtherH1 2021Pro Forma (1)ExcludePro FormaAdjustmentsH1 2021 (1)Refer to Basis of Presentation for additional information regarding amounts presented for the respective period and Appendix for additional information related to Pro Forma results and reconciliations to applicable IFRS metricsAugust 3, 2021H1 2021 RESULTS 24
STRONG PRICING DRIVES 9.7% MARGIN20062Middle East & Africa138H1 '21Pro Forma (1)Consolidated2.51303793H1 '21H1 '20Pro Forma (1)Pro Forma (1)(1)H1 '20H1 '21Pro Forma (1) Up 45%, primarily due to increased volumes,higher net pricing, including pricing actions forTurkish lira devaluation, and improved marketmix, partially offset by negative FX translationeffects, mainly from Turkish lira12452190H1 2020Industry &Market MixPro Forma (1) Up 474%, primarily due to improved net pricingand market mix, partially offset by negative FXeffects9247(18)(190)OperatingEnvironmentH1 '20Pro Forma (1)ADJUSTED OPERATING INCOME2352.4%432.4% million% Adjusted Operating Income MarginPro Forma (1)2471.89.7% Consolidated Shipments 48%, primarilydriven by COVID interrupted H1 2020 and highervolumes of Peugeot 208 and 2008, Opel Corsaand Jeep Wrangler43( million)( billion)(000 units)JVADJUSTED OPERATING INCOME & MARGINNET REVENUESCOMBINED SHIPMENTS925610.2%9.7%Performance: 114 or 265%VehicleNet Price& ContentVehicleLine MixMarket Share& Market MixIndustrialSG&AR&DFX & OtherH1 2021Pro Forma (1)ExcludePro FormaAdjustmentsH1 2021 (1)Refer to Basis of Presentation for additional information regarding amounts presented for the respective period and Appendix for additional information related to Pro Forma results and reconciliations to applicable IFRS metricsAugust 3, 2021H1 2021 RESULTS 25
IMPROVED PROFITABILITY FOR CHINA, INDIA & ASIA PACIFIC AND MASERATIChina and India & Asia PacificChina and India & Asia Pacific Improved results primarily drivenby higher volumes and netpricing, as well as favorablevehicle and market mix, partiallyoffset by increased advertisingcostsMaserati Improved results mainly due toincreased volumes and improvednet pricing, as well as favorablemarket mix, particularly in China,partially offset by higheradvertising costs to support midcycle refreshesH1 2021Pro Forma (1)H1 2020H1 2021Pro Forma (1)Pro Forma (1)H1 2020Pro Forma (1)RESULTS FROM CONTINUING OPERATIONS million, except as otherwise statedCombined Shipments (2) (000 units)10275 36%n.a.n.a.n.a.Consolidated Shipments (2) (000 units)6136 69%10.85.1 112%1,8831,200 57%885445 99%Adjusted Operating Income/(Loss) *20667 207%29(104) 128%Adjusted Operating Income Margin *10.9%5.6% 530 bps3.3%(23.4)% 2,670 bpsNet Revenues(1)Refer to Basis of Presentation for additional information regarding amounts presented for the respective period and Appendix for additional information related to Pro Forma results and reconciliations to applicableIFRS metrics(2) Combined Shipments include shipments by Group’s consolidated subsidiaries and unconsolidated JVs, whereas Consolidated Shipments only include shipments by Group’s consolidated subsidiaries* Refer to Appendix for definitions of supplemental financial measures and reconciliations to applicable IFRS metricsn.a. – Not applicableAugust 3, 2021H1 2021 RESULTS 26
NEGATIVE WORKING CAPITAL OFFSETTING POSITIVE NET SYNERGIESINDUSTRIAL FREE CASH FLOWS * ,150)(1,163)FinancialCharges& TaxesPro Forma (1)H1 2021Pro Forma (1)IndustrialAdjustedOperatingIncome(1)*August 3, 2021Depreciation& AmortizationCapex &CapitalizedR&DWorkingCapitalChanges inProvisions& OtherRestructuringH1 2021IndustrialFree CashFlowsExclude FCAJan 1 – 16 ‘21IndustrialFree CashFlows650H1 2021 (1)IndustrialFree CashFlowsRefer to Basis of Presentation for additional information regarding amounts presented for the respective period and Appendix for additional information related to Pro Forma results and reconciliations toapplicable IFRS metricsRefer to Appendix for definitions of supplemental financial measures and reconciliations to applicable IFRS metricsH1 2021 RESULTS 27
HISTORICALLY LOW STOCK LEVELS000 units Dealer inventories declined in all regions,except South America and India & AsiaPacific, primarily due to unfilledsemiconductor orders impactingproduction North America dealer inventorydown 204k units from Dec 31 ‘20 Enlarged Europe dealer inventory down114k units from Dec 31’ 20(1)1,234882110772Jun 30 '21273961Mar 31 '211,2561,320171232Group inventoryIndependent dealers inventory1,0851,088Dec 31 '20Jun 30 '20Aggregated (1)Aggregated (1)Represents simple aggregation of FCA and PSA inventory units as of period endAugust 3, 2021H1 2021 RESULTS 28
2021 INDUSTRY OUTLOOK AND GUIDANCENorth America 10%Outlook for regionincreased from 8%y-o-y, primarily due toimprovements in U.S.FY 2021 GUIDANCE – RAISEDAdjusted Operating Income Margin* 10%South AmericaEnlarged Europe 20% 10%Outlook for regionunchangedOutlook for regionunchangedMiddle East & AfricaIndia & Asia PacificChina 15% 10% 5%Outlook for regionunchangedOutlook for regionunchangedOutlook for regionunchangedAssumes no further deterioration of semiconductor supplyand no further significant lockdowns in Europe and U.S.*Refer to Appendix for definitions of supplemental financial measures and reconciliations to applicable IFRS metrics. Guidance includes impacts from purchase accounting and changes in accounting policiesas required by IFRS in connection with the Merger. Guidance refers to Pro Forma results, which include results of FCA for the period Jan 1 - 16 '21.Source: IHS Global Insight, Wards, China Passenger Car Association and Group estimatesAugust 3, 2021H1 2021 RESULTS 29
OUR PURPOSE AND VALUES SET THE INSPIRATIONPOWERED BY OUR DIVERSITY, WE LEAD THE WAY THE WORLD MOVESWE ARE CUSTOMER CENTRICWE WIN TOGETHERWE ARE AGILE AND INNOVATIVEWE CARE FOR THE FUTUREUpcoming Event: Software Day Planned for Fall 2021August 3, 2021H1 2021 RESULTS 30
APPENDIXAugust 3, 2021H1 2021 RESULTS 31
KEY COMMERCIAL METRICSCOMBINED SALES000 units3,5912,6891,778H1 20211,077H1 2020412TotalMA
Fiat Toro and Jeep Compass mid-cycle refreshes launched in Apr '21 Ami Production Increasing with expansion into commercial business Developing New China Strategy Fiat Strada #1 Selling Vehicle in Brazil Market Share(1) Up 30 bps to 11.9% in H1 2021 vs. prior year Successful Launches of Jeep Compass and Citroën C5 Aircross in India Fiat Toro .