Transcription
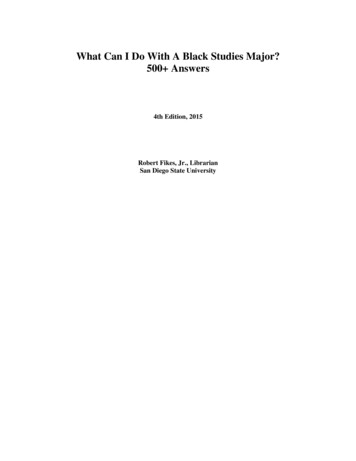
Field Studies of Dependence of Air Infiltration onOutside Temperature and Wind *NICHOLAS MALIKGamze-KorobkinCaloger, 205 W. Wacker Drive, Chicago, 11. 60606 (U.S.A.)(Received December 1 5 , 1 9 7 7 )The air infiltration rate, measured in twosimilar townhouses, is parametrized in termsof wind speed, wind direction, indoornutdoor temperature difference (DT), averagerate o f furnace firing, and fraction o f timethat doors are open. A n increase of 0.1 exchange per hour is associated with each o f thefollowing: ( 1 ) an increase in DT by 12 O F( 7 "C)at low wind speeds, ( 2 ) an increase innormally incident wind by 2 mph ( 3 kmlh) atlow DT; ( 3 ) ten minutes per hour o f increasedfront-door opening; ( 4 ) the basement dooropen instead o f closed. The wind-temperatureinteraction is non-linear, which confounds the*This article is based on an MSE Thesis, "Air infiltration in homes," accepted by the Aerospace andMechanical Sciences Department, Princeton University in September 1977.EQUATIONS(I)/-A?//,modeling. The DT effect is nearly half due toincreased furnace firing, which induces anair flow three times larger than that requiredfor stoichiometric combustion.IMPACT OF INFILTRATION ON GAS CONSUMPTIONSimultaneous measurements of rate of airinfiltration and rate of energy consumptionfor space heating have hardly ever been available in field studies of energy use in homes.Accordingly, Fig. 1 should be of considerableinterest. It shows direct evidence that gas consumption is greater, for the same indoor-outdoor temperature difference, when the airinfiltration rate is greater.Figure 1 gives quantitative informationabout the relative significance of heat lossesOF STRAIGHT LINES:G: - 8 . 2 O 72AT(21 AND ( 3 ))ATINSIDE -OUTSIDETEMPERATUREDIFFERENCE I A T 1Fig. 1. Furnace consumption versus inside-outside temperature diff,erence with air infiltration measured simultaneously. Night-time average values.
due t o air infiltration and due to conductance through the shell. Each data point displayed in Fig. 1 corresponds t o a differentnight of data taken in the same Twin Riverstownhouse. For each of 26 nights, measurements were made of the rate of- gas combustion (G), the temperature difference betweenindoors (downstairs hall) and outdoors (DT),and the air infiltration rate (AI), and averagesfor each night were computed. When a linearmodel omitting the air infiltration rate wasfitted to the data, G -al pl DT, the bestfit,1.0, and 1.5 exchanges per hour. At the"handbook" constant exchange rate for townhouses, 0.75 exchanges per hour, R is 32%,in general agreement with the rule of thumbthat air infiltration typically accounts for onethird of all heat losses in conventional residential housing.The following sections of this article present the results of an attempt t o model theair infiltration rate, as a function of weatherand house parameters.DETERMINANTS OF AIR INFILTRATIONSCOPE OF AN EXPERIMENThad an R' of only 0.78 (essentially, left 22%of the variation in G unexplained). Here, Gis in W, and D T is in "C. The standard error ofthe estimate of G for this model is 2300 W.However, when a linear model including theair infiltration rate is fitted t o the data, G -12 Sz DT y2(AI)(DT),the best fit, (250 20) (AI) (DT)(2)had an R' of 0.96 and a standard error ofonly 950 W. Again, G is in W (althoughoriginally measured as ft3 of gas consumedper hour, the gas having an energy content of1025 t u / f t o r, 38 MJ/m3), D T is in "C,and A I is in exchanges of air per hour. Thestraight lines corresponding t o eqn. ( 2 ) withAI 0.5 h-' and 1.5 h-' are shown in Fig. 1 ,as well as the straight line corresponding t oeqn. (1).The first term in eqns. ( 1 ) and (2) containsthe heating by appliances and people, a portion of the heat loss t o sinks, like the ground,that are warmer than outside air, and a contribution from heat stored in the structureduring the day; it has the physically correctnegative sign. The second and third termsrepresent conductive heat losses and lossesdue t o air infiltration, respectively. Accordingly, the ratio of air infiltration heat loss t ototal heat loss, may be written:250 A IR 400 250AIwhere A I is in exchanges per hour. For thistownhouse, therefore, air infiltration contributes 24, 38, and 48% of the heat loss whenthe air infiltration rate is, respectively, 0.5,-Air infiltration rates were measured overseveral winter months in two identical TwinRivers townhouses, with weather variablesmonitored at a nearby weather station. Thegeometry of the experiment is found in Fig.2. Both townhouses occupy interior positionsin the row and hence only have two wallsexposed t o the outside. The two units areoriented nearly at right angles t o one another:the axis from the front t o the back of the firsthouse is oriented at 15" relative to north. The0 O A ooai0 INDICATESFRONT DOORFig. 2. Plan of Twin Rivers, showing location ofexperimental houses and weather station.
city and temperature difference, but- complexinterference effects may be anticipated fromthese two sources of pressure difference overthe shell of the house [ 4 ] . One should expect,for these townhouses with only two exposedorientations, that wind incident on the housenormal to the front and back door should bemore effective in creating air infiltration thanwind incident from a direction along thebuilding axis. One should expect air infiltration to be enhanced when the furnace isrunning, because the furnace combustionreduces the pressure in the basement, andcombustion air must enter the basementeither directly or by way of the living area.The air flow up the flue when the furnace isrunning is several times that required for combustion, in order to entrain the combustionproducts, and this flow too must be matchedby a corresponding flow into the house fromoutdoors.Of course, one expects the air infiltrationrate t o be larger, the longer the front door isopen, assuming it is open equally wide on alloccasions, a quantity not measured. We areactually measuring the air infiltration rate forthe living area, a volume that excludes thebasement, but there is air flow between livingarea and basement not only through the basement door but also through leaks in basementducts and through other passages [ 5 ] . TheResults of regression analyses, when particularlargest effect of the basement door beinglinear representations of the air infiltrationopen, we would expect, is to increase therate were tested, are presented in the next"stackeffect" pattern of flow, where coldtwo sections. We use SI units in these expresair enters the basement and leaves the housesions; Table 1 should facilitate conversion tofrom the living area. There should also beAmerican units.additional air infiltration in the living areaOn physical grounds, one should expect thewhen the furnace is running, if the basementair infiltration rate to increase with wind velodoor is open. Although these effects suggestmodels with interaction terms (DT-B and G*B),we have tested more elementary modelsTABLE 1linearin B, expecting still t o see increasedConversion of units for variables in this analysisair infiltration with the basement door openlonger.Variable Units in this articleConversion toAll of the effects expected on physicalAmerican unitsgrounds have been found clearly in the data.AIexchanges of air inWe have reduced a large number of data sets,"living area" per houreach generally associated with a one-week1 "C 1 . 8 "FDT"C"run" in one house. Only a few runs are dis1 km/h 0.622 mphVkm/h0degreescussed here, a larger number elsewhere [ 2 ] .1 kW 3.33 ft3/hGkWWe divide the discussion below, somewhat(gas at 1025 t u / f t ) arbitrarily, according to whether the windFminutes per hourspeed is low [less than 6 mph ( 1 0 km/h)] orBminutes per hourhigh [more than 6 mph ( 1 0 km/h)] .least shelter from other buildings is found atthe back of the first house, and (unfortunately for the occupants) this is the direction(westerly) of the prevailing as well as thehighest winds. The terrain is flat.The air infiltration rate is calculated fromthe rate of decrease of concentration of atracer gas (sulfur hexafluoride, SF,) in theliving area. Concentrations are typically about30 parts per billion at time of injection, andreinjection, in this experiment, occurred everythree hours. Experimental details are reportedelsewhere [ I - 31.We have investigated six independentvariables as possible determinants of the airinfiltration rate. They are :D T temperaturedifference betweenindoors (hallway) and outdoors(weather station),V wind velocity (hourly average atweather station),8 wind direction (instantaneous hourlyreading at weather station),G rate of furnace gas consumption(hourly average),F front door opening (minutes openduring the hour),B basement door opening (minutesopen during the hour); basementdoor opens into the living area.I
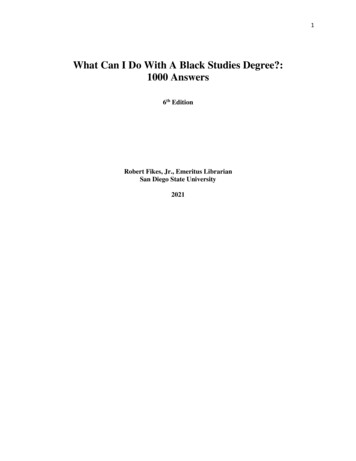
WIND SPEED 6rnph(lOkm/h)FRONT DOOR 2rnin/hrFEB IFEB 20SEPTIFig. 3. Air infiltration rate uersus inside-outside temperature difference - cold and mild weather, house 1.PARAMETRIZATION O F AIRRATE AT LOW WIND SPEEDSINFILTRATIONRegression analysisHouse 1When we confine the analysis t o cases withwind speeds not exceeding 6 mph (10 km/h),here call "low", the effects of wind areminimized. Figure 3 shows a scatter plot ofthe air infiltration rate, AI, against theindoor-outdoor temperature difference, atlow wind speeds and with the front dooropening restricted t o less than two minutesper hour. Each data point is one-hour's data.Six data sets are shbwn, all from the samehouse (house 1) but in several differentmonths. Three data sets (FEB1, FEBZ, andAPR1) follow one trend, the other threefollow another.In both cases, A I increases approximatelylinearly with DT, with roughly the sameslope, but one pattern is displaced above theother. The house acts as if it had two different "porosities", the house being tighterin one case relative to the other. The higherpattern corresponds t o data taken duringgenerally milder weather. It may be that inmild weather, windows and doors are openedrather frequently and are closed carelessly,whereas in winter, people make sure theirwindows and doors are closed tight.The mild-weather data sets (APRZ, MAY,and SEPT) willnot be studied in this article*.The results of a multiple regression analysisapplied t o an aggregate of the three coldweather data sets (with front door openingunrestricted) is presented in Table 2. Whenonly the variable DT has entered the analysis,the equation for the air infiltration rate isA1 0.186 (0.0148?0.0018) DT(3)At this stage, four of the five other testedvariables are statistically significant. All four*A confounding variable for t w o of these data sets(APR2 and MAY) is the presence of a tree barrier o nthe windward side of the house [6, 71. We hadexpected the barrier t o reduce air infiltration, but t h eporosity effect appears t o have confounded t h eanalysis. Careful data reduction emphasizing angledependence at high wind speeds shows an effect oft h e barrier: 0.2 exchange per hour reduction in airinfiltration rate for winds which strike the barrier[21.
TABLE 2Regression statistics for house 1 at low wind speeds ( 2 4 2 cases: files FEB1, FEB2, APR1)VariableMeanA10.540 exch/h24.1 "C (43.4 OF)6.03 km/h (3.75 mph)3.89 km/h ( 2 . 4 2 mph)6.9 kW (23.0 ft3/h)0 . 5 min/h7 . 4 min/hDTVV 1 cos (0- 280") 1GFB-Variable enteredDTGBFV I cos (0- 280") IStandard deviation0.098 exch./h3.2 "C (5.8 OF)2.03 km/h (1.26 mph)2.36 km/h (1.47 mph)3.5 kW (11.5 ft3/h)2.1 min/h1 6 . 8 minth,-Step-wise statisticsPartial FR Standarderror of A IOverall 00.0750.0730.0717363594944survive the significance tests of the multipleregression analysis, which yields :AI 0.193 (0.0095 0.0020) DT (0.0107 0.0020) G (0.0016 k0.0003) B (0.0088 0.0022) F (0.0074 k 0.0020) I v cos (e - 280") I(4)A term linear in V, but angle-independent, isnot statistically significant, once the angledependent velocity is entered in the regression.Consider the coefficients of the variousterms in the above equation. The coefficientof DT is indicative of the magnitude of thestack effect at low wind speeds. At the meanvalue of DT (43 "F or 24 "C) the contributionof the stack effect is approximately 0.2 exchanges per hour, 40% of the mean value ofthe air exchange rate.The coefficient of G is a measure of the variation of AI with the rate of gas consumption. It indicates that continuous fumaceoperation (maximum consumption: 75 ft3 or2.1 m3 of natural gas per hour) results in anadditional air exchange rate of approximately0.24 t 0.05 air changes per hour. WhenSocolow carried out a similar analysis usingdata for air infiltration rate and gas consumption taken at 5-minute intervals over a singlenight, he found that 0.19 air changes perhour were associated with continuous furnacefiring [ 8 ] . The two results, therefore, are inagreement. Two reasons for an effect of gasconsumption on air infiltration are: (1) airis needed for combustion, and (2) air is entrained with exhaust gases going up the flue.Stoichiometric air required for combustionof methane amounts t o 800 ft3/h (23 m3/h)when the fumace fires continuously. Thevolume of living space is approximately10,000 ft3 (300 m3), This implies that thesupply of stoichiometric air is equivalent t o0.08 air exchanges per hour. Comparing thist o the values for continuous firing justpresented, we see that about one-third of theinduced air due t o continuous fumace operation is due to stoichiometric air. The othertwo-thirds can be accounted for by theentrained air.The coefficients of B and F are definitelysignificant. There will be an increase in AI of0.10 air changes per hour if the basementdoor is kept open the whole hour, and anadditional increase which extrapolates t o 0.53air changes per hour if the front door is keptopen the whole hour. Put another way, keeping the basement door open for 60 minutes islike keeping the front door open for 11 minutes (the basement door opens into the interiorhallway). In another investigation, we foundevidence that the effect of the front dooropening is significantly enhanced with simul-
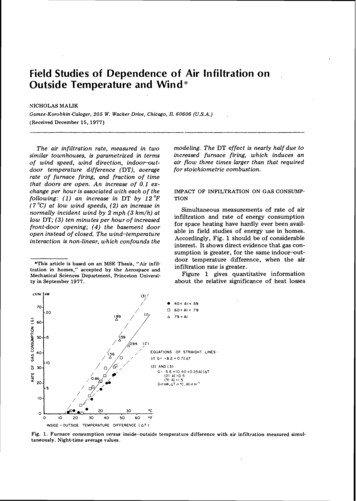
TABLE 3Regression statistics for house 2 at low wind speeds (431 cases: files OCT, NOV1,NOV2, DEC)VariableMeanStandard deviationAIVV I cos (6 -15") 10.48 euch./h17.5 "C (31.5 OF)5.23 km/h (3.25 mph)3.73 km/h (2.32 mph)0.095 exch./h5.1 "C (9.2 OF)2.41 km/h (1.50 mph)2.36 km/h (1.47 mph)Variable enteredStep-wise statisticsDTPartialFRStandarderror of A ITable 3 shows results of a regression analysisat low wind speeds, when the data sets OCT,NOV1, NOV2, and DEC are aggregated. Inthis case AI can be represented as a functionof DT by the following equation:AI 0.26 (0.0128 0.0007) DT(5)Here, as in eqn. (3), the coefficient of DT represents a combination of the stack effect andthe furnace effects. The coefficients of DT inthe two equations are consistent with oneanother. This might have been expected, sinceboth houses are of the same type.When the effect of wind velocity is explored, the data are better explained by a termlinear in I V cos (6 - 1 5 4 1 , the perpendicularcomponent of the velocity, rather than by aterm linear in V. The same preference wasobserved in house 1. The resulting equationis :AI 0.22 (0.0128 0.0005) DT (0.0111 0.0013) V I cos (6 - 1 5 4 1(6)The coefficient of the V - dependent term isslightly larger than in eqn. (4) for house 1,but t o one standard deviation, the coefficientsnearly overlap.OFRATE AT HIGH WIND SPEEDSINFILTRATIONWe confine our attention t o one data set(APRl), obtained in house 1 over a period ofsix days (April l to 6, 1975), during which,for three days, there was an exceptionallyviolent storm. The hourly average wind speedvaries between 3.5 mph (5.6 km/h) and 29.9Overall Frnph (48.1 km/h) and the wind directionspans the whole circle. We divide our data setinto three subsets, according t o whether thei n d o o r o u t d o o r temperature difference, DT,lies between 40 "F (22 "C) and 50 "F (28 "C);between 30 "F (17 "C) and 40 "F (22 "C); orbetween 18 "F (10 "C) and 30 "F (17 "C). Byworking within narrow bands of DT, weminimize the problems of complex interaction effects between wind and DT.22 "C (40 OF) ( DT 5 28 "C (50 OF)There are 6 3 data points in this subset, andthey are shown against wind velocity in Fig,5, for several ranges of wind direction. Eventhough in this particular data set there areno easterly winds, Fig. 5 shows clear evidenceof the effect of wind direction. For example,at 1 2 rnph (19 kmlh) the air infiltration rateis nearly doubled when the wind comes fromthe rear of the house (data points shown assquares) instead of along a direction parallelt o the townhouse row (data points shown ascircles).Ignoring wind direction for a moment, weattempt a fit t o the data linear in wind velocit y . We obtain:The R is 0.69 and the standard error of estimate is 0.22 exchanges per hour. Using a stepwise regression, we find that a term linear inthe gas consumption enters next in the equation, giving:AI (0.027 0.003) V (0.030 ? 0.007) G 0.15(8)
Fig. 5 . Air infiltration rate versus wind velocity, very cold weather.The R 2 at this step assumes the value of 0.78and the standard error of estimate is reducedto 0.19 exchanges per hour. We observe thatas G is entered in the equation, the coefficient of V is significantly reduced. Some ofthe wind effect appears t o be due to greatergas consumption in higher winds.In order to study the influence of winddirection, we plot the residuals (Fig. 6) defined by the difference between the measuredvalue of A I and the value obtained from eqn.(8). Generally speaking, the residuals are positive in the neighborhood of the perpendicularto the row axis (280") and are negative in theFig. 6 . Residuals of a linear fit t o the data in Fig. 5 , plotted against wind direction.
than DT are largely overlapping, so that anindependent parametrization of this data setforms a check on the previous equations. Thepresent data set contains data for easterlywinds (the set of points at the lower left inFig. 7) that will be excluded from theanalysis. Figure 7 shows angledependenteffects (higher air exchange rates for normallyincident wind), for example near 1 8 mph(29 krn/h), that are quite similar to those wehave observed in Fig. 5.When we attempt a one-parameter fit tothese data, linear in wind velocity, we obtain:neighborhood of the parallel to the row axis.This leads us to approximate the dependenceon 6 by a sinusoidal function, V cos (6 - 4).The best fit to the data is found for 4 300".The fit is significantly better than for' 4 280 , the direction of the perpendicular tothe house row axis. (On physical grounds,.aterm with 4 280" was expected to be themore statistically significant. The fact that aterm with Q 300" has a better fit can eitherbe due to an instrument error, or to thecomplexity of the wind effect.) We obtain:AI (--0.002 0.004) V (0.30 0.003)GAI (0.032 r 0.004) V 0.11 (0.027 - 0.003) V cos (6 - 300")The R 2 is 0.65 and the standard error of estimate is 0.24 exchanges per hour. As thevariable G is introduced in the equation, weobtain:The R' increases to 0.91 and the standarderror of estimate is reduced to 0.12 exchangesper hour. Comparing eqn. (9) with eqn. (8),we observe that the coefficient of an angleindependent V term becomes statistically insignificant, once an angledependent V term isincluded.AI (0.026 0.004) V (0.027 r0.010) G 0.06 (11)The R 2 becomes equal t o 0.71 and thestandard error of estimate is reduced to 0.19exchanges per hour. The coefficients in eqn.(11) are essentially the same as those ineqn. (8).When a term incorporating wind directionis included, V cos (4 - 6), the anomalous preference for (O 300" rather than 4 280" isagain observed.17 "C ( 3 0 "F) IDT 22 "C ( 4 0 "F)As seen in Fig. 7, there are not as manydata points at high wind in this data set, compared to the previous data set shown in Fig.5. However, the ranges of the variables other2.4-2.0-c'FILE: APR I1 1 7 X 32O9 8s 370q 27O0 85 320'A 2200 05 270 0 170 8 S 220'a OTHER (EASTERLY)'2209270'on\q0V1Wo y @d Xon5 1.6 -0I::!z1.2-8-., ,.*.A A',&A A ::01020I0n030II4812401II(10)Ih / hIIII16202428vFig. 7 . Air infiltration rate versus wind velocity, intermediate weather.rnph
2.42.0320 8g 370 2700 84 32000 220 8127W0 170 * 8 S 220 X021.6* OTHER (EASTERLY)\fnW0zarU1.2XW.a.e.440168202428rnphFig. 8. Air infiltration rate versus wind velocity, mild weather.AI (0.010 0.003) V (0.030 0.007) GAnalogous t o eqn. (9), we obtain:A I (-0.007 0.004) V (0.007 0.007) G (0.032 2 0.004) 0.44v cos (e - 300") (0.009 0.002) 0.14(12)The R 2 increases t o 0.90 and the standarderror reduces t o 0.13 exchanges per hour.Again, as in eqn. (9), the angle-independentvelocity term has become nearly insignificant.The term linear in the rate of gas consumption in eqns. (8), (9) and (11) [but oddly notin eqn. (12)] is more than twice as large aswhat we found for low wind speeds [see eqn.(4) above]. It is indeed reasonable that theair infiltration associated with a given amountof furnace firing should be larger in windyweather, as wind will increase the entrainmentof house air with combustion products ontheir way out of the flue.10 C(18"F) I: D T 17"C(30"F)This mild-weather data set, shown in Fig.8, is quite small but it shows evidence [forexample, near 1 8 mph ( 29 km/h)] thatdirectional effects of incident wind are lesspronounced than in colder weather, anunexpected result that we explore furtherbelow. The best fit t o this data set analogousto eqns. (9) and (12) above is:v cos (e - 280")(13)Here, there are 41 data points and the R is0.95. The standard error of estimate is equalt o 0.09 exchanges per hour. The angle-independent wind velocity has become moreimportant, relative t o the angledependentwind velocity. The appearance of the "true"normal t o the townhouse, 280 , instead ofthe value 300" in eqns. (9) and (12), emergedfrom iterations of the parametrization t oincrease the goodness of fit, and it remainsunexplained. The constant term in the equation is significantly smaller here.Wind-temperature interactionThe lack of consistency between eqn. (13)on the one hand and eqns. (9) and (12) onthe other suggests the existence of a complexinteraction between wind and temperature,whose potential existence had been revealedin a theoretical analysis [4]. To see the natureof this interaction for this particular townhouse, we construct Fig. 9, in which we replotthe data previously shown in Figs. 5 , 7 and 8,this time against DT, with wind velocity restricted t o between 1 0 mph (16 km/h) and 20mph (32 km/h) and with easterly winds
FILE: APR I16km/h(IOmph) W32km/h(20mph)X 320 8 370'0 270 8 5 320 A 220 8 270 0 17Oo @522O00&s\mW0zarUXWa102030AT40'FFig. 9 . Air infiltration rate versus inside-outside temperature difference for high winds.excluded. We see clearly that the influence ofwind direction, 8, on the air infiltration rateis more pronounced the larger the value of theindooroutdoor temperature difference, DT. This suggests that we try t o model thewind-temperature interaction using somenon-linear parametrization. When we try aterm, D T - V cos (8 - 300 ), which evidentlyenhances wind effects in colder weather, wefind that this captures all of the statisticallysignificant velocity dependence. In aparametrization that also includes a non-linearbasementdoor term and a furnace term, weobtain :A1 (0.0011 0.0001) D T - V 1 cos (8-300") 1 (0.023 0.003) G (0.00014 0.00005) B-DT 0.30(14)There are 1 4 4 data points in this regression,all of the data in data set APRl with westerlywind direction and with DT unrestricted. TheR is 0.93 and the standard error of estimateis 0.12 exchanges per hour.Tests of models beyond their original domainWe have tested the non-linear model,eqn. (14), in several ways. We find that itcomes close t o predicting the magnitude ofthe air infiltration rate observed during periods with easterly winds of 6 mph (10 kmlh)t o 1 0 mph (16 km/h), with the significantexception that the measurements reveal noneof the directional dependence predicted byeqn. (14). (The measured rate is essentiallyconstant a t 0.4 exchanges per hour.) This maybe evidence of the sheltering of this townhouse (house 1 ) by the nearby rows of housest o the east (see Fig. 2).The non-linear model, eqn. (14), is adequate t o predict the air exchange rate for "high"westerly winds in an earlier data set (FEB2).On the other hand, it evidently does not haveany smooth connection to the models, eqns.( 3 ) - (6), developed for "low" winds in theprevious section. Given that the form ofwind-temperature interaction chosen in eqn.(14) vanishes at zero wind velocity, it is notsurprising that eqn. (14) seriously underpredicts the air infiltration rate observed atlow wind speed.House 2.Finally, we have examined the high-windorientation differs bydata for house 2,approximately 90' from that of house 1 (seeFig. 2). Our data sets contain high-wind dataonly for southerly winds (the sheltered direction for house 2), none for northerly winds(the exposed direction). Perhaps for thisreason, an essentially opposite form of windtemperature interaction is present in house-2
data sets: the influence of wind speed issmaller the higher the value of DT. Thereappears to be a destructive instead of a constructive interaction between pressure difference due to buoyancy (DT) and pressuredifference due to wind (V). As Sinden hasshown [ 4 ] , both kinds of interactions are possible on physical grounds.A destructive wind-temperature interactionleacis to significant energy savings. It is, therefore, well worth pursuing these non-lineareffects in the field and in laboratory experiments, t o begin to understand their physicalorigins. At present, we have only the first glimmerings of ideas about how they might arise.The parametrizations presented in thisarticle give glimpses of a set of physical principles at work in determining air exchange ratesin a house, that so far are poorly understood.Advice cannot now be given to residents concerning which interior doors t o keep closed toreduce air infiltration rates, nor concerningwhen to open windows so that air infiltrationrates do not become uncomfortably small inmild weather with low winds, once houses aretightened for cold weather and high winds.Extensive field experience and laboratorymodeling would appear t o have high priority,t o enhance the effectiveness of the world'sexpanding programs in energy conservation inhousing.CONCLUSIONThe air infiltration rate has been measuredin two similar townhouses, using a methodbased on the detection of a tracer gas (SFs).The method of measurement yielded reproducible rates of air infiltration within 0.1 airexchanges per hour in any single one-weekrun, once outside temperature, wind speed,and wind direction were coiltrolled for. Atlow wind speeds, air infiltration rates werefound to increase linearly with decreasingoutside temperature, with a slope of approximately 0.008 air exchanges/hour/"F (0.014exchanges/hour/"C). At high wind speeds,non-linear wind-temperatureinteractionswere observed, which had different forms inthe two houses. Nonetheless, clear evidencefor the effects of wind on air infiltration ratewas obtained, including evidence that theeffect of wind is enhanced when the winddirection is perpendicular to the house rowaxis. In linear regression models, coefficientsof either wind velocity or the perpendicularcomponent of wind velocity ranged from 0.03to 0.06 air exchanges/hour per mile of windvelocity (0.02 t o 0.04 exchanges/hour per km/hour of wind velocity).Additional physical effects could be discerned in multiple linear regression analyses,including increased air infiltration rates forfixed outside temperature and wind when (a)furnace on-time is increased, (b) front dooropen-time is increased, and (c) basement dooropen-time is increased. The basement door isan interior door, and result (c) calls attentionto the significance of separate zones with distinct air infiltration rates within the house.ACKNOWLEDGEMENTSThe author gratefully acknowledges the assistanceof Roy C o s b y ,Gautam Dutt, Ken Gadsby, DavidHarrje, George Mattingly, Andrew Persily, FrankSinden, and Robert Socolow. This work has been supported in part by t h e U.S. Department of Energy,Contract No. EC-774-02-4288.REFERENCES1 D. Harrje, C. Hunt, S. Treado and N. Malik,Automated instrumentation for building air infiltration measurements, Report No. 13, Center forEnvironmental Studies, Princeton University,1975.2 N. Malik, Air infiltration in homes. ] W E Thesis,Princeton University, 1977.3 D. T. Harrje and R. A. Grot, Instrumentationfor monitoring energy usage in buildings a t TwinRivers, Energy and Buildings, 1 (1977178) 293.4 F . Sinden, Wind, temperature and natural ventilation - theoretical considerations, Energy andBuildings, 1 (1977178) 275.5 J. Beyea, G. Dutt and T . Woteki, Critical significance o f attics and basements in the energy balanceo f Twin Rivers townhouses, Energy and Buildings,1 (1977178) 261.6 G. Mattingly and E. F. Peters, Wind and trees -airinfiltration effects on energy in housing, J. Ind.Aerodynamics, 2 (1977) 1 19.7 R. Socolow, The Twin Rivers program o n energyconservation in housing: highlights and conclusions, Energy and Buildings, 1 (1977178) 207.8 R. H. Socolow, Energy utilization in a plannedcommunity in the United States, in R. G.Courtney, (ed.), Energy Conservation in the BuiltEnvironment, Proc. CIB S y m p . BRE, Watford,April I 9 76, Construction Press, Lancaster, 1976,pp. 447 - 457.9 J. E. Hill and T . Kusuda, Dynamical characteristicsof air infiltration, A S H R A E Trans., 81 (Part 1 )(1975).-
Night-time average values. due to air infiltration and due to conduc- tance through the shell. Each data point dis- . Of course, one expects the air infiltration rate to be larger, the longer the front door is open, assuming it is open equally wide on all occasions, a quantity not measured. We are