Transcription
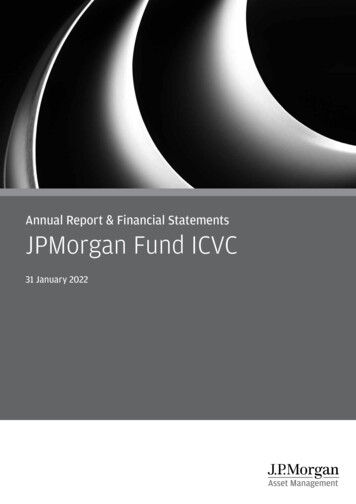
Morningstar Global Fund Report The Morningstar Global Fund Reportis a seven-page report that offersthe most relevant data and analysissurrounding a fund. Central to thisreport is the Morningstar AnalystRating, which evaluates funds onfive key pillars, considering bothnumeric as well as qualitativefactors. This approach puts onlypartial weight on past performanceand backward-looking risk measuresand does not dismiss funds thathave underperformed or have limitedtrack records. It will also be moreresponsive to significant changes ata fund or parent organization.
Page 1 of 7Morningstar Global Fund Report Print Date: June 18, 2012 FINRA Members: For internal use or client reporting purposes only.Mutual Fund AABCDXA Morningstar Analyst Rating„Morningstar CategoryCategory IndexTotal AssetsInception DateDomicileCurrencyUS OE Large BlendRussell 1000 TR USD11,838Mil USD07/22/96USAUSDStyle star RatingQQPerformance re5K* * & & & & ) & ( ) *32-22.86-0.61-1.2177.1%Europe &Africa12.7%Asia 7-16.74334.96 %1.11-0.394 4 4 4 7 7 4 4 4 4 410.2%Quartile Rank in CategoryPercentile Rank in CategoryTotal Return USD /- Category /- IndexProcessEquity Style 4022344415454013 %49 %38 %x ��%Price Expense RatioOccasional rocky stretches,but strong long-term results.Analyst ViewMorningstar Analyst, CFASenior Mutual Fund AnalystMorningstar Analyst Rating„B Morningstar Pillars ¶¶Process Page 2-3Performance Page 4People Page 5Parent Page 6Price Page 7PositivePositivePositiveNeutralNeutralMorningstar Analyst RatingMorningstar evaluates mutual funds based on five key pillars, which itsanalysts believe lead to funds that are more likely to outperform over thelong term on a risk-adjusted basis.Analyst Rating Spectrum„ CashOtherSuper Sector07/9612/98Total Named ManagersŒMorningstar RatingAsset AllocationStockBondPeopleFund ManagerFund ComangaerRet%4.152.523.73QQQQQQQQQQQQQQQCore HighGrowth GrowthRegional ExposureAmericasValueUSD15,27312,96114,639Full Manager ChangePartial Manager ChangeBear Market10KSmallDeepValueGrowth of 10,000Annualized USDFundCategoryIndex‰ÁMay 21, 2012 Mutual Fund has ebbed andflowed, but it can reward the patient.After landing in the category'sbasement in 2011, this fund made up someground in early 2012. Financial picks that hurt lastyear recovered, fueling the fund's 16.5%first-quarter gain. A jittery market in recentmonths has erased some of those gains, however.The fund has historically performed worse thanlargeblend peers in down markets, with itscontrarian nature and significant stake in foreignequities (nearly a third of assets) going hand inhand with heightened volatility.Nonetheless, longtime manager FundManager is not shying away from controversialholdings. Earlier this year he bought ChesapeakeEnergy CHK, whose stock price has since plungedfurther on liquidity concerns and corporategovernance problems. Holdings like that oftenlead to rocky stretches for the fund, but theyreflect how Manager has invested for decades.He looks for companies trading at a 25% discountto their estimated intrinsic values and often buysw Sensitivem Cyclicalmore on further declines. For instance, he addedto Japanese trading firm Itochu in the aftermathof last year's tsunami, pleased it had half of itsbusiness tied to fast-growing economies outsidethe country. The stock is up double digits for thepast year through mid-May.While venturing overseas and seekinglesser-known names across the market-capspectrum have long defined this fund, Manageralso finds value in more established names. Hebought Microsoft MSFT in late 2011 (the thirdtime he's owned it in his career), saying it'scheap, has a reasonable yield, and can improvemargins.Manager has successfully implementedthis strategy for years, with the fund's rollingthree-year returns since his 1996 start datelanding in the category's top quartile 73% of thetime. Unfortunately, shareholders haven'tcaptured all those gains: The fund's dollarweighted returns are significantly worse than itstotal returns. Patient investors willing to deal withsome volatility should do well. 2012 Morningstar, Inc. All rights reserved. The information, data, analyses, and opinions contained herein (1) include the confidential and proprietary information of Morningstar, Inc., (2) may not be copied orredistributed, (3) do not constitute investment advice offered by Morningstar, Inc., (4) are provided solely for informational purposes and therefore are not an offer to buy or sell a security, and (5) are not warranted to becorrect, complete or accurate. Morningstar, Inc. shall not be responsible for any trading decisions, damages, or other losses resulting from, or related to, this information, data, analyses or opinions or their use. AnalystRatings are subjective in nature and should not be used as the sole basis for investment decisions. Analyst Ratings are based on Morningstar’s current expectations about future events; therefore involves unknown risksand uncertain-ties that may cause Morningstar’s expectations not to occur or to differ significantly from what was expected. Morningstar does not represent its Analyst Ratings to be guarantees nor should they be viewedas an assessment of a fund’s or the fund’s underlying securities creditworthiness.
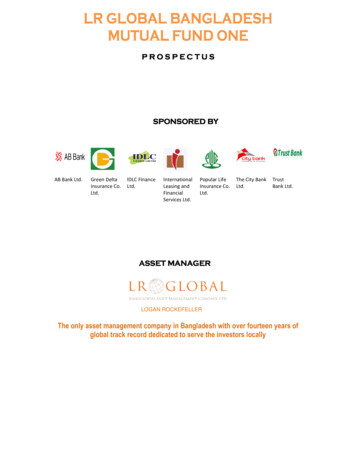
Global Fund ReportMorningstar has conducted qualitative, analyst-driven research on funds since 1986. An essential complement to ourdatabase of investment information and our suite of quantitative research tools, such as the Morningstar Ratingand the Morningstar Style Box, Morningstar fund analysis has always had a focus on helping the user make betterinvestment decisions.TMTMA Morningstar Analyst RatingTM The MorningstarAnalyst Rating is a forward-looking assessmentthat reflects our analysts’ opinions about a fund’slong-term potential for superior risk-adjustedperformance. Each fund’s strengths and weaknessesare measured across five key pillars: Process,Performance, People, Parent, and Price. Using theseassessments, a fund is then assigned one of thefive Analyst Ratings: Gold, Silver, Bronze, Neutral,and Negative. This rating is based on the rigorousassessment of a fund using both quantitativeand qualitative inputs along with insights gleaneddirectly from manager interviews by a Morningstarfund analyst. The final Analyst Rating assignmentis made in conjunction with the relevant asset-classratings committee, which is composed of senioranalysts and directors. The Analyst Rating does notexpress a view on a given asset class or peer group;rather, it seeks to evaluate each fund within thecontext of its objective, an appropriate benchmark,and peer group.The Morningstar Rating for funds (the star rating)remains a purely quantitative measure based onrisk-adjusted past performance, and it is distinctfrom the Analyst Rating. In fact, Morningstaranalysts may apply an Analyst Rating of Neutralor Negative to a 5-star fund, or conversely, apositive Analyst Rating to a fund that earns a lownumber of stars.Analyst Rating ScaleŒ Best-of-breed fund that distinguishes itselfacross the five pillars and has garnered the analysts’highest level of conviction.„ Fund with notable advantages acrossseveral, but perhaps not all, of the five pillars—strengths that give the analysts a high level ofconviction. Fund with advantages that outweighthe disadvantages across the five pillars and withsufficient level of analyst conviction to warranta positive rating.‰ Fund that isn’t likely to deliver standoutreturns but also isn’t likely to significantlyunderperform, according to the analysts.Á Fund that has at least one flaw likelyto significantly hamper future performance andthat is considered by analysts an inferior offeringto its peers.B Morningstar Pillars The Morningstar AnalystRating is based on an analyst’s assessment of a fundin five critical areas: Process, Performance, People,Parent, and Price. Morningstar analysts assign apositive, neutral, or negative rating to each of thefive pillars to help investors understand how a fundstacks up in the key areas underpinning their broadassessment and rating assignedProcess: Approach The first of the five pillars ofthe Analyst Rating, Process, is divided into twocomponents—Approach and Portfolio. The Process:Approach page highlights the fund managementteam’s general approach to investing and describesthe team’s philosophy and process for makinginvestment decisions. It also provides an overviewof a fund’s portfolio by compiling data about itsholdings into a series of aggregate style, assetclass, and regional statistics. Data is shown incontext, relative to a fund’s category peers, index,and its own past. Note: Mutual funds are requiredto disclose holdings at least quarterly. In somecases, the portfolio date for a fund will be differentfrom the date of the performance statistics.Process: Portfolio The second component ofthe Process pillar is Portfolio. This page providesanalyst insight into the fund’s most-recentportfolio, highlighting recent shifts in the portfoliocomposition and how its holdings compare with theunderlying composition of the fund’s category index.It also lists the largest common holdings and largestdistinct holdings, helping investors to see howdifferentiated a fund is from its benchmark.Performance The second pillar of the AnalystRating is Performance. This page provides theanalyst’s take on the fund’s recent performance andplaces it in context with its longer-term performancetrends. It also includes multiple return and riskmeasures that analyze the fund’s performance onboth an absolute and relative basis.People The third pillar of the Analyst Rating isPeople. This page provides Morningstar’s takeon the fund’s portfolio managers, as well asthe analysts who support their efforts. Do theyhave advantages over their peers? Have theydemonstrated their expertise and skill? Alsoincluded is information about the managers’ownership of fund shares to reveal if the fund’smanagers “eat their own cooking.” Studies byMorningstar have shown that manager ownershipis directly correlated to fund performance.Parent The fourth pillar of the Analyst Rating isParent. This page provides Morningstar’s take onthe fund’s parent company with an analysis of thefirm’s stewardship practices and how it has treatedshareholders in the past. Manager turnover atthe firm, the investment culture, quality of research,ethics, fund board directors, and SEC sanctions allfactor into the parent evaluation to determinewhether or not a firm consistently puts investorinterests first. For firms evaluated underMorningstar’s Stewardship GradeSM for fundsmethodology, the grade directly informs theParent rating, with A and B stewards receiving aPositive pillar score, C stewards a Neutral score,and D and F stewards a Negative score.Price The final pillar of the Analyst Rating is Price,and it refers to the cost of purchasing and owningthe fund, not its actual net asset value. This pageprovides a broader understanding of the fund’s feesby showing absolute, relative, and historical feemetrics. Fees and investment costs are importantbecause costs are one of the strongest predictors offuture performance—the lower its costs, the bettera fund tends to perform. This report includes severalnew data points, including the Fee Level relativeto the fund’s peer group and brokerage commissioncosts as a percentage of assets.
Page 2 of 7Morningstar Global Fund Report Print Date: June 18, 2012 FINRA Members: For internal use or client reporting purposes only.Mutual Fund AABCDXMorningstar Analyst Rating„Process: ApproachCurrent Allocation3-Year AverageAssets %Small Micro81.116.22.778.320.01.7Avg Market Cap Bil USD 33.036.270.640.8Fund 3-Yr Avg CategoryProxyPrice/Prospect. Earnings 10.5Price/Book1.4Price/Sales0.8Price/Cash Flow4.5Dividend Yield1.812.01.70.86.02.113.32.11.46.62.5Fund 3-Yr Avg 00.74.15.295.74.395.14.9Top 5 Countries Equity %Fund 3-Yr Avg CategoryProxyUnited StatesJapanIsraelCanadaUnited .63.793.80.30.20.81.513.62.0D Economic Moat 03/31/121.2Moat RatingFund 3-Yr Avg Category6.92.4Wide Moat15.925.654.5Narrow Moat48.847.539.6ProxyNo Moat35.326.95.910.5Coverage Ratio81.282.791.87.84.7E Key Ratios 03/31/129.0Fund 3-Yr Avg Category4.6Net Margin %12.410.914.5ROA %6.96.29.0Debt/Total Capital %43.640.439.0ROE %22.117.523.9C Style Box The Morningstar Style Box represents ofa fund’s overall investment style. Within this report,a detailed version of the Equity Style Box ispresented. Instead of showing placement within oneof nine squares, the style box position of individualsecurities within the fund portfolio is shown, alongwith a “centroid” that represents the weightedaverage for the holdings and an “ownership zone”that encompasses 75% of the fund’s holdings.Proxy99.6 oxy39.947.412.794.3Proxy13.39.036.222.0FundIndex Proxye91.48.40.2Fund 3-Yr Avg CategoryDevelopedEmergingitiv81.617.31.1Market Type Equity .6—F Sector Delta al Exposure 03/31/12Fund 3-Yr Avg CategoryFund 3-Yr AvgU.S. EquitiesNon-U.S. EquitiesBondsCashOtherZone: 75% of fund’sequity holdingsMarket CapLong-Term Earnings %Historical Earnings %Sales %Cash Flow %Book-Value %iShares Russell 1000IndexCentroid: Weightedaverage of equityholdingsStyle Box Factors 03/31/12Growth MeasuresIndex ProxyRussell 1000 TR USDDefGiantFundCategory AverageIndex ProxyCore HighGrowth GrowthValue MeasuresCategory IndexUS OE Large BlendAsset Allocation 03/31/12C Equity Style Box 03/31/12Deep Core CoreValue ValueMorningstar CategoryCyclicalLarger sector concentrationsversus the index move theinvestment to the corner of thetriangle corresponding to thatequity Super Sector.Equity Sector Breakdown 03/31/12SectorsFund 3-Yr Avg CategoryProxyx Defensives Consumer Defensived Healthcaref .224.910.411.13.349.3w Sensitivei Communication Serv. 2.79.9o Energy23.0p Industrials13.7a 54.110.712.318.4m Cyclicalr Basic Materialst Consumer Cyclicaly Financial Servicesu Real .413.32.637.81.118.318.40.0F Sector Delta Morningstar’s proprietary sectoranalysis divides the stock universe into three majoreconomic spheres, or Super Sectors: Defensive,Sensitive, and Cyclical. Each Super Sector includesthree or four underlying sectors for a total of 11industry sectors. The Sector Delta graph illustratesthe fund’s exposure to Morningstar Super SectorsE Key Ratios Average numbers for the fund’s equityrelative to a benchmark. The delta is anchoredholdings are shown for four key ratios: Net Marginon an index proxy, and the fund’s positioning is%, ROA % (return on assets %), Debt/Total Capitalshown relative to the index. The fund movesD Economic Moat In general terms, “economic moat”%, and ROE % (return on equity %). The Fundtoward the Super Sectors where it has the greatestrefers to a firm’s ability to keep competitors at baycolumn reflects the values of the most recentoverweighting and away from sectors where it hasfor an extended period. Morningstar’s equityportfolio reporting period alongside the 3-Yearthe greatest underweighting. Funds that appearresearch analysts assign Economic Moat Ratings ofaverage, and averages for the category and indexwithin the inner ring of the triangle are broadly 2012 Morningstar, Inc. All rights reserved. The information, data, analyses, and opinions contained herein (1) include the confidential and proprietary information of Morningstar, Inc., (2) may not be copied or redistributed,do not constituteinvestmentoffered toby Morningstar, Inc., (4) are providedproxy.solely for Ininformationalpurposesand thereforeare notarean offerto buy or sell a security, and (5) are not warrantedto be and funds toward the edges correct, complete or accurate. Morningstar, Inc. shall not be responsible for any trading decisions, damages, or other losses resulting from, or related to, this information, data, analyses or opinions or their use. AnalystRatings aresubjective in natureand sectionshould not berevealsused as thethesole basis for investment decisions.forAnalystare basedon Morningstar’s currentabout futureunknown risksfrom the index’s sector weightings in aindividualcompanies.Thisall Ratingsof thesepercentages,withexpectationsthe exceptionofevents; therefore involvesdeviatedand uncertain-ties that may cause Morningstar’s expectations not to occur or to differ significantly from what was expected. Morningstar does not represent its Analyst Ratings to be guarantees nor should they be viewedas an assessmentof afund’sfund’s or thefund’s ntageof themoat-ratedequityDebt/Total Capital.significant way. that fall into each category for the most-recentportfolio and the average for the past three years.The Coverage Ratio indicates the percentage ofstocks in the equity portion of the portfolio forwhich Morningstar equity analysts have assignedeconomic moats.ß
Page 3 of 7Morningstar Global Fund Report Print Date: June 18, 2012 FINRA Members: For internal use or client reporting purposes only.Mutual Fund AABCDXMorningstar Analyst Rating„Process: PortfolioMorningstar CategoryCategory IndexIndex ProxyUS OE Large BlendRussell 1000 TR USDiShares Russell 1000IndexSimilarity to Index Proxy 06/15/12G Index Proxy OverlapProxyFundLargest Common HoldingsNumber of Equity HoldingsFundIndex Proxy87977Holdings Overlap54Asset Overlap16.0%JPMorgan Chase & CoMicrosoft CorporationApple, Inc.General Electric CoGoogle, Inc. Class APrevious Portfolio DateEquity HoldingsFund Overlap With Index ProxyCircle size represents number ofholdings.Fund % Proxy %5.243.192.251.961.551.021.633.891.551.04Largest Distinct HoldingsFund %Teva Pharmaceutical Industries Ltd ADRMitsubishi UFJ Financial Group, Inc.Itochu Corp.Ensco PLC ADRSafran SA3.752.692.542.001.98Portfolio Holdings 03/31/12Current Portfolio Date03/31/1202/29/12Bond Holdings87Assets in Top 10 Holdings134%Turnover Ratio (Reported)75%Top 10 HoldingsCountryY JPMorgan Chase & CoFord Motor CoDow Chemical CoTeva Pharmaceutical Industries Ltd ADRY Microsoft 06/0509/11 1122 1QQQQQQQQQQQQQQQQQQQQQNarrowNoneNoneNarrowWidey Financial Servicest Consumer Cyclicalp Industrialsd Healthcarea Technology-11.31-20.53-2.11-21.5329.65T Citigroup IncY Mitsubishi UFJ Financial Group, Inc.United Continental Holdings IncItochu Corp.Chesapeake Energy 11 1134 1QQQQ—NarrowNoneNone—Narrowy Financial Servicesy Financial Servicesp Industrialsp Industrialso Energy-25.393.26-1.547.74-35.85Change since last portfolio: T IncreaseNew Holdings Largest PurchasesGlencore International PLCDunkin Brands Group IncCheniere Energy IncYandex NVEquinix, Inc.Y DecreaseAssets % Assets % Proxy % H First03/31/12 02/29/12 03/31/12BoughtIDays MorningstarEconomicTrading Rating for Stocks MoatQQQ—QQQQSector1-Yr TotalRet %R New% Assets0.590.490.390.280.28G I ndex Proxy Overlap This figure shows whatpercent of a fund’s holdings is shared with itsprospectus benchmark. A larger shaded, overlappingarea in the circle labeled “Fund” indicate moreshared holdings. A smaller number of sharedholdings can indicate a more active manager.Note that this figure does not account for assetoverlap, which is shown in the data table onthe right of the image.SectorptoaiEliminated Holdings Largest SalesSuncor Energy IncWells Fargo & CoDaiichi Sankyo Co., Ltd.Barrick Gold CorporationSony Corporation ADR% Assets0.530.500.250.240.23SectoroydraH F irst Bought Date First Bought Date is the firstportfolio date when a stock has continuously been inthe portfolio. If the First Bought Dates of most of afund’s stock holdings are recent, this can be ameasure of high turnover within a portfolio. Notethat this data point does not show the first time afund has ever purchased a particular stock. Forinstance, if Mutual Fund A buys Ford MotorCompany in January 1995, sells it in January 2005,buys it again in January 2007, and has held it since,First Bought Date will show January 2007 as thestock’s First Bought Date.Largest Position ChangesY JPMorgan Chase & CoY Apple, Inc.T AutoZone IncY Goldman Sachs Group IncR Glencore International PLCICurrent %Prior %5.242.251.070.740.595.232.670.521.630.00 Days Trading Days Trading is a measure of fundportfolio liquidity. Morningstar calculates DaysTrading by dividing the number of shares of a stockby its average daily trading volume. Higher DaysTrading can indicate that a fund will have difficultyunwinding its position in a stock.The Process pages depicted here are for theEquity report. The Fixed Income report shows theportfolio’s credit quality, interest-rate sensitivity,income statistics, and fixed income sector breakdowns. The Allocation report shows a combinationof both Equity-related and Fixed Income-relatedportfolio metrics. 2012 Morningstar, Inc. All rights reserved. The information, data, analyses, and opinions contained herein (1) include the confidential and proprietary information of Morningstar, Inc., (2) may not be copied orredistributed, (3) do not constitute investment advice offered by Morningstar, Inc., (4) are provided solely for informational purposes and therefore are not an offer to buy or sell a security, and (5) are not warranted to becorrect, complete or accurate. Morningstar, Inc. shall not be responsible for any trading decisions, damages, or other losses resulting from, or related to, this information, data, analyses or opinions or their use. AnalystRatings are subjective in nature and should not be used as the sole basis for investment decisions. Analyst Ratings are based on Morningstar’s current expectations about future events; therefore involves unknown risksand uncertain-ties that may cause Morningstar’s expectations not to occur or to differ significantly from what was expected. Morningstar does not represent its Analyst Ratings to be guarantees nor should they be viewedas an assessment of a fund’s or the fund’s underlying securities creditworthiness.ß
Page 4 of 7Morningstar Global Fund Report Print Date: June 18, 2012 FINRA Members: For internal use or client reporting purposes only.Mutual Fund AABCDXPerformanceMorningstar Analyst Rating„J Morningstar Rating and Risk tar CategoryCategory IndexUS OE Large BlendRussell 1000 TR USD200920102011Load-Adj Morningstar Morningstar MorningstarReturn %Ret vs Cat Risk vs Cat Rating3 Years5 Years10 Years12-Month Rolling Return %Fund120Full Manager ChangePartial Manager Change904.67Low Above Avg Q-4.83LowHigh Q4.79 Above AvgHigh QQQOverall RatingK History 05/31/12201260300QQ-303-Year Return and Risk Analysis 05/31/12FundTotal Return %26Category-60Index3227222449556699-22.86 40.40 17.93 15.10 15.66 16.18 -46.09 42.83 12.87 -15.24-0.61 13.35 7.90 9.22 1.49 10.02 -8.30 14.66 -1.13 -13.97-1.21 10.51 6.52 8.83 0.20 10.41 -8.50 14.40 -3.22 -16.7421161160.00161718Standard Deviation1920210.000.000.000.390.000.77L Trailing Returns (Annualized) 05/31/12FundCategoryIndexStandard DeviationSharpe ntile Rank in CatTotal Return USD /- Category /- Index0.00 %Income Return1 Year3 Years5 Years10 YearsTenure 07/96Inception 07/96N 3-Year Performance Attribution 04/30/12Total InvestorRet %Ret %% Rankin CatCatRet %IndexRet %-13.29 -15.136.669.32-3.75 75-1.933.525.385.38-1.2315.28-0.754.526.836.83M Rolling-Returns Summary 05/31/12Maximum 7911/0702/0916.00-51.1311/0702/0916.00J Morningstar Rating The Morningstar Rating forfunds provides a quick assessment of a fund’s pastrisk- and load-adjusted performance relative to itscategory peers. Funds are rated for the trailingthree-, five-, and 10-year periods, and these ratingsare combined to produce an overall rating. TheMorningstar Rating for funds is completelyquantitative and based solely on each fund’s pastrisk-adjusted performance.0.00334.96 %1.11-0.3922Return/Risk Analysis 05/31/12Max Drawdown (%)Peak DateValley DateMax Drawdown (Months)Quartile Rank in Cat* * & & & & ) & ( ) *61%6102336-Month Rolling Periods109 Observations, 9 YearsThe shading and percentagescorrespond to how often thefund’s returns landed in eachcategory quartile.L Trailing Returns This section highlights MorningstarInvestor Returns (also known as dollar-weightedreturns). Investor Returns measure how the averageinvestor fared in a fund during each time periodby incorporating the impact of cash inflows andoutflows from purchases and sales. Tenure return isa point-to-point calculation, with the start date beingthe start date of the longest-tenured manager on thefund. When compared, these values provide insightinto the relative performance of a fund under currentmanagement and over its lifetime.Attribution %FundCategory MedianRange (90% of Fund Category PercentileMedian95th5thSector AllocationCountry AllocationStock 00—-4.861.740.62—2.680.78Total Attribution-6.47———Performance Attribution Index Proxy:iShares Russell 1000 Index stacked up in every three-year period throughoutits relevant history, encompassing a wider rangeof market environments. The Rolling-Returns featureprovides a quick look at the dispersion of rolling36-month returns and show often the fund landedin each of its category’s quartiles. The statisticsare survivorship-bias-free, using the rank againstcategory peers as of the historical date.N 3-Year Performance Attribution Performanceattribution analysis compares the fund’s return withK History The History graph provides performancethat of its category index and attributes the excessdetails for the current year and up to 10 previousreturn to decisions in the investment-managementyears. It includes the fund’s rolling 12-monthM Rolling-Returns Summary Rolling returns offer aprocess and other factors. Attribution statistics arehistorical returns. Income Return is the portion ofuseful lens into a fund’s full return history and can 2012 Morningstar, Inc. All rights reserved. The information, data, analyses, and opinions contained herein (1) include the confidential and proprietary information of Morningstar, Inc., (2) may not be copied or (3) dotonotdistributions,constitute investmentassumingadvice offered byMorningstar, Inc., (4) arehelpprovidedsolely for informationalpurposestheand thereforeare not an offerbuy or sell a security, and (5)notare notwarranted toforbe some Morningstar categories.availabletotal returnredistributed,attributedthatinvestorssee throughhaze causedby tothecorrect, complete or accurate. Morningstar, Inc. shall not be responsible for any trading decisions, damages, or other losses resulting from, or related to, this information, data, analyses or opinions or their use. Analystare subjectivein nature and shouldbe usednoas the sole basis for investment latestdecisions.data.Analyst Ratingsare based on aMorningstar’scurrent expectationsthe investorRatingsincursno transactionfees,notpaysFor example,fund’s currenttrailingabout future events; therefore involves unknown risksand uncertain-ties that may cause Morningstar’s expectations not to occur or to differ significantly from what was expected. Morningstar does not represent its Analyst Ratings to be guarantees nor should they be viewedassessmentof a fund’s or the andfund’s underlyingsecuritiestaxes at theas antimeof distribution,reinvestsall creditworthiness.three-year return measures one discrete period.distributions paid during the period. The graph alsoWith rolling returns an investor can look back overnotes any full or partial manager changes.a much longer period to see how a particular fundß
Page 5 of 7Morningstar Global Fund Report Print Date: June 18, 2012 FINRA Members: For internal use or client reporting purposes only.Mutual Fund AABCDXPeopleMorningstar Analyst Rating„O Experience and Asset LoadMorningstar CategoryCategory IndexUS OE Large BlendRussell 1000 Value TRUSD5-Year Manager-RetentionRate (Firm-wide)Largest Manager Investmentin Fund81%More than 1 Mil USDP Management TeamTotal AUM Bil USD in Funds Managed20 Number of ManagersLongest Tenure517.42 Years1510AdvisorSubadvisorFund Company, LLCAsset Management Company, LLP50051015 Tenure YearsFund Mananger 08/99 to PresentYears of ExperienceInvestment in Fund13More than 1 Mil USDQ Fund AUM15,219 Mil USDRCurrent Funds Managed13Largest Funds ManagedTenure DatesRoleMutual Fund AMutual Fund BMutual Fund CMutual Fund DMutual Fund ent05/02-PresentLead1 of 5Lead1 of 6LeadLargest Funds ManagedTenure DatesRoleMutual Fund AMutual Fund BMutual Fund CMutual Fund DMutual Fund ent05/02-Present1 of 51 of 51 of 5Lead1 of 5Largest Funds ManagedTenure DatesRoleMutual Fund AMutual Fund BMutual Fund CMutual Fund DMutual Fund ent07/07-Present1 of 51 of 51 of 51 of 61 of 5Fund SizeBil USDInvestmentMil USDTurnoverRatio AvgTenureRet %IndexRet %8.452.141.
Global Fund Report The Morningstar Global Fund Report is a seven-page report that offers the most relevant data and analysis surrounding a fund. Central to this . spectrum have long defined this fund, Manager also finds value in more established names. He bought Microsoft MSFT in late 2011 (the third