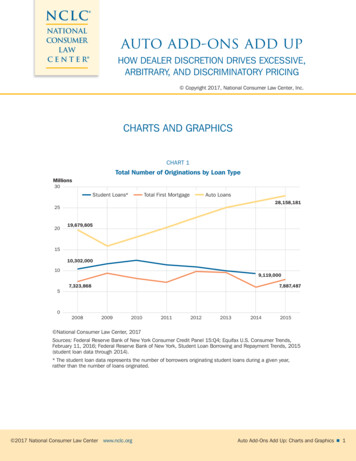
Transcription
Session E-GRAFAdd Beautiful Charts to YourApplications Using FoxChartsDoug HennigStonefield Software Inc.Email: dhennig@stonefield.comCorporate Web sites: www.stonefieldquery.com andwww.stonefieldsoftware.comPersonal Web site: www.DougHennig.comBlog: DougHennig.BlogSpot.comTwitter: DougHennigOverviewFoxCharts is a free component from VFPX that uses 100% VFP code to create beautiful modern-looking charts.It can create many different types of charts: bar, column, pie, doughnut, line, area, and so on, and supports 3-Deffects. It makes full use of colors, including transparency, using solid, gradient and hatch brushes. This sessionlooks at the basics of FoxCharts and then moves on to creating more complex charts. It also shows a help utilitythat allows your users to modify the chart as they desire at runtime.Add Beautiful Charts to Your Applications Using FoxCharts 2014 Doug Hennig(Group VFP)21st European Visual FoxPro DevCon 2014E-GRAF 1
IntroductionFor many years, VFP developers wanting to add charts to their applications used Microsoft Chart, an ActiveXcontrol that’s installed with VFP. However, like the other ActiveX controls that come with VFP, MSChart is anold-looking control, mostly because it uses GDI rather than GDI for rendering charts. This means it doesn’tsupport things like anti-aliasing, which make text and lines smoother, or transparency, which gives interestingcolor effects. As a result, VFP developers often turned to other third-party solutions. For example, mycompany’s product, Stonefield Query, uses TeeChart from Steema Software.Fortunately, you can now create beautiful charts in your VFP applications using 100% VFP code and noActiveX controls, thanks to FoxCharts by Cesar Chalom. FoxCharts is a VFPX project, so it’s both free and opensource. FoxCharts uses GDIPlusX, another VFPX project, to perform the actual drawing, so it takes fulladvantage of all the capabilities of GDI .FoxCharts can create a variety of common chart types, such as bar, pie, and area charts. It can use any type ofcolors, including transparency and gradients. It has customizable tooltips and supports mouse events so you can,for example, do drilldowns from one chart to another.FoxCharts can be a little overwhelming, mostly because of the vast number of properties available. However,that’s true of any charting component because they usually provide full control over all aspects of the chart.Let’s take a look at FoxCharts and see what’s involved in using it your applications.Installing FoxChartsSince FoxCharts is part of VFPX, navigate your browser to http://vfp.codeplex.com. Find FoxCharts in theProduction Releases section of the Project List and click “FoxCharts” to go to the FoxCharts project page or therelease date in the list to go to the FoxCharts download page (don’t worry about the date shown in the list; it isn’talways updated). As of this writing, the current production version of FoxCharts is 1.37b, released April 14,2013, although there’s also a beta version, 1.46, released April 7, 2014. See Figure 1.Figure 1. Download FoxCharts from the VFPX FoxCharts download page.Unzip the download file into the folder of your choice. This creates two subdirectories: Samples, which includesmany samples that show how to use FoxCharts (run DemoStart.PRG to display a form listing all of the samples),and Source, the source code for FoxCharts.21st European Visual FoxPro DevCon 20142 E-GRAFAdd Beautiful Charts to Your Applications Using FoxCharts(Group VFP) 2014 Doug Hennig
Alternatively, if you use Thor (another VFPX project), you can install FoxCharts from the Thor Update dialog(Figure 2). Choose Check for Updates from the Thor menu, turn on the check mark for FoxCharts, and clickInstall Updates.Figure 2. You can install FoxCharts using Thor.You should also download the help for FoxCharts; this is provided as a zipped CHM file, FoxChartsHelp.CHM.Note that you have to right-click, choose Properties, and click the Unblock button or the help won’t displayproperly due to Windows security.Other downloads are also available, including a video, a tutorial, and some add-ons tools.To add FoxCharts to your application, add FoxCharts.VCX and GDIPlusX.VCX, both in the Source folder, toyour project. In addition, System.APP (the core component of the VFPX GDIPlusX project, which FoxChartsuses), also in Source, needs to be distributed with your application and either placed in the application folder orin a folder in the VFP path. There’s only one class we’ll use directly: FoxCharts in FoxCharts.VCX.Our first chartLet’s create a simple bar chart. Do the following: Create a formDrop an instance of FoxCharts on it, name it oChart, and size it appropriately.Put the code shown in Listing 1 into the Init method of the form.Run the form. The result is shown in Figure 3.Listing 1. Put this code into the Init of the sample form to create a chart.* Get the data for the chart.open database samples 'Northwind\Northwind'select Categories.CategoryName, ;sum(OrderDetails.UnitPrice * OrderDetails.Quantity) as Sales ;from Products ;join Categories on Products.CategoryID Categories.CategoryID ;join OrderDetails on Products.ProductID OrderDetails.ProductID ;group by 1 ;into cursor ChartDatawith This.oChart as FoxCharts of FoxCharts.vcx* Specify the chart type and other settings.Anchor.ChartsCount 15 1Add Beautiful Charts to Your Applications Using FoxCharts 2014 Doug Hennig(Group VFP)21st European Visual FoxPro DevCon 2014E-GRAF 3
.ChartType.ColorType 7 && Bar 0* Specify the data for the FieldLegend 'ChartData''CategoryName''Sales'.FieldAxis2* Specify the chart and axis ion.YAxis.Caption 'Sales by Product Category''''Product Category''Total Sales'* Draw the chart.DrawChart()endwithFigure 3. This chart was created using the code from Listing 1.Other than the X-axis labels being jumbled, that looks pretty good for a first effort. Fix the labels by adding thesetwo lines of code to Init, then run the form again to get the chart shown in Figure 4.AxisLegend2.Rotation.AxisLegend2.Alignment -45 1 && Right21st European Visual FoxPro DevCon 20144 E-GRAFAdd Beautiful Charts to Your Applications Using FoxCharts(Group VFP) 2014 Doug Hennig
Figure 4. Adding the two lines of code fixes the X-axis label issue.Let’s look at the code. Setting Anchor to 15 makes the chart resize when the form does; FoxCharts automaticallyredraws the chart when that happens. The ChartsCount property indicates the number of data series in the chart;in this case, we just have one. As its name suggests, ChartType controls the type of chart: 7 means a bar chart;we’ll look at other types later. ColorType indicates how the bars should be colored; 0 means use basic colors.SourceAlias is the name of the cursor containing the data for the chart. FieldAxis2 specifies the name of the fieldin the cursor used for the X-axis values and Fields(N).FieldValue (where N is the series number) specifies thefield used for the Y-axis values. FieldLegend contains the field used for legend values, so it’s normally the sameas FieldAxis2.The chart has several titles: main title, subtitle, and X-axis and Y-axis titles. The code sets the Caption of thesetitles. AxisLegend2 controls the X-axis labels. Setting Rotation to -45 rotates the labels so they don’t overlap andsetting Alignment to 2 right-aligns them.Finally, the call to DrawChart does the actual rendering of the chart.Try experimenting with some of the values. For example, if you set ColorType to 2, you’ll get a different,random set of colors used on every run. If you set it to 3, the colors progress in a gradient from Fields(N).Colorto near white. Setting BrushType to 2 uses a gradient for bars and legend symbols. Figure 5 shows the chartcreated with ColorType set to 3, Fields(1).Color to RGB(255, 0, 0) (red), and BrushType to 2.Add Beautiful Charts to Your Applications Using FoxCharts 2014 Doug Hennig(Group VFP)21st European Visual FoxPro DevCon 2014E-GRAF 5
Figure 5. Setting ColorType to 3 and BrushType to 2 uses gradients.Data for your chartsThe code in Listing 1 creates a cursor used for the chart. That isn’t necessary; if the data to chart exists in a tableand is in the proper format for the chart, you can use the table instead. Some things to note about the data for achart: FoxCharts doesn’t use the original table or cursor; instead, it uses use SQL statement to create a newcursor that it operates on. That means any filter or index order for the table or cursor is ignored.Fields that aren’t specified for the various chart properties are ignored.The order of the fields is irrelevant; only their names are important.Each data series must be in a single record and each data point in a single field.As a result of these issues, you may find it more convenient to create a cursor with the desired content thantrying to make an existing table fit FoxChart’s needs.The last point, that each data series must be in a single record, can make creating a cursor with the desiredstructure a challenge. For example, suppose you want a chart of sales by product category and year such as thatshown in Figure 6. You might think the SQL statement shown in Listing 2 would give you the data needed.Figure 6. It can be challenging creating a cursor used for a chart with multiple series.Listing 2. This SQL statement creates a cursor but not in the required format to chart multiple series.select Categories.CategoryName, ;year(Orders.OrderDate) as Year, ;sum(OrderDetails.UnitPrice * OrderDetails.Quantity) as Sales ;from Products ;join Categories on Products.CategoryID Categories.CategoryID ;join OrderDetails on Products.ProductID OrderDetails.ProductID ;join Orders on OrderDetails.OrderID Orders.OrderID ;group by 1, 2 ;into cursor SalesDataHowever, that creates the cursor shown in Figure 7. The problem with this cursor is that each series appears inmultiple records. For example, there are three records for Beverages rather than a single one. What is reallyneeded is a cursor with a “cross-tab” structure. A cross-tab structure means that there’s one record per series withthe row, or X-axis, values in one field and there’s one field per series value, each containing the value to chart.21st European Visual FoxPro DevCon 20146 E-GRAFAdd Beautiful Charts to Your Applications Using FoxCharts(Group VFP) 2014 Doug Hennig
Figure 7. This cursor doesn't have the correct structure for a multi-series chart.Although you can’t easily create the desired structure using a SQL statement, there are several ways you canconvert the cursor created by a SQL statement into a cross-tab cursor: VFP comes with a program, VFPXTab.PRG, referenced using the GENXTAB system variable, whichcan create the desired structure. However, that program is inflexible and slow so isn’t recommended.Val Matison created a program called MatXTab that does something similar but is much faster. It’savailable at http://www.jjtc.com/Fox/foxfiles/matxtab.zip.Even faster is FastXTab by Alexander Golovlev, available from http://tinyurl.com/lh2rsz9.One of the downloads on the FoxCharts downloads page is “FoxCharts Tools: VisualChartDesigner andGetChartDataFromRows.” GetChartDataFromRows.PRG can both massage your cursor andautomatically update the FoxChart object to use it.My examples use FastXTab. It’s easy to convert the cursor shown in Figure 7 to that in Figure 8. This cursor hasthe required structure for FoxCharts: all of the values for each series are in one record.loXTab newobject('FastXTab', 'FastXTab.prg')with loXTab.lCursorOnly .T.lCloseTable .F.cOutFile 'ChartData'.RunXTab()endwithAdd Beautiful Charts to Your Applications Using FoxCharts 2014 Doug Hennig(Group VFP)21st European Visual FoxPro DevCon 2014E-GRAF 7
Figure 8. This cursor is in the format required for charting multiple series.If the row field isn’t the first field, the column field isn’t the second, or the data field isn’t the third in the cursor,you can specify the field numbers for those three fields in properties of FastXTab.Once you’ve created the cursor, you need to set ChartsCount to the number of series and setFields(N).FieldValue and Fields(N).Legend to the name of the field and the legend caption for the series,respectively. The following code uses the original cursor to get the number of unique series and populates theproperties accordingly.select distinct Year from SalesData into cursor Temp.ChartsCount tallylnSeries 1scanwith .Fields(lnSeries).FieldValue 'N ' transform(Year).Legend transform(Year)endwithlnSeries lnSeries 1endscanuseCreating different chart typesThe ChartType property controls the type of chart drawn. FoxCharts supports five different types of charts: BarPointLineAreaPie/doughnutSome of these have variations; for example, bar charts can be vertical or horizontal. Some of them are suitablefor a single series of data while others use more than one series.Let’s look at the different chart types. Note: the figures shown in this section come from runningChartTypes.SCX, included with the sample files for this document, and choosing different chart types from thecombo box.Bar chartsThere are ten types of bar charts, shown in Figure 9 through Figure 13. The first two use a single series of datawhile the rest use multiple series. Note also that for horizontal charts, FoxCharts automatically flips the X- andY-axis values and labels, but you have to manually set the XAxis.Caption and YAxis.Caption properties to theappropriate values for the orientation of the chart.21st European Visual FoxPro DevCon 20148 E-GRAFAdd Beautiful Charts to Your Applications Using FoxCharts(Group VFP) 2014 Doug Hennig
Figure 9. Bar charts, types 7 and 12.Figure 10. Bar charts, types 8 and 13.Add Beautiful Charts to Your Applications Using FoxCharts 2014 Doug Hennig(Group VFP)21st
Download FoxCharts from the VFPX FoxCharts download page. Unzip the download file into the folder of your choice. This creates two subdirectories: Samples, which includes many samples that show how to use FoxCharts (run DemoStart.PRG to display a form listing all of the samples), and Source, the source code for FoxCharts. Add Beautiful Charts to Your Applications Using FoxCharts 21st European .