Transcription
15 Years to Build a Scaled Business2Full Year Results FY21
Agenda3FY21 Highlights– Robert Forrester CEOFinancial Results – Karen Anderson CFOStrategic Update and Outlook – Robert Forrester CEOFull Year Results FY21
FY21 HighlightsTechnological Innovation4Delivered Enhanced ScaleAchievedLiquidityClick2Drive sales techplatform best in class 3.7bn normalisedrevenue businessRobotics technologyimproves efficiency149 sales outletsData platforms aidingdecision makingFocus on Cost and30 outlets added sinceJan 2020BMW/MINI franchisesgainedDecisive action toreduce costs as activitycurtailed by Covidrestrictions 10m annualised savingfrom restructuringEffective cash flowmanagementCulture87% of colleaguesconsider the Group agreat place to work98% of colleaguesknow the Values93% believe thedirectors activelypractice theseFull Year Results FY21
FY21 Financial uesGross MarginFree Cash FlowEPS 2.5bn11.8% 48m4.44p(21.6%) 22.4m153%50.2pLike-for-likedeclineProfit before taxFCF conversionTangible NetAssets per shareFull Year Results FY21
Financial ResultsKaren Anderson CFOFull Year Results FY21
Income Statement7March to May ’m (unless otherwise stated)RevenueFY21June to FebruaryFY20FY21FYFY20FY21FY20% )Gross profit39.591.4261.5242.7301.0334.1(9.9%)Gross margin %11.9%9.9%11.8%Furlough grant support received17.7-10.1-27.8-Operating .3%)Adjusted1 operating (loss) / profit(11.7)15.245.517.033.832.2 924.623.0Non-underlying items(2.2)(15.7)Profit before tax22.47.3Underlying tax rate %21.3%19.7%5.27p4.99pNet finance chargesAdjusted1 (loss) / profit before taxAdjusted1 Basic EPS (pence)Gross Margin strengthened: used pricingbenefits, commercial vehicle marginsbuoyant1 ExcludingOperating Expenses: benefit ofgovernment support, tight cost control andstructural reductionnon underlying items (share based payments, amortisation of intangibles and impairment charges)11.4%11.8%10.9% 0.9%-- 7.0% 206.8% 5.6%Net Finance Charges: Savings on stockingcharges in the June to February periodoffset higher charges in Q1Full Year Results FY21
Profit Bridge8All values ’ millionJun – Feb2Group Profit before tax 39mQ1 Mar – May significantlyimpacted by first lockdownGroup Loss before tax2 ( 14m)20(45)Core Group Gross Profit tExpense2523818(1)(4)-(2)AdjustedProfit beforetax FY20GovernmentCore GroupSupport1Loss upport1New VehicleGross ProfitIncludes Furlough grant support receipts and business rates reliefAdjustedFleet andCommercialGross ProfitUsed VehicleGross ProfitAftersalesGross ProfitAdjustedProfit beforetax FY21Full Year Results FY21
Cost-focus: Maximising ProductivityGovernment and other support 27.8m Furlough grant supportreceived 10.5m business rates relief andgrant supportManufacturer and other supplieractions reduced franchise costsand aided cash flow9Variable cost reductions Vehicle fleet costsTraining moved onlineActivity based costs reduced: Vehicle cleaning Energy ConsumablesImproved productivity Sales process enhancementincluding onlineClick2Drive digital sales techplatformSwitch to contactless digitalprocessesUse of robotic processesDelivering 1 16m1 reduction in Core Groupoperating expenses year-on-yearexcluding government support (furlough and business rates relief) 10m annualised cost savingsthrough reduced headcount Sustainable higher productivitylevels achievedFull Year Results FY21
Strong Free Cash Flow10Net cash flow from operating activities: 75m29Uses of Free Cash Flow(16)Leases: (3)Other: (13)(11)(16)30Leases: 1648(20)Other: 1432(2)(2)24153%FCF nWorkingCapitalExcluding IFRS 16 liabilitiesInterest sFree CashFlowNet M&APurchase of Purchase of ReductionFreeholdin Net Debt1TreasuryLand andSharesBuildingsFull Year Results FY21
Net Debt11Facilitiesat 28 Feb 21 ’mDrawnat 28 Feb 21 ’mFacilitiesat 29 Feb 20 ’mDrawnat 29 Feb 20 ’m43.65 year acquisition facility (from February 2019)62.053.862.020 year mortgage facility (from December 2020)12.712.6--1 year working capital facility (from May 2021)48.0-68.0-122.766.4130.043.6Total committed facilitiesCash1Adjusted net (cash)/debtUsed vehicle stocking loansOverdraftTotal facilitiesNet debt (excluding IFRS 16 -5.0-172.7170.04.528.3IFRS 16 liabilities91.196.9Total Net Debt95.6125.2Repayment Mortgage: provided by BMW Financial Services,secured on properties acquired in year, interest fixed for 5years at 2.9%1 Excludesused vehicle stocking loans and IFRS 16 liabilitiesHedging: 22m (41%) of floating rate bank borrowingcovered by interest rate hedgesFull Year Results FY21
Capital Allocation Discipline12Portfolio Management and GrowthTarget EV/EBITDA ratios by year 3 on acquisitionsPortfolio review to identify poor performing assetsProperty portfolio optimisationCore Croup InvestmentCapital expenditureIncreasing Manufacturer flexibility over formats andrepresentationStrong Balance SheetTangible net assets per share 50.2pFirepower to grow scale with debtShare BuybacksPotential use of excess FCF at share prices belowintrinsic valueDividendsConsidered important disciplineIntention to re-establishFull Year Results FY21
Balance Sheet1328 Feb 2021 ’mIntangible assets29 Feb 2020 ’m101.1101.46.28.981.287.0Tangible assets246.7229.1Non-current assets435.2426.4Current ment benefit assetRight of use assetsProperty assets held for saleCash and cash equivalentsTotal assetsCurrent liabilities(703.0)(730.1)Non-current liabilities(18.8)(19.0)Lease liabilities(91.1)(96.9)Borrowings(72.4)(69.2)Net assets275.9263.4Tangible net assets181.6168.8Tangible net assets per share (pence)50.2pIntangible assets: 1.5m non-cashimpairment of goodwill included in nonunderlying costsAssets held for resale: includes threeempty properties arising from portfoliomanagement optimisationNon-current liabilities: includes deferredincome on warranties ( 9.2m) and deferredtaxation ( 9.2m)46.0pFull Year Results FY21
Strategic UpdateRobert Forrester CEOFull Year Results FY21
Evolving Trends15Customers Acceleration of propensity to embrace online as part of buying journey Strong customer satisfaction and local presence importantIndustry Changing Manufacturer ambitions and distribution arrangements (including agency) New entrants and disruptersTechnology Data analytics driving understanding of customer journey, marketing and strategicdecision making Enhanced productivitySustainability Electrification opportunity Responsible business practicesFull Year Results FY21
Mission &ValuesGroup Strategy16To aim for every dealership to bethe best retailer in their respectivetown or cityTo deliver an outstanding customer motoringexperience through honesty and trustVertu Motors to be the mostadmired and respected dealergroup in the automotive industrySustainabilityGoalsStrategic GoalsPASSION RESPECT PROFESSIONALISM INTEGRITY RECOGNITION OPPORTUNITY COMMITMENTGrowthDigitalisationCost FocusTo grow as a major scaledfranchised dealership groupand to develop our portfolioof Manufacturer partners,whilst being mindful ofindustry developmenttrends, to maximise returnsTo be at the forefront ofonline retailing anddigitalisation in the sector,delivering a cohesive‘”bricks and clicks” strategyTo reduce the cost base ofthe Group through scaleeconomies including usingdigitalisation of processesto reduce costsWork with our Manufacturerpartners to provideincreasingly sustainablechoices for customersColleague &Customer focusAncillarybusinessesTo develop and motivate theGroup’s colleagues to ensureconsistency of operationalexcellence and delivery tocustomers across the businessTo develop ancillarybusinesses to add revenueand returns whichcomplement the corebusinessReduce the environmentalImpact of our businessCare for our colleagues andsupport communitiesFull Year Results FY21
Sustainability17Work with our Manufacturerpartners to provideincreasingly sustainablechoices for customersGoals Increase the share of the Group’ssales of alternatively fuelledvehicles by a minimum 30% eachyear to 2030Maintain our position as the UK’slargest supplier of vehicles to theMotability fleetCare for our colleagues andsupport communitiesReduce the environmentalImpact of our businessGoals Deliver an annual 10% like-forlike reduction in the energy theGroup draws from the nationalgrid70% of all dry waste to berecycled by 202525% of the corporate fleet to bealternatively powered by 2025Goals At least 90% of Colleagues toagree that the Group is a greatplace to workContinue to support causes localto our dealership networkapplying a central support budgetof 150,000 per annumFull Year Results FY21
Growth: Opportunities to Fulfil Ambitions18GroupSalesOutletsUK totalsales points% of UKsales pointsrepresentedby %6.4%Land Rover61165.2%5.7%Jaguar3843.6%5.2%SEAT & Cupra41223.3%5.2%Volkswagen91854.9%4.9%Renault & Dacia61553.9%4.5%Citroen & .2%FranchiseOther & non franchiseTotalGroupshare offranchisenew retailsales FY21UK dealer network highly fragmentedTop 10 dealer groups represent 25% of UK outlets,Group 5th largest in revenuesIncreased scale brings brand awareness andefficiency benefits30 sales outlets added since 1 January 2020 including3 new franchise partnersIncrease in multi-franchising of locations being actioned1 EstimatedFull Year Results FY21
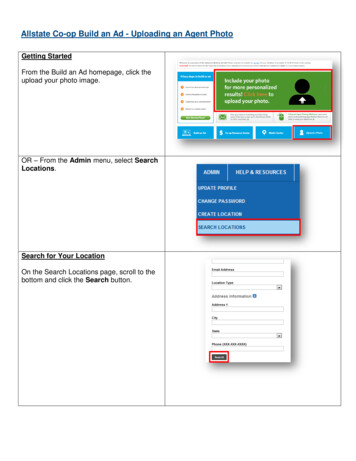
Importance of Brand Awareness19Drive 3 core Group brands; going forward 9Farnell outlets to be re-branded toVertuSignificant terrestrial TV and videoon-demand campaignsBuilding awareness throughsponsorshipSocial PFA Fans Player of the month Highest number of Facebookfollower in sector Building awareness throughsponsorshipManufacturer advertising budgetsprovide significant support to Group’sfranchised outletsMeasure YouGov survey of brand awarenessutilised monthlyOver 5,000 adult respondersHigh brand awareness for BristolStreet Motors evidentOptimise Website efficiencyConversion rate optimisationProduct maximisationPay per click analytics and efficiencyOrganic search enhancement forcore brand websitesFull Year Results FY21
Importance of Brand Awareness20Full Year Results FY21
Digitalisation: Three Types of Customer (at least!)Customers who want tocomplete a transactionentirely onlineCustomers who want topurchase on their terms,flexing between21Customers who prefer totransact in person physicallyat a dealershiponline and at a dealership434 ‘pure’ online vehicle transactionscompleted in FY214,728, 99 vehicle reservation depositspaid in FY21Significant increase in sales volumesfollowing lockdown easing in April 202138,446 retail vehicles sold during thirdlockdown (Jan-Mar) with no showroomvisit / test drive prior to saleGroup’s ‘bricks and clicks’ strategy meets the needs of all these customersFull Year Results FY21
Digitalisation: Effortless Customer JourneysAwareness96% of used carcustomers wouldrecommend usCustomerOffer1.4m uniquewebsite visits permonthOnlineClick2Drive salestech platformFlexibleOnline orPhysical‘Bricks’ vital –aftersalesservice,testdrives anddeliveryConsideration14-day moneyBack guaranteeWebsearchVehiclesearchEnquire, phone,email or video22PurchaseHigh standardof vehiclepreparationFree deliverywithin 30-milesAdjust deal:Finance/Part exchangePersonalisedVideo & VideoCallsPaymentReserve ive90 ocumentsSignby textHomedeliveryCustomerfollow upInternet Enquiries141,498 12.5%SaledocumentsSignby textCollect orHomedeliveryCustomerfollow upPhone Enquiries65,238 9.7%PhysicalVisit dealerTotal annual enquiriesand like-for-like changeRetentionSaledocumentsSignby textCollectCustomerfollow upWalk-in todealerships74,343(54.3%)Full Year Results FY21
Vertu: Comprehensive Market Offering Brand LeadershipPure Ecom, omni-channel or physical retailIn-house vehicle refurbishmentFully digital finance and part-exchange processMarket leading NPS in used carsNational footprintTestdrive optionDelivery and collection in sales and servicePost sales servicing and repairsMonthly payment service plansNew and used vehicle supply from Manufacturers235 Star Google Reviews:Great experience buying new car. All done remotely over text, phone and email with Michael thesales person at the garage. We moved to a Leaf electric vehicle from a Micra and Michael wasgreat at making the whole process speedy and smooth. Loving the car so far - Michael talked usthrough many of the features available and offered ongoing help if needed.Full Year Results FY21
24Customer and Colleague Focus84% H2 NPS used car score(10,400 respondents)87% of colleagues believe Vertu Motors isa great place to work (FY20: 84%)Non-Executive forColleague EngagementRoot cause analysison any complaintsPauline Best - NED4.234,713 GooglereviewsRecognition64%Outlets above nationalaverage CSI (Service)Communication98%74%Outlets above nationalaverage CSI (Sales)Know the ValuesFull Year Results FY21
Aftersales: Inbuilt Resilience Generating 43% of Group Gross ProfitEstablished retentionstrategiesGross profit compositionParts21%New Cars18%25AccidentRepair5% Pre-paid service plansAdvanced contact centreand strategyDigital conqueststrategyService74%Aftersales43%Online service bookingsincreasingUsed Cars31%50.0%Aftersales Margin %49.0%49.3%48.0%49%47.0%46.0%46.9%Rising 2018FY2019FY2020FY2021Full Year Results FY21
Ancillary Businesses Independent online commercialvehicle retailerLeasing Broker Federation’s bestvan broker for the last four years2,682 vans sold in FY21,anincrease of 18% on FY20 Gross Profit margin 8.7% PBT of 1.4m26 Online parts and accessory sales Increased revenues of 8.8m(FY20 7.1m)Successful JV with HaymarketMedia Group Currently supply of leasing PCHenquiries to competitors fromwebsite FY22 strategy will switch to leadfulfilment and sales by the Groupdealerships Strong growth potential in carleasing market Sales via Marketplaces Bolt-on acquisitions identified PBT of 0.4m Gross margin 17.1%Full Year Results FY21
Current Trading and OutlookRobert Forrester CEOFull Year Results FY21
Current TradingMarch and April Performance28TotalLike-for-likeSMMT% Var% Var% VarGroup Revenues 152.8% 134.8%Service Revenues1 107.7% 91.8%Used Retail Vehicles 238.8% 215.9%New Retail Vehicles 59.1% 47.4% 41.8%Motability Vehicles 129.0% 122.8% 110.2%New Fleet Cars2 103.9% 112.3% 89.4%New Commercial Vehicles 167.5% 169.3% 157.4%Volumes March trading profit at record levels Strong April in sales due to pent up demand April service revenues impacted by anniversary of prior year lockdown with reduced annual service/MOT activity Combined March/April adjusted profit before tax of 19.2m (FY21 loss of 4.7m)1Service revenues include internal and external revenuesagency volumes2 IncludesFull Year Results FY21
Outlook29Near term outlook Pent-up vehicle demand apparentfollowing showrooms re-opening inApril 2021Covid-19 situation continues to beuncertain as we head into winterNew vehicle production constraintslikely driven by component supplychain disruption (semi-conductors)Vehicle sales margins likely to berobust given supply conditionsStrategic focus Focus on operational execution anddelivery of strategic goalsContinued digital developmentMarketing concentration on branddevelopment and lead optimisationContinue program on improvingrecent acquisitionsOpportunities for growth evidentFull Year Results FY21
Definitions of key terminology30Core:Dealerships that have traded for two full consecutive financial years and comparatives are restated each year, this definition is used for the profit bridgeLike-for-like:Dealerships that have comparable trading periods in two consecutive financial years, only the comparable period is measured as “like-for-like”FY2021:The twelve month period ending 28 February 2021FY2020:The twelve month period ended 29 February 2020H1 FY2021:The six month period ended 31 August 2020H1 FY2020:The six month period ended 31 August 2019Q1 FY2021:The three month period ended 31 May 2020Q1 FY2020:The three month period ended 31 May 2019H2 FY2021:The six month period ended 28 February 2021H2 FY2020:The six month period ended 29 February 2020Full Year Results FY21
Like-for-Like Sales o-Y% VarJun-FebY-o-Y% VarUsed retail %)New retail 8%)Motability 651,4844,2205,704(49.3%)(31.0%)Total fleet %)Commercial 6.6%Total New 4%)(9.4%)New retail car(60.5%)(11.2%)Motability(67.9%)4.8%Fleet car(69.3%)(17.5%)Commercial(65.7%)3.3%Direct fleet carsAgency fleet carsTotalUK Market (SMMT)Full Year Results FY21
New Retail Vehicle 1,4361,714Margin (Group) [1]7.6%7.7%7.4%7.4%7.1%7.4%6.7%7.9%Margin (Core Group) .4%)(8.9%)(4.2%)(5.5%)(40.2%)(15.2%)Selling price per unit [1] ( )Gross profit per unit [1] ( )Like-for-like unit (Retail)growth/(decline)UK private registrations [2]growth/(decline)Like-for-like unit % growthLike-for-like new retail unit growth/(decline) versus UK 0%5.7%(6.4%)(14.7%)(2.4%)(11.7%) (9.0%)(6.6%)H1 FY2018Includes Motability salesSMMT[2] Source(10.1%)(4.2%)(7.9%)(5.5%)(18.6%) (15.2%)(37.0%) (40.2%)H2 FY2018H1 FY2019H2 FY2019Like-for-like Retail[1](8.9%)H1 FY2020H2 FY2020H1 FY2021H2 FY2021UK Private RegistrationsFull Year Results FY21
Fleet and Commercial Vehicle 2.8%3.5%3.4%4.0%3.8%4.1%Like-for-like unit .6%18.2%(50.2%)(33.4%)UK car fleet )(10.2%)(1.3%)3.8%(50.6%)(15.8%)Like-for-like unit 5%)(38.8%)26.1%UK van commercial 1.2%12.4%(8.9%)(43.3%)12.6%Selling price per unit ( )Gross profit per unit ( )Margin (Group)[1]33Source SMMTFull Year Results FY21
Used Vehicle FY2020H1FY2021H2FY2021Selling price per unit ( ross profit per unit ( )1,1971,2781,2331,1821,1721,2441,3861,458Margin (Group)9.1%9.4%8.8%8.0%8.1%8.5%9.2%9.4%Margin (Core e unit )(15.6%)Monthly value movements in used vehicles at 3years 60k miles (source .0%)4.5GP 0%)(30.0%)(40.0%)(50.0%)(60.0%)(70.0%)(80.0%)Units /- %Like-for-like movement in used units and gross profitQ4UnitsFull Year Results FY21
Aftersales Trends35Parts andService Accident RepairCore GroupTotal ’000 ’000 ’000Revenue112,328129,433241,761Revenue[1] change(19,882)(38,125)(58,007)Like-for-like revenue[1] change(15.0%)(22.8%)(19.4%)Gross profit change(14,017)(8,012)(22,029)Gross margin[2] 202078.1%24.1%49.2%Gross margin[2] 201977.0%23.4%47.0%[1] Decline in service revenue (down 15.0% L4L) Core Group underlying service margins rose from 78.1% to 77.0%due to: Slower restart to parts and accident repairdue to fewer vehicle movements and therefore accidentsLike-for-like service revenue and gross profit growthQ1 – Q4 0.0%)(60.0%)(70.0%)9.7%(58.1%)(10.9%)(58.3%)Q2 FY21Revenue ( /- %)[2]3.8%(10.0%)Q1 FY21[1]Service revenue mix – Core Group12.4%1.1%Q3 FY21Gross Profit ( /- %)Includes internal and external revenueMargin in aftersales expressed on internal and external revenuehigher invoice valuesreduced warranty mixQ4 FY21FY2021 'mFY2020 Warranty13.318.9(29.6)Total Labour otal(15.0)Full Year Results FY21
Vehicle Volumes Sold36Like-for-like units soldTotal units sold65,847Used Retail84,771New Fleet &Agency CarNew CommercialNew MotabilityNew 01(22.3%)New Fleet &Agency Car(11.6%)New CommercialNew Motability(9.4%)New Retail(22.2%)130,208167,547 (22.3%)FY21FY20(26.6%)84,097(36.1%)Total Volumes61,710Used 01(42.1%)SMMT (34.9%)(11.6%)SMMT (19.2%)(16.1%)SMMT (16.7%)(28.9%) SMMT (29.3%)121,527Total Volumes166,432FY21(27.0%)FY20Full Year Results FY21
Dealership Portfolio37149 sales outletsVolume1449Premium779OtherMacklin MotorsVertuFarnellBristol Street enSEATSkodaKiaMazdaMitsubishiSuzukiTotal VolumeHondaVolkswagenLand RoverMercedes-BenzBMWMiniJaguarAudiToyotaJeepTotal PremiumHonda MotorcyclesBMW MotorcyclesVolkswagen Commercial VehiclesMercedes-Benz CommercialVehiclesOther Used Car OperationsTotal OtherTotal 149Bristol ll222111113221496555311141211227711141164999Full Year Results FY21
Disclaimer38This presentation contains forward looking statements. Although the Group believes that the estimates andassumptions on which such statements are based are reasonable, they are inherently uncertain and involve anumber of risks and uncertainties that are beyond the Group’s control.The Group does not make any representation or warranty that the results anticipated by such forward lookingstatements will be achieved and this presentation should not be relied upon as a guide to future performance.Full Year Results FY21
Training moved online Activity based costs reduced: Vehicle cleaning Energy Consumables . 22m (41%) of floating rate bank borrowing covered by interest rate hedges Full Year Results FY21 Net Debt. Capital Allocation Discipline 12 Full Year Results FY21 . Mercedes-Benz 5 123 4.1% 3.1% BMW 5 137 3.6% 2.8%1 Mazda 2 127 1. .