Transcription
COMPAS Risk Scales:DemonstratingAccuracy Equity and Predictive ParityPerformanceof the COMPAS Risk Scalesin Broward CountyNorthpointe Inc.Research DepartmentWilliam Dieterich, Ph.D.Christina Mendoza, M.S.Tim Brennan, Ph.D.July 8, 2016
ContentsTable of Contentsi1 Executive Summary12 Introduction2.1Northpointe’s Main Findings . . . . . . . . . . . . . . . . . .223 Results3.1ProPublica’s Broward County Samples . . . . . . . . . . . .3.2Overview of Classification Statistics . . . . . . . . . . . . . .3.3Accuracy Equity and Predictive Parity . . . . . . . . . . . .3.4Checking the Results of PP’s Survival and Logistic RegressionModels . . . . . . . . . . . . . . . . . . . . . . . . . . . . . .4469174 Conclusion20A Decision Tables and ROC Curves23B Statistical and Other Technical Errors in the ProPublicaArticle30C Glossary of Classification Terms32References36i
Chapter 1Executive SummaryThis research report presents Northpointe’s technical analysis of the BrowardCounty data that was used in ProPublica’s article “Machine Bias” publishedby ProPublica on May 23, 2016 (Angwin, Larson, Mattu, & Kirchner, 2016).We carefully examined the statistical methods in the article and conductedour own thorough analysis of the data that the ProPublica authors used fortheir study and made available through their web site.Based on our examination of the work of Angwin et al. and on results of ouranalysis of their data, we strongly reject the conclusion that the COMPASrisk scales are racially biased against blacks. This report presents evidencethat refutes the claim that the COMPAS risk scales were biased against blackdefendants in a sample of pretrial defendants in Broward County, Florida.Our review leads us to believe that ProPublica made several statistical andtechnical errors such as misspecified regression models, wrongly defined classification terms and measures of discrimination, and the incorrect interpretationand use of model errors. ProPublica focused on classification statistics that did not take into account the different base rates of recidivism for blacks and whites. Theiruse of these statistics resulted in false assertions in their article that wererepeated subsequently in interviews and in articles in the national media. When the correct classification statistics are used, the data do not substantiate the ProPublica claim of racial bias towards blacks. The proper interpretation of the results in the samples used by ProPublica demonstrates that the General Recidivism Risk Scale (GRRS) andViolent Recidivism Risk Scale (VRRS) are equally accurate for blacksand whites.1
Chapter 2IntroductionWe carefully reviewed the statistical methods in the ProPublica (PP) articleand conducted our own thorough analysis of the Broward County data thatthey used for their study and made available through their web site.Based on our careful review and on results of our analyses, we strongly reject their conclusion that the COMPAS risk scales are racially biased againstblacks. We present evidence that thoroughly refutes PP’s conclusion.2.1Northpointe’s Main Findings Angwin et al. used the incorrect classification statistics to frame theCOMPAS risk scales as biased against blacks. They compared the complements of Sensitivity and Specificity for blacks and whites. These areoperating characteristics calculated separately on recidivists only andnon-recidivists only. They should have used the complements of thepredictive values that take into account the base rate of recidivism. Intheir main table, the PP authors misrepresented the percentage of nonrecidivists with a positive test result (“Not Low” risk level) as the percentage of persons with a positive test result that did not recidivate (“LabeledHigher Risk, But Didn’t Re-Offend”). If the correct classification statistics are used, then the PP authors’ claimof racial bias is not supported. In comparison with whites, a slightlylower percentage of blacks were “Labeled Higher Risk, But Didn’t ReOffend” (37% vs. 41%). In comparison with whites, a slightly higherpercentage of blacks were “Labeled Lower Risk, Yet Did Re-Offend” (35%vs. 29%). Thus the claim of racial bias against blacks is refuted. Theresults demonstrate predictive parity for blacks and whites at the study2
3cut point used by Angwin et al. (“Low” vs. “Not Low”) and at alternativecut points (“Not High” vs. “High”). AUC results in the PP study samples demonstrate that the General Recidivism Risk Scale (GRRS) and Violent Recidivism Risk Scale (VRRS)are equally accurate for blacks and whites (equal discriminative ability).Thus the risk scales exhibit accuracy equity. The AUC for the GRRSdecile score predicting any arrest in PP’s main sample is 0.69 (0.68, 0.71)for blacks and 0.69 (0.67, 0.71) for whites. The AUC in the overall sample is 0.70 (0.69, 0.71). The AUC for the VRRS decile score predictingany violent arrest in PP’s main sample is 0.67 (0.64, 0.69) for blacks and0.66 (0.62, 0.70) for whites. The AUC in the overall sample is 0.68 (0.66,0.70). 2016 Northpointe Inc., All Rights Reserved.
Chapter 3Results3.1ProPublica’s Broward County SamplesIn their article Angwin et al. present results from analyses conducted in threedifferent samples. Sample A consists of pretrial defendants with complete caserecords who have at least two years of follow-up time. The PP authors useSample A to fit reverse logistic regressions predicting the “Not Low” Risk Level.Subsets of Sample A are used for tests of the GRRS (n 6,172) and the VRRS(n 4,020). Sample B consists of pretrial defendants with at least two yearsof follow-up and possibly incomplete case records. Sample B is used by PPto calculate the classification contingency tables from which they derive themain study results for false positive rates (fpr) and false negative rates (fnr).The PP authors use subsets of Sample B for tests of the GRRS (n 7,214) andthe VRRS (n 6,454). Sample C consists of 10,994 pretrial defendants withvarying follow-up times (1 to 1,186 days) and possibly incomplete case records,that is used to fit Cox survival models. The study data are available on theProPublica web site, along with the annotated code necessary to construct thestudy data frames and reproduce the analyses and verify the results presentedin the ProPublica article.When reporting study results it is standard practice to describe the study sample in terms of characteristics that are key to the interpretation of the findings.Differences in the risk scores for blacks and whites are at the heart of the PPauthors’ claim that the risk scales are biased against blacks. Unfortunately,they did not provide descriptive statistics for blacks and whites for any of thesamples that they used. Descriptive statistics for criminal history would havehelped to explain why the risk scale scores of whites were shifted so muchlower than blacks. They did provide plots showing the number of defendantsdistributed across the decile score levels of the GRRS and VRRS for blacks4
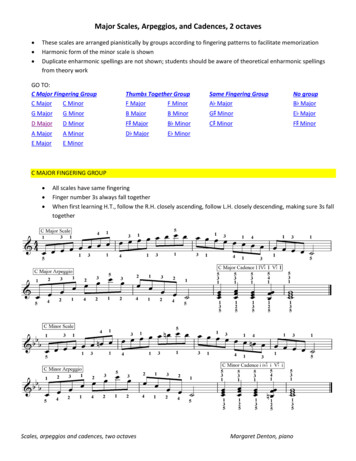
5and whites in the main sample (Sample B). Figure 3.1 displays bar plots of thepercentage of defendants in the decile score levels of each risk scale by race.We reproduce the bar plots to point out that the decile scores of blacks havea better distribution in comparison with whites. The bar plots show that theGRRS decile scores of blacks are well-aligned with the norm group that is usedin Broward County (close to 10% fall into each decile score level). The GRRSdecile score distribution of white defendants on the other hand is shifted muchlower relative to the norm. The distribution of the VRRS decile scores forblack defendants is also better aligned with the norm group in comparison towhite defendants. The distributions of whites are shifted lower because theyhave lower values on the inputs of the risk scales.BlackWhite50%40%General Recidivism Risk30%20%Percent10%0%50%40%Violent Recidivism Risk30%20%10%0%1234567891012345678910Decile ScoreFigure 3.1: Percentage of defendants in the Decile Score Levels of Each RiskScale by Race.The inputs (risk factors) for the GRRS are the Criminal Involvement Scale,drug problems sub-scale, age at assessment, age at first adjudication, numberof prior arrests, arrest rate, and the Vocational Educational Scale. The inputs(risk factors) for the VRRS are age at assessment, age at first adjudication,the History of Violence Scale, the History of Noncompliance Scale, and the 2016 Northpointe Inc., All Rights Reserved.
6Vocational Educational Scale. The inputs for the GRRS and VRRS were notincluded in the study data sets that PP made available on their web site.PP did include age and number of prior arrests in the data they posted. Wecan compare blacks and whites in Sample B on these two factors. The whitesample has less criminal history. The mean number of prior arrests is lowerfor whites (M 2.6, SD 3.8) compared with blacks (M 4.4, SD 5.6). Thewhite sample is older on average. The mean age at assessment is higher forwhites (M 37.7, SD 12.8) compared with blacks (M 32.7, SD 10.9).We also point out that in comparison with blacks, whites have much lowerbase rates of general recidivism (0.39 vs. 0.51) and violent recidivism (0.09 vs.0.14) in Sample B. The risk scores of whites should be shifted lower if the riskscales are valid predictors of recidivism.3.2Overview of Classification StatisticsIn this section we provide an overview of classification statistics. The overviewis necessary to understand the flaws in PP’s analysis and interpretation ofresults. The material is unavoidably technical.Types of Classification StatisticsBefore being put into practice, a risk scale is often cut into levels, for example,Low, Medium, and High. This requires two thresholds that are then used fordecision making. For instance, persons scoring above the High-Risk threshold are targeted for a more intensive treatment program. Making decisions atthresholds of the risk scale is a type of classification. A study is usually conducted to evaluate the intrinsic accuracy of the classifier and the performanceof the classifier in practice.There are two main types of classification statistics reported in the PP article:1) Model Errors and 2) Target Population Errors. The PP article primarilyfocuses on Model Errors and presents these as evidence of racial bias. TargetPopulation Errors are what should be analyzed if one is interested in testing forracial bias, but these are mostly ignored by the PP authors. To understand themistakes that the PP authors made, it is necessary to briefly define these twotypes of classification errors. Full definitions of these and other classificationterms are provided in appendix C. 2016 Northpointe Inc., All Rights Reserved.
7Model ErrorsThe Sensitivity of the classifier is the percentage of recidivists correctly classified as recidivists. It is calculated on recidivists only.The Specificity of the classifier is the percentage of non-recidivists correctlyclassified as non-recidivists. It is calculated on non-recidivists only.The complement of Sensitivity is the false negative rate which is the percentageof recidivists misclassified as non-recidivists. The complement of Specificity isthe false positive rate which is the percentage of non-recidivists misclassifiedas recidivists. These are the Model Errors that PP used as evidence of racialbias.Sensitivity and Specificity quantify the accuracy of the risk scale. These classification statistics are useful for summarizing the accuracy of a risk scale. Forinstance they are used to describe the receiver operating characteristic (ROC)curve to estimate the area under the curve (AUC), one of the most widelyused measures of diagnostic accuracy. The Receiver Operating Characteristic(ROC) method and the area under the ROC curve (AUC) are explained in theappendix C.Angwin et al. could have properly used the operating characteristics as evidence of accuracy. But PP ignored and obfuscated the evidence that showedthe AUCs obtained for the risk scales were the same, and thus equitable, forblacks and whites. A summary and discussion of our AUC results can be foundin section 3.3.Instead, the PP authors misused the operating characteristics as evidence ofracial bias. They were wrong in doing that. Model Errors are of no practicaluse to a practitioner in a criminal justice agency who is assessing an offender’sprobability of recidivating. The practitioner does not know at the time ofthe assessment if the offender is a recidivist or not. Model Errors cannot bedirectly applied to an offender at the time of assessment (see Linn, 2004, forexample).It is unrealistic to expect equal Model Error trade-offs at a particular cut pointin two samples that have different risk score distributions and base rates ofrecidivism. Although Sensitivity and Specificity do not depend on the base rateof recidivism, because they are calculated separately on recidivists and nonrecidivists, the trade-offs between Sensitivity and Specificity can be impactedby the base rate. Leeflang, Rutjes, Reitsma, Hooft, and Bossuyt (2013), usingdata from 23 meta-analyses to assess the effect of base rate (prevalence) onSensitivity and Specificity, found that Specificity decreased as disease base rateincreased. In other words the false positive rate increased with increasing baserate. Differences in the base rates of blacks and whites for general recidivism 2016 Northpointe Inc., All Rights Reserved.
8(0.51 vs. 0.39) and violent recidivism (0.14 vs. 0.09) in the PP samples stronglyaffected the Sensitivity and Specificity tradeoffs observed in the PP study.We have conducted our own simulation analyses to assess the effects of differences in the risk scale distribution and base rate on the false positive and falsenegative rates. Results of our analyses indicate that as the mean difference inscores between a low-scoring group and a high-scoring group is increased, thebase rates diverge and higher false positive rates and lower false negative ratesare obtained for the high-scoring group. This is the same pattern of resultsreported by Angwin et al. This pattern does not show evidence of bias, butrather is a natural consequence of using unbiased scoring rules for groups thathappen to have different distributions of scores. These results help to explainthe effects of the relatively higher risk scores and higher base rates of blackson the false positive and false negative rates in the PP study. These resultsalso make clear that it is not proper to make an assessment of racial bias onthe basis of Model Errors obtained from the ROC method and detached fromthe base rate of deployment.Target Population ErrorsThe whole purpose of administering a risk scale is to use the results to assessa person’s risk of re-offending at the time of assessment in a particular agency.As discussed above the operating characteristics are not useful for this purpose.The useful classification statistic for this purpose is the predictive value. ThePositive Predictive Value (PV ) is the probability that a person with a positivetest result (“Not Low” risk score) will recidivate. The Negative Predictive Value(PV-) is the probability that a person with a negative test result (“Low” riskscore) will not recidivate. Sensitivity and Specificity quantify the accuracy ofthe risk scale and the predictive value quantifies its clinical value (Pepe, 2003).A useful prediction will have a PV that is greater than the base rate and aPV- that is greater than 1 minus the base rate. A perfect test will predict theoutcome perfectly with PV 1 and PV- 1. The predictive values dependon the accuracy of the test and the base rate of failure.The complement of the PV (1 - PV ) is the probability of not recidivatinggiven a positive test result (“Not Low” risk score). The complement of the PV(1 - PV-) is the probability of recidivating given a negative test result (“Low”risk score). These are the Target Population Errors that should be examined ifone is interested in determining if the risk scales perform differently for blacksand whites. 2016 Northpointe Inc., All Rights Reserved.
9Impact of PP’s Study Cut Point on the Classification ErrorsAngwin et al. chose to conduct their analyses of classification errors at a cutpoint on the decile score that yields higher Model Errors and Target Population Errors. They combined the High and Medium levels and refer to thislevel in their article as “Higher Risk.” Thus, their analysis of classification errors is for the Low cut point. This has the effect of inflating the false positiverate (fpr) and the corresponding base-rate-sensitive Target Population Error(1-PV ). They justify the decision to examine the Low threshold by pointing to a sentence in the Practitioner’s Guide to COMPAS Core (NorthpointeInc., 2015b) which states that “scores in the medium and high range garnermore interest from supervision agencies than low scores, as a low score wouldsuggest there is little risk of general recidivism.” More definitive guidance onthe interpretation of decile scores is provided in Measurement and TreatmentImplications for COMPAS Core which states that “Decile scores 1-4 may beregarded as Low Risk since they are clearly lower than “average.” Decile Scoresfrom 5-7 may be regarded as Medium Risk since they are in the middle of thedistribution and represent cases that are very close to “average” for the totalpopulation of the agency. Decile Scores of 8 and above may be regarded asHigh Risk since they are in the top third of the distribution” (Northpointe Inc.,2015a). In this report we refer to the two levels examined by the PP authorsas “Low” and “Not Low.”3.3Accuracy Equity and Predictive ParityA risk scale exhibits accuracy equity if it can discriminate recidivists and nonrecidivists equally well for two different groups such as blacks and whites. Therisk scale exhibits predictive parity if the classifier obtains similar predictivevalues for two different groups such as blacks and whites, for example, the probability of recidivating, given a high risk score, is similar for blacks and whites.The interpretation of relative predictive values is discussed in Appendix A.Angwin et al. base their assessment of racial bias on an unrealistic criterion.Their requirement that the risk scale classification obtains the same Sensitivityand Specificity for blacks and whites at a particular cut point is unrealisticbecause the two groups have different risk scale distributions and differentbase rates. The PP authors ignore evidence of accuracy equity and predictiveparity of the COMPAS risk scales.AUC results in the PP samples demonstrate that the General and Violentrecidivism risk scales are equally accurate for blacks and whites.1 The AUC1Accuracy refers to how accurately the risk scale discriminates between non-recidivists 2016 Northpointe Inc., All Rights Reserved.
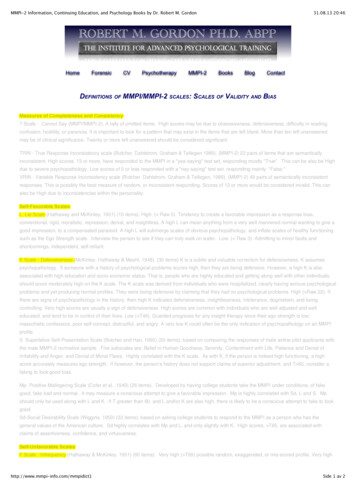
10results are in section 3.3. Thus the risk scales exhibit accuracy equity. Theresults indicate that blacks and whites obtain similar positive and negativepredictive values using a classifier based on the study cut point (“Low” vs.”Not Low”) and alternative cut points (“Not High” vs. “High”). Thus the riskscale classifiers exhibit predictive parity for blacks and whites.Demonstrating the Predictive Parity of the COMPASRisk ScalesGeneral Recidivism Risk Scale Classification ResultsIn their article Angwin et al. note that blacks have a much higher false positiverate (fpr) compared with whites and that whites have a much higher falsenegative rate (fnr) compared with blacks. They report that the fpr is 44.9% forblacks and 23.5% for whites. They also report that the fnr is 47.7% for whitesand 28.0% for blacks. The PP authors interpretation of these classificationerrors is incorrect. The rates that they report are actually Model Errors thatignore the base rate of recidivism in the Broward County population. The PPauthors misrepresents these Model Errors (operating characteristics) as if theyare the Target Population Errors (predictive values) that would be obtained inthe Broward County population using the base rates of recidivism in BrowardCounty.Figure 3.2 is a screenshot of the table of model errors that the PP authors presented under the caption “Prediction Fails Differently for Black Defendants.”In the table, they incorrectly report the proportion of non-recidivists that havea “Not Low” risk score in the row named “Labeled Higher Risk, But Didn’t ReOffend” and incorrectly report the proportion of recidivists that have a “Low”risk score in the row named “Labeled Lower Risk, Yet Did Re-Offend.” Thusthe row names refer to the Target Population Errors that take into account thebase rates of recidivism for blacks and whites, but the numbers are actually theModel Errors that are calculated separately for recidivists and non-recidivistsand that ignore the base rates for blacks and whites. As discussed above, it isnot appropriate to compare the Model Errors of blacks and whites.Table 3.1 is a corrected version of the table that PP presented under theheading “Prediction Fails Differently for Black Defendants.” We have addedthe correct Target Population Errors (predictive values) that take into accountthe base rates for blacks and whites. Recall that the complement of the PositivePredictive Value (1 - PV ) is the probability of not recidivating given a positiveand recidivists. The AUC is a rank-based measure of discriminative ability not a measureof accuracy. 2016 Northpointe Inc., All Rights Reserved.
11Figure 3.2: Screen shot of Propublica’s table that incorrectly reports modelerrors at the study cut point (Low vs. Not Low) for the General RecidivismRisk Scale as if they are target population errors.test result. The complement of the Negative Predictive Value (1 - PV-) is theprobability of recidivating given a negative test result.Now the numbers correctly correspond with the row names in PP’s table.The results actually indicate that in comparison with whites a slightly lowerpercentage of blacks were “Labeled Higher Risk, But Didn’t Re-Offend” (37%vs. 41%). The results also show that in comparison with whites, only aslightly higher percentage of blacks were “Labeled Lower Risk, Yet Did ReOffend” (35% vs. 29%). Thus we conclude that the General Recidivism RiskScale exhibits predictive parity for blacks and whites. This result refutes PP’sclaim of racial bias. Appendix A includes supplemental results including theclassification statistics across all the decile scores.WhiteLabeled Higher Risk, But Didn’t Re-OffendLabeled Lower Risk, Yet Did Re-OffendAfrican American41%29%37%35%Table 3.1: Propublica’s table with correct target population errors at the studycut point (Low vs. Not Low) for the General Recidivism Risk Scale.Violent Recidivism Risk Scale Classification ResultsAngwin et al. did not present a table of the Model Errors for the Violent Recidivism Risk Scale. But they did report the Model Errors and the predictive 2016 Northpointe Inc., All Rights Reserved.
12values for the Violent Recidivism Risk Scale. As we did with the General Recidivism Risk Scale classifier (“Low” vs. “Not Low”), we calculate the complements of the predictive values and table the correct Target Population Errors.Table 3.2 shows the Target Population Errors for the Violent Recidivism RiskScale.WhiteLabeled Higher Risk, But Didn’t Re-OffendLabeled Lower Risk, Yet Did Re-Offend83%7%African American79%9%Table 3.2: Target population errors at the study cut point (Low vs. Not Low)for the Violent Recidivism Risk Scale.The results show that the percentage of blacks who were “Labeled HigherRisk, But Didn’t Re-Offend” is slightly lower than the percentage of whiteswho were “Labeled Higher Risk, But Didn’t Re-Offend” (79% vs. 83%). Notethat these Target Population Errors are quite high. This is an example of thefalse positive paradox. This is a classification result obtained for a test appliedto a low base rate outcome where the probability of a False Positive (1-PV )is high even though the test is accurate. The result goes against our intuitionthat tells us the probability of a False Positive (1-PV ) should be lower whenthe base rate of recidivism is lower. But in practice, for a given risk scale,we find that the lower the base rate of recidivism in the population, the morelikely it is that an offender predicted to recidivate will not recidivate.The results in Table 3.2 also show that the percentage of blacks who were“Labeled Lower Risk, Yet Did Re-Offend” is only slightly higher than thepercentage of whites who were “Labeled Lower Risk, Yet Did Re-Offend” (9%vs. 7%). Thus we conclude that the Violent Recidivism Risk Scale exhibitspredictive parity for blacks and whites. This result refutes the PP authors’claim of racial bias.Angwin et al. state in the main part of their article that the Violent RecidivismRisk Scale was “remarkably unreliable in forecasting violent crime.” They notethat “Only 20 percent of the people predicted to commit violent crimes actuallywent on to do so.” They are referring to the positive predictive value. Whatthey don’t mention is that the base rate in the sample overall is only 11%.If the Positive Predictive Value is greater than the base rate, then the riskscale has clinical value. The Positive Predictive Value at the study cut point(“Low” vs. “Not Low”) is 21% which is about twice the base rate. The PPauthors are committing the base rate fallacy. This is an error in judgementabout the probability of an event. The error occurs when information aboutthe base rate of an event (e.g. low base rate of recidivism in a population) isignored or not given enough weight (Kahneman & Tversky, 1982). There is 2016 Northpointe Inc., All Rights Reserved.
13actually nothing remarkable about the positive predictive value pointed outby the PP authors. Appendix A includes the complete decision table acrossall the Violent Recidivism Risk Scale decile scores.A more common version of the base rate fallacy was committed by the PPauthors when they presented the Model Errors as if they were the TargetPopulation Errors in their article. In fact, the way in which this fallacy isused by the authors to draw a controversial conclusion probably makes it oneof the more stunning examples of the base rate fallacy in the literature.Demonstrating the Accuracy Equity of the COMPASRisk ScalesA risk scale exhibits accuracy equity if it can discriminate recidivists and nonrecidivists equally well for two different groups such as blacks and whites.The most well-developed and widely used measure of discriminative ability isthe area under the receiver operating characteristic (ROC) curve (AUC). TheROC curve is a plot of Sensitivity (tpr) and Specificity (tnr) for all possiblecut points of a risk scale. The AUC is a summary measure of discriminativeability (diagnostic accuracy) across all the thresholds of the risk scale. TheAUC is interpreted as the probability that a randomly selected recidivist willhave a higher risk score than a randomly selected non-recidivist.Angwin et al. downplayed results that indicated the AUCs were the same forblacks and whites. They focused on the operating characteristics at one pointon the ROC curve. Their study cut point is a decile score greater than orequal to 5 (“Low” vs. “Not Low”). The PP authors misinterpreted these ModelErrors (fnr, fpr) as if they were the Target Population Errors (1-PV-, 1-PV ).A proper interpretation of the operating characteristics obtained at the studycut point is provided in Appendix A.The performance of the risk scale depends on its intrinsic accuracy as wellas external factors such as base rate and user preferences about the costs oferrors, benefits of treatment, selection ratio, and other criteria. The fact thatthe accuracy of the risk scale is the same for blacks and whites is critical. Ifthe AUCs were not the same for blacks and whites, then the performance ofthe risk scales would not be similar for blacks and whites. Performance refersto the positive and negative predictive values and their complements that takeinto account the base rates for blacks and whites.It appears that Angwin et al. selected certain combinations of methods andsamples to obtain results that best supported their claims of racial bias. Forexample PP calculated the concordance index (c-index) for the three risk levels (Low, Medium, High) in the survival sample (Sample C ) as opposed to 2016 Northpointe Inc., All Rights Reserved.
14calculating the area under the receiver operating characteristic curve (AUC)for the decile score in the classification contingency table sample (Sample B ).The c-index is a generalization of the AUC used to measure the discriminativeability of a risk scale in survival data. The c-index is described in the glossary in Appendix C. The PP authors claim that they use the c-index becausethat measure of discrimination was used in a 2008 paper that examined thepredictive validity of the COMPAS risk scales (Brennan, Dieterich, & Ehret,2009).It is hard to understand why Angwin et al. did not report the AUC for thedecile score in Sample B in which they calculate the false negative rate (fnr)and false positive rate (fpr) that they use to support the central claim of theirarticle. The most amplified result in their article was the finding of a higher fprfor blacks. The fpr was calculated in Sample B. The fpr and other model errorsthat they report are derived using receiver operating characteristic methods.Instead they report the c-index estimates in Sample C (survival sample). PPtakes this approach despite the fact that the fpr and fnr cannot be calculatedfrom the Cox survival model that they used. There is nothing wrong with usingthe c-index. In fact, for binary outcomes data without censoring such as usedwith logistic regression, the c-index and AUC are equivalent. In survival datawith right censoring, the c-index is dependent on the pattern of censoring.The issues
2.1 Northpointe's Main Findings Angwin et al.used the incorrect classi cation statistics to frame the COMPAS risk scales as biased against blacks. They compared the com-plements of Sensitivity and Speci city for blacks and whites. These are operating characteristics calculated separately on recidivists only and non-recidivists only.