Transcription
Private Equity Practice2021North American Private EquityInvestment ProfessionalCompensation Survey
Document title2
Heidrick & StrugglesContentsA message from the authors4Methodology5Executive summary6State of the private equity market7Hiring trends7Compensation trends8State of investment professional compensation12Non-cash compensation37Comparisons of compensation by regions, education, and experience 403
2021 North American Private Equity Investment Professional Compensation SurveyA message from the authorsWelcome to our 2021 North American Private Equity Investment Professional CompensationSurvey. Together with our survey of private equity operating professionals (coming later thisyear), this report provides a comprehensive picture of the compensation that North Americanprivate equity executives are currently receiving.For this report, Heidrick & Struggles compiled compensation data from a survey of 1011investment professionals in North America. This year we added to the range of topicson compensation and executives’ backgrounds we explore and looked at compensationfor women and people of color.We hope you enjoy reading the survey, which remains the only one of its kind.As always, suggestions are welcome, so please feel free to contact us—or yourHeidrick & Struggles representative—with questions and comments.With warmest regards,Jonathan GoldsteinRegional Managing Partner, AmericasPrivate Equity PracticeJohn RubinettiPrincipalPrivate Equity .comOn confidentialityThe North America private equity compensation survey, 2021, was been conductedon an anonymous basis for individuals and their employers, and Heidrick & Struggleshas removed the data relating to identity from reported compensation figures.AcknowledgmentsThe authors wish to thank Mohd Arsalan and Daria Sklyarova for theircontributions to this report.4
Heidrick & StrugglesMethodologyIn an online survey, we asked participants toprovide compensation data from 2019, 2020,and 2021. All data collected is self-reportedby private equity investment professionalsand has been aggregated to evaluate trendsin compensation packages, including basesalary, bonus, and carried interest plans (carry).Responses from 1011 participants areincluded in the survey results.In each compensation table, we reportthe lowest response, lower quartile (25thpercentile), mean, upper quartile (75thpercentile), and highest response. Please notethat the mean can be influenced by particularlyhigh or low data points, especially in smallA note on titlesWhile title structures vary according to firm,we have divided respondents into five groupsbased on level and responsibility.sample sizes. Many firms that use compensationsurveys set their compensation targets aroundor above the upper quartile (75th percentile).Carried interest is calculated using “carry dollarsat work”—the expected return on total carryparticipation across all vehicles, based onachieving a net 2x return (above hurdle and afterfees) in a vehicle charging a 20% performancefee. For example, 7 points (700 bps) of carry(out of a possible 100) in a 500 million fundwith 20% carry would result in 7 million ofcarry dollars at work (500 X 0.2 X 0.07 7).All compensation figures in tables andcharts are reported in USD thousandsunless otherwise noted.Managing partnerMost senior level at the firm. Typically, althoughnot always, one of the founders.Partner/managing directorProven investment track record. Experienceddeal maker and board member.PrincipalInvestment professional with early experienceoriginating and leading their own investments.Accomplished executor with experience onboard of directors. Leads and manages deals forthe firm. Personal track record not yet extensive.Vice presidentDeal “quarterback.” Responsible for high-levelcompany and business plan analysis. Leadsdue diligence and manages service providersand financing. Develops proprietary networkof contacts for due diligence and deal-flowgeneration. Works closely with the portfolio andmight have board exposure or a board seat.Associate/senior associateResponsible for analyzing companies andbusiness plans, conducting due diligence,and working with service providers under thedirection of the vice president.5
2021 North American Private Equity Investment Professional Compensation SurveyExecutive summaryThis year’s survey includes a review of 2020 and year-to-date 2021 activity in NorthAmerican private equity (PE), our thoughts on the major hiring trends for investmentprofessionals, and an exploration of the composition of 2020 compensation packagesfor investment professionals, including analysis by gender and ethnicity.Private equity: The big pictureInvestment professionals: Hiring trends After being upended by the COVID-19 pandemic, the USprivate equity market finished 2020 strong. Deals and totalvalue were off their 2019 levels, but above their 2018 levels. After a COVID-19 slowdown, hiring returned to its 2019 levelsby the end of 2020, and momentum is continuing in 2021. Exit activity dipped and then rebounded,although exit timeframes were extended. Fundraising slipped because of the pandemic, but the impactwas lessened by the fact that PE had begun 2020 with veryhigh levels of dry powder: at the end of Q1 2020, there wasmore than 550 billion that was less than two years old. There are multiple signs that PE activity is returning to growthin 2021. GPs are sensing opportunity in retail and hospitality,there were some large carve-outs and take-private transactionsannounced in Q1, and Q1 exit activity was robust. The shift to remote work has opened opportunities in new locations. While there continues to be demand for managing directors andpartners, the hiring focus has shifted to vice presidents and principals,likely to fill out teams after an earlier surge in more senior hires. Demand for operating partners has also been very active. Firms must move quickly with the right offer or loseout, particularly with diverse candidates.Page 7Page 7Investment professionals: Compensation trendsCarried interest provisions Despite many people working in remote, low-tax locations,compensation has not decreased: slightly more thanhalf of all respondents (56.7%) reported an increase inbase last year, and 54% expect an increase this year;with most (76%) seeing increases of 20% or less. Almost all investment professionals at more senior levels reportedreceiving carry, but it remains uncommon at the associate/seniorassociate level. Bonuses remained strong, although fewerrespondents reported an increase last year: 67% sawan increase in 2020, down from 77% for 2019. Growing demand for female and diverse candidatescould be a pathway toward pay equity.Page 12Co-investment eligibility and rights As in past years, almost all investment professionals have coinvestment eligibility. Co-investment was fund-based for 56% ormore of respondents at each level in 2020, about the same as 2019. A smaller percentage, generally 10% to 16% for seniorlevel professionals, is deal-based. The percentageof deal-based co-investment eligibility is highest(40%) among associates/senior associates.Page 396 When carry vests on a fund basis, it takes an averageof six years to fully vest. When carry vests on a dealby-deal basis, it takes an average of four years.Page 37
Heidrick & StrugglesState of the privateequity marketAfter a promising start to 2020, the earlymonths of the COVID-19 pandemic upendedthe global economy and PE dealmakingalong with it. Yet, by the end of the year,sponsors were actively putting capital towork again in minority transactions, publiccompanies, and add-on acquisitions—oftenin the healthcare and technology sectors thatwere the focus of so much other attentionbecause of the pandemic. Growth equityreached the highest deal value on record.When the dust settled, Pitchbook counted5,309 deals closed for a combined value of 708.4 billion, both off their 2019 levels.1 Thiswas the first decline in both deal-making valueand count since 2009, but both remainedabove the 2017 level. Exit activity dipped andthen rebounded, although exit timeframeswere extended. Fundraising also slippedbecause of the pandemic, but the impact waslessened by the fact that PE had begun 2020with very high levels of dry powder: at theend of Q1 2020, there was more than 550billion that was less than two years old.There are multiple signs that PE activityis returning to growth in 2021:After being upended by the COVID-19pandemic, the US private equitymarket finished 2020 strong. Dealsand total value were off their 2019levels, but above their 2017 levels. GPs are sensing opportunityin retail and hospitality. There were some large carve-outs andtake-private transactions announced in Q1. Several PE firms have launched a specialpurpose acquisition company (SPAC). PE firms have pursued private investmentin public equity (PIPE) deals. Q1 exit activity has been robust. Hiring has also been robust.1 2020 Annual US PE Breakdown, Pitchbook, January 11, 2021, pitchbook.com.Hiring trendsDespite fears of a very slow marketbecause of COVID-19, hiring returned toits 2019 levels by the end of 2020 andmomentum is continuing in 2021.Private equity firms have been adding staffat all levels, but we did observe a shift in2020: while there was substantial hiringfor investment partners and managingdirectors two years ago, the focus shifted tovice presidents and principals. Demand foroperating partners has also been very activeand it is not improbable that, at some point,the numbers of operating partners will beequal to those of investment professionals.Firms seeking to hire leading candidatesmust move quickly on their prospectswith the right offer or risk losing them tocompetitors. Top candidates consistentlyhave at least two other offers in front of them,and sometimes more—and the competitionis even fiercer for diverse candidates.Firms must move quickly with theright offer or lose out, particularlywith diverse candidates.The shift to remote work during the pandemicresulted in many PE professionals workingaway from traditional East or West Coastlocations, and that shift is affecting hiring.Many professionals want to move permanentlyto locations with lower taxes, particularly theSoutheast and Southwest, and some firmsare opening offices in those areas, which isalso creating opportunities for professionalswho had been living and working outsidemajor PE hubs and did not want to relocate.7
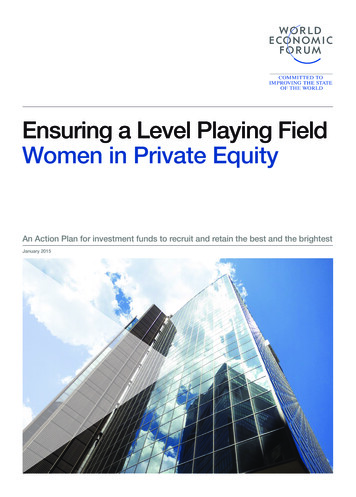
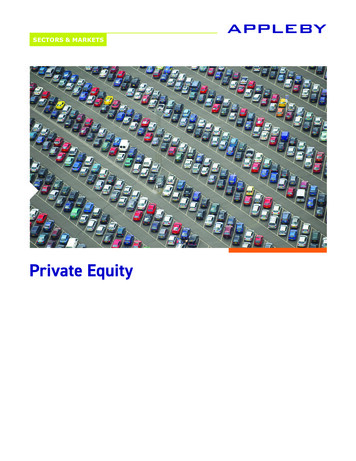
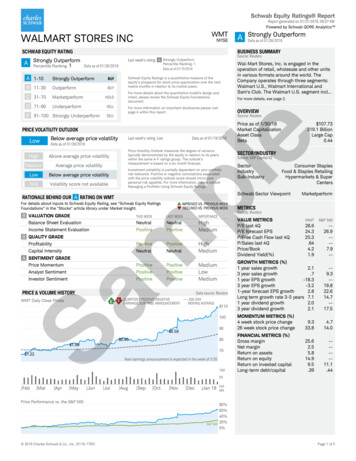
2021 North American Private Equity Investment Professional Compensation SurveyCompensation trendsWhile some industries have reduced thecompensation of people who have chosento work remotely from lower-tax areas, thathas not been the case in PE: compensationremained strong during the pandemic.Slightly more than half of all respondentsto this year’s survey (56.7%) reportedan increase in base in 2020 from 2019,and 54% expect an increase in 2021.General observations on compensation trends (%)IncreaseNo changeDecreaseBase 2020 vs. 2019Base 2021 vs. 2020114257845Breakdown of respondents reporting an increase in 2021 base (%)39Bonus 2020 vs. 2019542567Breakdown of respondents reporting an increase in 2020 bonus ��50%increaseMore than 50%increaseSource: Heidrick & Struggles’ North America private equity compensation survey, 2021, n 1003 investment 50%increaseMore than 50%increase
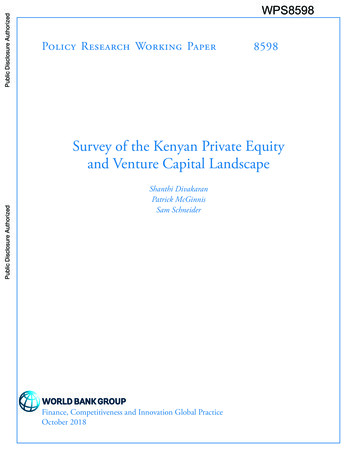
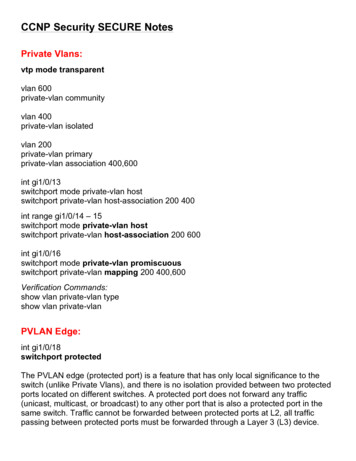
Heidrick & StrugglesBonus plan (%)Bonuses remained strong, although slightlyfewer respondents reported an increase intheir bonus: 67% saw an increase in 2020,down from 77% in 2019. Most 2020 bonusesincreased between 11% and 50%. A majority ofbonuses are to some extent discretionary, and55% are entirely discretionary. Of those that areformulaic, individual performance is a biggerdeterminant than fund/team performanceor firm performance. Most bonuses are paidin January (20.8%) or December (42.9%).DiscretionaryDiscretionary (71%)FormulaicFormulaic (15%)565533322519675EntirelydiscretionaryBased onindividualperformanceBased on firmperformance8Based onfund/teamperformanceBased onindividualperformanceBased on firmperformanceBased onfund/teamperformanceSource: Heidrick & Struggles’ North America private equity compensation survey, 2021, n 925 investment professionalsBonus payout by month yAugust11SeptemberOctober0NovemberDecemberNote: Numbers may not sum to 100%, because of rounding.Source: Heidrick & Struggles’ North America private equity compensation survey, 2021, n 926 investment professionals9
2021 North American Private Equity Investment Professional Compensation SurveyMean total cash compensation by AUM (USD, thousands)Associate/seniorassociateVice partnerTotal cash compensation: base 2020 bonus 2020 3,086 2,669 2455 1,907 1,392 915 845 471 177 592 203Less than 500.00m 608 500 461 266 998 885 304 211 249 500.00m– 999.00m 609 410 260 249 1.00bn– 1.99bn 2.00bn– 3.99bn 4.00bn– 5.99bn 3,300 1,660 1,642 1,474 1,334 895 752 336 299 262N/AN/A 10.00bn– 19.99bn 20.00bn– 39.99bnSource: Heidrick & Struggles’ North America private equity compensation survey, 2021, n 1,003 investment professionals10 568 510 497 457 284 6.00bn– 9.99bn 873 741N/A 40.00bn or more 409
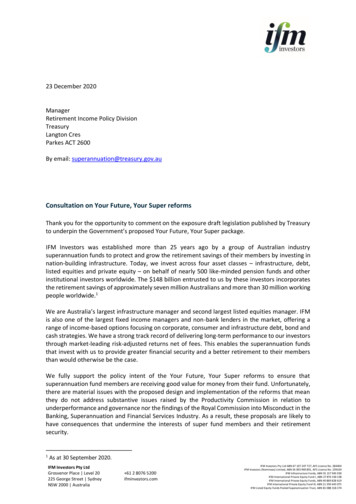
Heidrick & StrugglesThis year’s survey also looked at average totalcompensation by gender and ethnicity. For themost part, this survey does not show one groupbeing favored over another. The exception,however, seems to be how female managingdirectors and partners are being paid comparedto their male counterparts. Our feeling is thatthis is more of a reflection of the fact thatthere are relatively few females at senior levelsat PE firms. That pulls the average down.Over time, this discrepancy shouldnarrow as more female investmentprofessionals are actively recruited intoprivate equity, albeit at the junior ranks.Average total compensation by gender and ethnicity (USD, thousands)MenWomenWhite/CaucasianProfessional of color/ethnic minorityTotal cash compensation: base 2020 bonus 2020By title 1,459 1,355 1,431 845 617 618 621 588 412 437 239 233 408 432 231 251Junior (associate/analyst)Vice presidentPrincipalSenior leader (managing partner/partner/managing director)By AUMSample sizesTitle 762 745 522 424 520Less than 2.00bn 462 837 520 832 645 613 2.00bn– 9.99bn 451Junior2263116986Vice president1812314457Principal1431811837Senior leader2141718241Less than 2.00bn2733223163 2.0bn– 9.99bn3423327496 10.00bn or more1512510862AUMMore than 10.00bnSource: Heidrick & Struggles’ North America private equity compensation survey, 2021, n 862 investment professionals11
2021 North American Private Equity Investment Professional Compensation SurveyState of investmentprofessional compensationAverage base, bonus, and carry by seniorityManaging partnerBy most recent fund (USD, thousands)Average base 2020 10,205Average bonus 2020 12,709Average carry across most recent fund 22,938 31,250 71,160 49,429 39,167 40,000 3,590 2,201 1,510 2,096 999 617 3,000 1,938 780 1,319 1,239 1,012 957 515Less than 250.00m 493 250.00m– 499.00m 300 500.00m– 749.00m 750.00m– 999.00m 1.00bn– 1.49bn 1.50bn– 2.49bn 2.50bn– 3.49bn 3.50m– 4.99bnNumber of responsesCarry611847531Salary613858731Source: Heidrick & Struggles’ North America private equity compensation survey, 2020, n 51 investment professionalsBy AUM (USD, thousands)Average base 2020 10,290Average bonus 2020 21,813Average carry across all funds 49,342 102,067 77,685 2,099 2,339 1,306 80,000 3,000 823 1,551 1,083 1,226 692 747 483Less than 500.00m 300 500.00m– 999.00m 1.00bn– 1.99bn 2.00bn– 3.99bn 4.00bn– 5.99bn 10.00bn– 19.99bnNumber of responsesCarry58121361Salary68131671Source: Heidrick & Struggles’ North America private equity compensation survey, 2021, n 51 investment professionals12
Heidrick & StrugglesPartner/managing directorBy most recent fund (USD, thousands)Average base 2020Average bonus 2020 6,870 7,112 10,076Average carry across most recent fund 9,567 13,474 16,938 22,075 994 830 578 173 362 330 414Less than 250.00m 250.00m– 499.00m 503 390 500.00m– 749.00m 878 24,942 1,142 648 539 547 25,870 750.00m– 999.00m 1.00bn– 1.49bn 693 762 1.50bn– 2.49bn 21,250 649 726 603 556 2.50bn– 3.49bn 3.50m– 4.99bn 5.00bn– 9.99bn 10.00bnand aboveNumber of responsesCarry5302322263324101216Salary 5342325263526101418Source: Heidrick & Struggles’ North America private equity compensation survey, 2021, n 216 investment professionalsBy AUM (USD, thousands)Average base 2020 10,890Average bonus 2020 11,497 17,094Average carry across most recent fund 21,704 27,165 833 325 332Less than 500.00m 492 522 435 447 497 500.00m– 999.00m 1.00bn– 1.99bn 513 38,279 40,206 1,044 912 683 650 2.00bn– 3.99bn 4.00bn– 5.99bn 6.00bn– 9.99bn 38,150 36,925 1,039 801 885 435 10.00bn– 19.99bn 20.00bn– 39.99bn 724 40.00bnand aboveNumber of 201420Source: Heidrick & Struggles’ North America private equity compensation survey, 2021, n 216 investment professionals13
2021 North American Private Equity Investment Professional Compensation SurveyPrincipalBy most recent fund (USD, thousands)Average base 2020Average bonus 2020 1,433Average carry across most recent fund 3,244 4,226 4,375 5,293 5,482 240 234 255 258 274 232 260 329 280 324 286Less than 250.00m 250.00m– 499.00m 500.00m– 749.00m 750.00m– 999.00m 1.00bn– 1.49bn 1.50bn– 2.49bn 205 7,486 9,593 498 471 11,887 12,956 567 531 280 259 345 308 2.50bn– 3.49bn 3.50m– 4.99bn 5.00bn– 9.99bn 10.00bnand aboveNumber of responsesCarry3302310272519131318Salary 4312410282519161518Source: Heidrick & Struggles’ North America private equity compensation survey, 2021, n 190 investment professionalsBy AUM (USD, thousands)Average base 2020Average bonus 2020 3,751 4,430 208 223 263Less than 500.00mAverage carry across most recent fund 6,365 7,656 7,169 10,356 12,560 17,580 20,170 255 242 274 341 276 346 283 476 275 439 303 609 286 526 347 500.00m– 999.00m 1.00bn– 1.99bn 2.00bn– 3.99bn 4.00bn– 5.99bn 6.00bn– 9.99bn 10.00bn– 19.99bn 20.00bn– 39.99bn 40.00bnand aboveNumber of 1710Source: Heidrick & Struggles’ North America private equity compensation survey, 2021, n 190 investment professionals14
Heidrick & StrugglesVice presidentBy most recent fund (USD, thousands)Average base 2020Average bonus 2020 1,350Average carry across most recent fund 1,575 1,853 1,766 2,021 2,531 147 197 192 221 224 175 123 187 195 214 200 239Less than 250.00m 250.00m– 499.00m 500.00m– 749.00m 750.00m– 999.00m 1.00bn– 1.49bn 1.50bn– 2.49bn 2.50bn– 3.49bn 48 2,701 4,008 4,104 3,436 283 319 331 338 168 202 216 3.50m– 4.99bn 5.00bn– 9.99bn 10.00bnand aboveNumber of responsesCarry3352620273622111613Salary 4393222313926131918Source: Heidrick & Struggles’ North America private equity compensation survey, 2021, n 243 investment professionalsBy AUM (USD, thousands)Average base 2020Average bonus 2020Average carry across most recent fund 1,709 2,180 2,006 2,890 2,880 223 233 3,267 4,290 4,178 4,316 90 176 128 181 149 206 280 315 311 345 211 194 218 196 199 222Less than 500.00m 500.00m– 999.00m 1.00bn– 1.99bn 2.00bn– 3.99bn 4.00bn– 5.99bn 6.00bn– 9.99bn 10.00bn– 19.99bn 20.00bn– 39.99bn 40.00bnand aboveNumber of 31713Source: Heidrick & Struggles’ North America private equity compensation survey, 2021, n 243 investment professionals15
2021 North American Private Equity Investment Professional Compensation SurveyAssociate/senior associateBy most recent fund (USD, thousands)Average base 2020Average bonus 2020 640 364 617 64 90 90 111 120Less than 250.00m 250.00m– 499.00mAverage carry across most recent fund 670 925 908 1,041 567 808 1,600 126 120 129 122 116 133 132 158 141 147 123 178 141 176 148 500.00m– 749.00m 750.00m– 999.00m 1.00bn– 1.49bn 1.50bn– 2.49bn 2.50bn– 3.49bn 3.50m– 4.99bn 5.00bn– 9.99bn 10.00bnand aboveNumber of responsesCarry47646108361Salary 12403721444223221721Source: Heidrick & Struggles’ North America private equity compensation survey, 2021, n 280 investment professionalsBy AUM (USD, thousands)Average base 2020Average bonus 2020 480 783 64 113Less than 500.00mAverage carry across all funds 573 1,094 737 890 1,725 451 2,400 120 94 120 126 128 135 128 152 132 146 137 164 135 149 500.00m– 999.00m 1.00bn– 1.99bn 2.00bn– 3.99bn 4.00bn– 5.99bn 6.00bn– 9.99bn 10.00bn– 19.99bn 20.00bn– 39.99bn 40.00bnand above 88 187Number of urce: Heidrick & Struggles’ North America private equity compensation survey, 2021, n 279 investment professionals16
Heidrick & StrugglesAnalystsOverall(USD, thousands)Overall(USD, thousands)Average bonus 20202019LowAverage base 202020202021LowerUpperLowerUpperLowerUpperMeanHigh LowMeanHigh equartileBase 0011513115318050100127150190509091100150Bonus 84AnalystTotal salary (base bonus)Analyst80Source: Heidrick & Struggles’ North America private equity compensation survey, 2021 n 21 investment professionalsAUM range: Less than 500m– 40bn or more; fund size breakdown: Less than 250m– 10bn or moreOverall(n 21)Note: Due to the low response rate, we have combined all of the analyst data in this single chart, irrespective of fund size.17
2021 North American Private Equity Investment Professional Compensation SurveyBase, bonus, and carry by most recent fundLess than 250.00m(USD, thousands)Associate/senior associateVice presidentPrincipalPartner/managingdirectorManaging partner124456Number of werquartileMeanUpperquartileHighAssociate/senior ice 43300300Partner/managing 500Managing 50Associate/senior associate1033566014010306483120Vice 05088205318370Partner/managing director50751672253507085173225350Managing te/senior associate90120156180250110120175215240Vice 03255686531,200260328445445600Partner/managing director280300410450650300370434450650Managing aseBonusTotal salary (base bonus)Carry (most recent fund)LowLower quartileMeanUpper quartileHighAssociate/senior associate101906407252,000Vice ,4332,0502,300Partner/managing 0,00019,730Managing partnerSource: Heidrick & Struggles’ North America private equity compensation survey, 2021, n 31 investment professionals18
Heidrick & StrugglesBase, bonus, and carry by most recent fund 250.00m– 499.00m(USD, thousands)Associate/senior associateVice presidentPrincipalPartner/managingdirectorManaging partner4039323413Number of werquartileMeanUpperquartileHighAssociate/senior 0Vice 72315520Partner/managing 15781,450Managing ,1067505,000Associate/senior associate10587690170407090100170Vice 0525039050150234300450Partner/managing director802003024001000802133624501100Managing ociate/senior associate120160182200300140180205230300Vice 0338418465680290400475555700Partner/managing director2804786537951,4503005787338501,250Managing 0BaseBonusTotal salary (base bonus)Carry (most recent fund)LowLower quartileMeanUpper quartileHighAssociate/senior associate10803643251,500Vice 5020,000PrincipalPartner/managing directorManaging partnerSource: Heidrick & Struggles’ North America private equity compensation survey, 2021, n 158 investment professionals19
2021 North American Private Equity Investment Professional Compensation SurveyBase, bonus, and carry by most recent fund 500.00m– 749.00m(USD, thousands)Associate/senior associateVice presidentPrincipalPartner/managingdirectorManaging partner373224238Number of werquartileMeanUpperquartileHighAssociate/senior 0Vice 94323600Partner/managing 67751,200Managing 6751,2442,0002,500Associate/senior associate206085120140306090110160Vice 022728570060135258335850Partner/managing director702005017881300702435788231,750Managing ociate/senior associate110160197230290110180214250310Vice 03954735539402704005216001,090Partner/managing naging aseBonusTotal salary (base bonus)Carry (most recent fund)LowLower quartileMeanUpper quartileHighAssociate/senior associate4005136176631,000Vice 04,2265,06010,000Partner/managing director1,0005,42510,07611,66524,810Managing partner10,50014,00022,93827,50050,000Source: Heidrick & Struggles’ North America private equity compensation survey, 2021, n 124 investment professionals20
Heidrick & StrugglesBase, bonus, and carry by most recent fund 750.00m– 999.00m(USD, thousands)Associate/senior associateVice presidentPrincipalPartner/managingdirectorManaging partner212310255Number of werquartileMeanUpperquartileHighAssociate/senior 0210Vice 06298650Partner/managing 45001,600Managing 006402,9284,0008,000Associate/senior associate2010511213517030100120150180Vice 65205245370100158232288470Partner/managing director80300422523650904005397001000Managing iate/senior associate130195223270300140220249300330Vice 0385419475550310473492545650Partner/managing ng 000BaseBonusTotal salary (base bonus)Carry (most recent fund)LowLower quartileMeanUpper quartileHighAssociate/senior associate3804706708501,000Vice 54,3754,8758,930Partner/managing director1,1006,4009,56712,39818,000Managing partner17,00017,75031,25035,00065,000Source: Heidrick & Struggles’ North America private equity compensation survey, 2021, n 85 investment professionals21
2021 North American Private Equity Investment Professional Compensation SurveyBase, bonus, and carry by most recent fund 1.00bn– 1.49bn(USD, thousands)Associate/senior associateVice presidentPrincipalPartner/managingdirectorManaging partner443129268Number of werquartileMeanUpperquartileHighAssociate/senior Vice 1340630Partner/managing 47131,500Managing 81,3508137,000Associate/senior associate20801061302101093122150290Vice 0276323480110280329395650Partner/managing director502885677631300502886488002,000Managing ssociate/senior associate13018021824535020190233270410Vice 0450525600780170505585663920Partner/managing naging 7,000BaseBonusTotal salary (base bonus)Carry (most recent fund)LowLower quartileMeanUpper quartileHighAssociate/senior associate2503659251,1002,140Vice 05,2936,02514,250Partner/managing 42967,50080,000Managing partnerSource: Heidrick & Struggles’ North America private equity compensation survey, 2021, n 138 investment professionals22
Heidrick & StrugglesBase, bonus, and carry by most recent fund 1.50bn– 2.49bn(USD, thousands)Associate/senior associateVice presidentPrincipalPartner/managingdirectorManaging partner423926357Number of tileHighLowLowerquartile
Source: Heidrick & Struggles' North America private equity compensation survey, 2021, n 1003 investment professionals Compensation trends While some industries have reduced the compensation of people who have chosen to work remotely from lower-tax areas, that has not been the case in PE: compensation remained strong during the pandemic.