Transcription
2019 Fiduciarymanagement feessurvey4th editionOctober 2019
ContentsSurvey highlights 2Introduction 3Components of costs in a fiduciarymanagement mandate forDB pension schemes 6Fiduciary management fees 8Fiduciary management and investmentmanagement fees 9Total costs (including expenses) 10How EY teams can help you 12
2019 Fiduciary management fees survey 4th edition 1
Survey highlights2Continued feepressureFees are highly dependenton the portfolio contentExpenses arenot trivialMedian levels of fiduciarymanagement (FM) fees havefallen for larger schemes.There continues to be a verywide range of fees proposedby fiduciary managers; webelieve this to be a functionof the larger number of FMofferings in the market as wellas significant variation amongthese offerings.The FM industry caters for anincreasingly wide range of investmentbeliefs. This results in significantdifferences in the content of FMportfolios, which has a knock-on effecton the total fees. High allocations toalternative asset classes and activemanagement results in higher fees, andso a straight comparison of fees doesnot, in itself, provide an indication ofvalue for money.The focus on fees hashistorically been on FM feesand investment management(IM) fees. Portfolio expenses,which can be incurredat both the fiduciarymanager level as well as theinvestment manager level,can be as much as 28% ofthe total costs, and shouldnot be ignored. 2019 Fiduciary management fees survey 4th edition
IntroductionBetter cost transparency aids assessmentof valueOver time, we have seen an improvement in the disclosureof fees and expenses, and this survey aims to help trusteesand sponsors assess whether their fiduciary managementarrangements provide value for money. With increasingdemand for fiduciary management services, there continuesto be evolution in the fiduciary managers’ offerings, which alsoimpacts the total costs.Indeed, over 2017 and 2018, the Competition & MarketsAuthority (CMA) carried out an extensive market investigationinto the investment consultancy and fiduciary managementmarket. This investigation was concluded in June 2019 andone of the outcomes of the review was the requirementfor fiduciary managers to provide detailed disclosures ofall of their fees and costs associated with their fiduciarymanagement services.2019 Fiduciary management fees survey 4th edition 3
Survey respondentsHypothetical DB pension schemesThe information in this survey is based on responses receivedfrom 15 fiduciary managers (listed below) who collectivelymanage the majority of assets in the UK DB fiduciarymanagement industry. Of these 15 fiduciary managers, fourprovided two fiduciary solutions and one provided threefiduciary solutions. Therefore, the survey is based on 21different UK solutions. We would like to extend our gratitudeto these firms for their participation.There are a number of providers of fiduciary managementservices, whose solutions can also differ depending onscheme size and objectives. In order to obtain comparableresults across the providers and for consistency with previoussurveys, we based this survey on the following hypothetical DBpension schemes:UK DB schemes: Small — 50m Medium — 250m Large — 750mRiver & Mercantile Very large — 1.5b Russell InvestmentsCharles Stanley SEI Gatemore Willis Towers Watson Goldman Sachs AssetManagementIn all cases, we have assumed the trustees require thefiduciary manager to manage 100% of their assets and for thefull range of advisory, implementation and communicationservices to be provided by their fiduciary manager. Aon Hewitt Kempen BlackRock Legal & General BMO Mercer Cambridge Associates Cardano Using this surveyWhere the information in this survey is referenced in any form,EY and “EY’s 2019 Fiduciary management fees survey —4th edition” should be disclosed as the source of the material.4 2019 Fiduciary management fees survey 4th editionWe are seeing more mandate whereby trustees give thefiduciary manager the freedom to allocate assets in line withtheir best ideas, provided that they expect to generate therequired return and operate in line with the pension scheme’sjourney plan. As per our previous surveys, we have specifiedthe following characteristics for all hypothetical schemes: A liability duration of 20 years, with a 50:50 split betweennominal and inflation-linked liabilities A target return of liabilities 2.5% p.a.
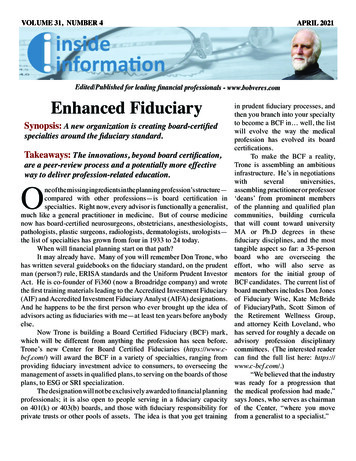
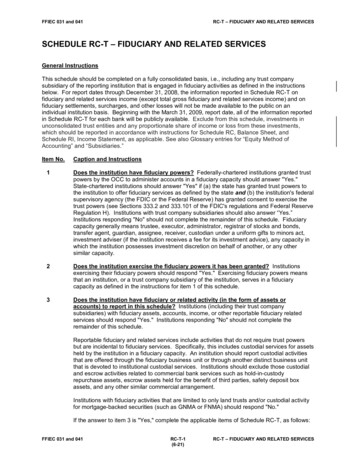
How to read a box plotWe have used several box plots throughout this document to illustrate the spread of survey responses. In particular, the boxplots show the range of the middle 50% of responses. The example below explains how to interpret the graphs.Example: Fiduciary management fees (2019)0.30%0.25%0.20%0.15%The middle 50% of feesare between 0.17% p.a.and 0.23% p.a. i.e.,between Q1 and Q3This line represents the 75th percentile and is labelled ‘Q3’Q3 0.23%This line represents the median, i.e., the 50th percentileMedian 0.21%Q1 0.17%This line represents the 25th percentile and is labelled ‘Q1’0.10%Medium 250m2019 Fiduciary management fees survey 4th edition 5
Componentsof costs ina fiduciarymanagementmandate forDB pensionschemes6 2019 Fiduciary management fees survey 4th edition
Components of costsThe costs in a fiduciary management mandate can be separated into three components:FM feesThis represents the fees paid directly tothe fiduciary manager for strategic advice(including modelling and setting theinvestment strategy) and implementationof the investment strategy (includingmanager selection, tactical asset allocationand implementing hedges). There may bea performance-related component to thefiduciary management fees.IM feesTypically, fiduciary managersimplement the chosen investmentstrategy via underlyinginvestment managers. These feesmake up a large part of total fees,and are passed through tothe client.ExpensesThere can be otherexpenses associatedwith a fiduciarymanagement mandate.Such expenses are notincluded in the FM feesor IM fees. Please referto page 10 for furtherdetails.Services provided by fiduciary managersFiduciary management typically covers the full range of investment services that a pension fund needs. This includes provisionof advice on the investment strategy, implementation of the investment strategy and reporting of performance. As pensionschemes mature and get closer to their end-game, the nature of fiduciary managers’ offerings are expanding to cover advice onsettlement solutions, and managing run-off portfolios. The fee arrangement that each scheme has with their fiduciary manager,therefore, needs to take account of the trustees’ specific requirements including any constraints on the portfolio.2019 Fiduciary management fees survey 4th edition 7
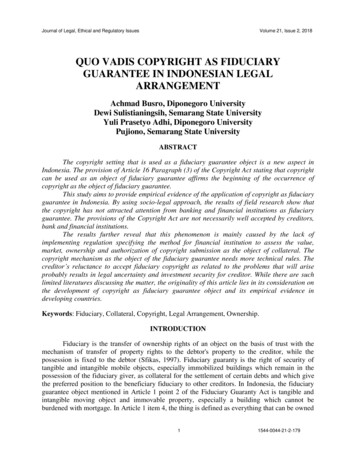
FM feesFM feesIM feesExpensesFiduciary management fees have typically been charged as a percentage of assets, however there are variations of feestructures available, including fixed nominal fees, which may increase annually in line with an index, such as inflation. Forcomparison purposes, we have shown fees as a percentage of assets within the results of our surveys.How have fiduciary management fees for UK DB pension schemes changed since 2013?Figure 1: Inter-quartile range (the middle 50% of values) of fiduciary management fees in 2013, 2015, 2017 and 20190.4%0.3%0.2%0.1%0.0%Small 50mMedium 250m2013Large 750m20152017Very Large 1.5b2019EY Insight:As in our previous surveys, the 2019 results show thatfiduciary management fees (as the percentage of assets)reduce as scheme assets under management increase. Thisis a natural outcome of the cost of strategic advice andimplementation, which do not vary materially with size ofassets, being spread over a larger asset base.8 2019 Fiduciary management fees survey 4th editionFor most scheme sizes, the interquartile range of fees hasnarrowed since our previous surveys. That said, the fullrange of fees (including providers whose fees fall outsidethe interquartile range) continues to be very wide. Theinterquartile range for very large schemes is tight; in reality,we find that these schemes tend to have more bespokerequirements, and the level of fees vary much moredepending on the details of the mandate.
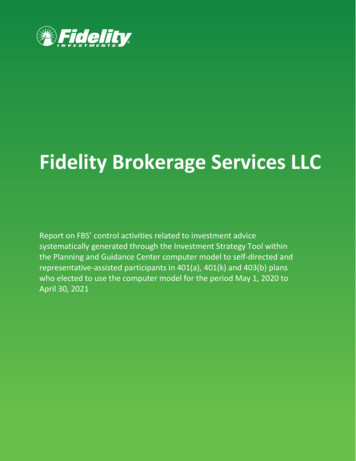
FM fees and IM feesFM feesIM feesExpensesFiduciary management fees plus investment management feesOur view is that it is important to consider the total fees when evaluating a fiduciary management fee proposal. As in ourprevious surveys, 2019’s survey shows that the total of fiduciary management and investment management fees hascontinued to fall.Figure 2 — Inter-quartile range (the middle 50% of values) of fiduciary management fees plus investment management %0.3%Small 50mMedium 250m2013EY Insight:Fees have a high dependency on the asset classesincluded within the mandate. Alternative asset classeshave a higher fee compared to more traditional assetclasses, and active management costs more than passivemanagement. When comparing the fees of differentfiduciary managers, it is important to assess the feesrelative to the construction of the portfolio, as wellas the content of the overall fiduciary service. The lowestfee may not be aligned with the trustees’ requirementsor investment beliefs, and so a deeper understanding ofthe breakdown of fees is crucial to be able to make aninformed decision around value for money.Large 750m20152017Very Large 1.5b2019Figure 3 — Inter-quartile range (the middle 50% of values) ofinvestment management fees for selected asset classes fora 250m schemeHedge fundsInfrastructureGlobal equities (developedmarkets) — actively managedPropertyGlobal equities (developedmarkets) — passively managedLDI portfolios0.0%0.4%0.8%1.2%1.6%2019 Fiduciary management fees survey 4th edition 9
Total costs (FM fees, IM feesand expenses)FM feesIM feesThe final component of costs within an investment mandate isexpenses. Expenses incurred by the fiduciary manager, as wellas expenses incurred by the underlying investment managers,are all ultimately paid by pension schemes. Performance measurement fees Fees for legal reviews of documentation Fiduciary manager pooled fund expensesExpenses are often overlooked when evaluating providers’fee arrangements, sometimes due to less transparency,but often simply ignored. We believe trustees should alsoconsider these expenses. There are various explicit and implicitexpenses which ought to be considered as part of this totalfee, including: Investment manager pooled fund expenses Transition management fees Custody fees Administration feesExpensesThe chart below shows the distribution of the sum of fiduciarymanagement fees, investment management fees andexpenses.Figure 7 — Inter-quartile range of total costs including expenses forUK DB fiduciary management servicesEY Insight:This year’s survey shows that upto 28% of total costs paid may beon expenses. Expenses can createa non-trivial drag on returns, andtherefore should be consideredas part of the evaluation of afee proposal.1.0%0.9%0.8%0.7%0.6%0.5%0.4%0.3%Small 50mMedium 250m201710 2019 Fiduciary management fees survey 4th editionLarge 750m2019Very Large 1.5b
2019 Fiduciary management fees survey 4th edition 11
How EY teams canhelp youThis survey focuses on the fees and expensesfor a fiduciary management mandate, whichwe believe can provide useful benchmarkingfor trustees and sponsors consideringfiduciary management. However, it isimportant for pension schemes to assess thefees and expenses in relation to the valuethat a fiduciary management mandate canoffer, particularly around management ofinvestment and operational risks, and theresulting impact on risk and return.EY provides a wide range of investmentgovernance services, including evaluation ofschemes’ current governance structures, andassisting with the selection and oversight offiduciary managers.For further information, please visit ourwebsite, or contact one of the EY team.ey.com/fiduciarymanagement12 2019 Fiduciary management fees survey 4th edition
Iain BrownPartner,Ernst & Young LLPRikhav ShahDirector,Ernst & Young LLPMatthew MignaultDirector,Ernst & Young LLPT: 44 20 7951 7546E: ibrown1@uk.ey.comT: 44 20 7951 8499E: rshah10@uk.ey.comT: 44 20 7951 7630E: mmignault@uk.ey.comWilliam ComptonSenior Manager,Ernst & Young LLPJonathan CraddockManager,Ernst & Young LLPCiprian BalanManager,Ernst & Young LLPT: 44 20 7197 5256E: william.compton@uk.ey.comT: 44 20 7951 8690E: jonathan.craddock@uk.ey.comT: 44 20 7951 7057E: cbalan@uk.ey.comYanlin WuSenior Consultant,Ernst & Young LLPRob SpencerSenior Consultant,Ernst & Young LLPAndre ClarkeConsultant,Ernst & Young LLPT: 44 20 7951 7116E: yanlin.wu@uk.ey.comT: 44 20 7806 9639E: rob.spencer@uk.ey.comT: 44 20 7951 8307E: andre.clarke@uk.ey.com2019 Fiduciary management fees survey 4th edition 13
EY Assurance Tax Transactions AdvisoryAbout EYEY is a global leader in assurance, tax, transaction and advisoryservices. The insights and quality services we deliver help build trustand confidence in the capital markets and in economies the worldover. We develop outstanding leaders who team to deliver on ourpromises to all of our stakeholders. In so doing, we play a critical rolein building a better working world for our people, for our clients and forour communities.EY refers to the global organization, and may refer to one or more, ofthe member firms of Ernst & Young Global Limited, each of which isa separate legal entity. Ernst & Young Global Limited, a UK companylimited by guarantee, does not provide services to clients. Informationabout how EY collects and uses personal data and a description of therights individuals have under data protection legislation are availablevia ey.com/privacy. For more information about our organization,please visit ey.com. 2019 EYGM Limited.All Rights Reserved.EYG No. 004220-19GblEY-000100496.indd (UK) 10/19.Artwork by Creative Services Group London.ED NoneIn line with EY’s commitment to minimize its impact on the environment, this documenthas been printed on paper with a high recycled content.This material has been prepared for general informational purposes only and is not intended tobe relied upon as accounting, tax or other professional advice. Please refer to your advisors forspecific advice.ey.com
arrangements provide value for money. With increasing demand for fiduciary management services, there continues to be evolution in the fiduciary managers' offerings, which also impacts the total costs. Introduction Indeed, over 2017 and 2018, the Competition & Markets Authority (CMA) carried out an extensive market investigation