Transcription
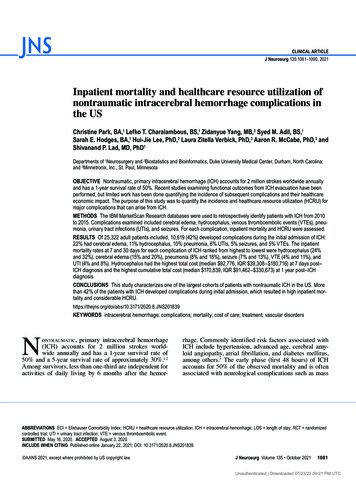
CLINICAL ARTICLEJ Neurosurg 135:1081–1090, 2021Inpatient mortality and healthcare resource utilization ofnontraumatic intracerebral hemorrhage complications inthe USChristine Park, BA,1 Lefko T. Charalambous, BS,1 Zidanyue Yang, MB,2 Syed M. Adil, BS,1Sarah E. Hodges, BA,1 Hui-Jie Lee, PhD,2 Laura Zitella Verbick, PhD,3 Aaron R. McCabe, PhD,3 andShivanand P. Lad, MD, PhD1Departments of 1Neurosurgery and 2Biostatistics and Bioinformatics, Duke University Medical Center, Durham, North Carolina;and 3Minnetronix, Inc., St. Paul, MinnesotaOBJECTIVE Nontraumatic, primary intracerebral hemorrhage (ICH) accounts for 2 million strokes worldwide annuallyand has a 1-year survival rate of 50%. Recent studies examining functional outcomes from ICH evacuation have beenperformed, but limited work has been done quantifying the incidence of subsequent complications and their healthcareeconomic impact. The purpose of this study was to quantify the incidence and healthcare resource utilization (HCRU) formajor complications that can arise from ICH.METHODS The IBM MarketScan Research databases were used to retrospectively identify patients with ICH from 2010to 2015. Complications examined included cerebral edema, hydrocephalus, venous thromboembolic events (VTEs), pneumonia, urinary tract infections (UTIs), and seizures. For each complication, inpatient mortality and HCRU were assessed.RESULTS Of 25,322 adult patients included, 10,619 (42%) developed complications during the initial admission of ICH:22% had cerebral edema, 11% hydrocephalus, 10% pneumonia, 6% UTIs, 5% seizures, and 5% VTEs. The inpatientmortality rates at 7 and 30 days for each complication of ICH ranked from highest to lowest were hydrocephalus (24%and 32%), cerebral edema (15% and 20%), pneumonia (8% and 18%), seizure (7% and 13%), VTE (4% and 11%), andUTI (4% and 8%). Hydrocephalus had the highest total cost (median 92,776, IQR 39,308– 180,716) at 7 days post–ICH diagnosis and the highest cumulative total cost (median 170,839, IQR 91,462– 330,673) at 1 year post–ICHdiagnosis.CONCLUSIONS This study characterizes one of the largest cohorts of patients with nontraumatic ICH in the US. Morethan 42% of the patients with ICH developed complications during initial admission, which resulted in high inpatient mortality and considerable 201839KEYWORDS intracerebral hemorrhage; complications; mortality; cost of care; treatment; vascular disordersNontraumatic,primary intracerebral hemorrhage(ICH) accounts for 2 million strokes worldwide annually and has a 1-year survival rate of50% and a 5-year survival rate of approximately 30%.1,2Among survivors, less than one-third are independent foractivities of daily living by 6 months after the hemor-rhage. Commonly identified risk factors associated withICH include hypertension, advanced age, cerebral amyloid angiopathy, atrial fibrillation, and diabetes mellitus,among others.3 The early phase (first 48 hours) of ICHaccounts for 50% of the observed mortality and is oftenassociated with neurological complications such as massABBREVIATIONS ECI Elixhauser Comorbidity Index; HCRU healthcare resource utilization; ICH intracerebral hemorrhage; LOS length of stay; RCT randomizedcontrolled trial; UTI urinary tract infection; VTE venous thromboembolic event.SUBMITTED May 16, 2020. ACCEPTED August 3, 2020.INCLUDE WHEN CITING Published online January 22, 2021; DOI: 10.3171/2020.8.JNS201839. AANS 2021, except where prohibited by US copyright lawJ Neurosurg Volume 135 October 20211081Unauthenticated Downloaded 07/23/22 09:21 PM UTC
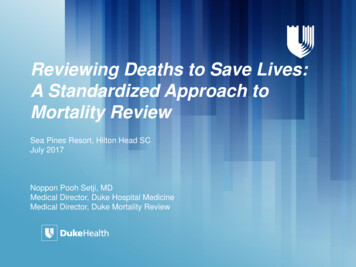
Park et al.effect, increased intracranial pressure, and herniation.4,5The late phase (days to weeks) is related to medical complications such as pulmonary embolism, aspiration pneumonia, and sepsis.4Given the high morbidity and mortality of ICH, various novel interventions are being investigated.6–9 Different neurosurgical options have been evaluated in largemulticenter randomized controlled trials (RCTs), such asINVEST and ENRICH, but have not demonstrated significantly improved outcomes to date.6,9 In parallel, RCTssuch as the ICES and MISTIE trials have been performedto evaluate minimally invasive surgery in comparison toeither medical therapy or conventional craniotomy, withvarying degrees of success using different surgical techniques and in different patient subgroups.7,8 Because thereis currently no ideal treatment option for ICH, it is important to make an early diagnosis to prevent the development of subsequent complications that lead to a worseprognosis.Complications of ICH can serve as useful prognosticfactors of early mortality and morbidity, and interventionsthat address these complications may improve survivaland functional outcomes.10,11 Specifically, hydrocephalus,cerebral edema, venous thromboembolic events (VTEs),seizures, and infection have been shown to contribute toadverse outcomes.12–15 Many studies present overall incidence, mortality, and functional outcomes resulting fromICH evacuation; however, research into the incidenceand impact of each of these secondary complications andtheir associated healthcare resource utilization (HCRU)has been limited. The purpose of this study was to quantify the incidence and cost of care associated with treatments for each major complication that can arise fromICH.MethodsStudy DesignThis was a retrospective cohort study using the IBMMarketscan Research Database, which is a well-established, large claims data set that allows for longitudinaltracking of patient data including diagnosis, medications,and associated healthcare costs. These costs can be furtherdifferentiated by diagnoses and procedures. Moreover, itincludes healthcare services covered by commercial insurances, Medicare supplemental plans, and Medicaid inselected states. Patients aged 18 years or older with ICHdiagnosed between January 1, 2011, and December 31,2014, were included in this study. The index date was thefirst date of ICH diagnosis made in either the inpatient oroutpatient setting. Detailed inclusion and exclusion criteria of the study cohort can be found in the consort diagram(Fig. 1). ICD-9/10 inclusion and exclusion codes can befound in eTable 1.Definition of ComplicationsComplications of ICH considered include cerebral edema, hydrocephalus, seizures, VTEs, pneumonia, and urinary tract infections (UTIs; diagnosis codes used to definecomplications can be found in eTable 2). We used as manyspecific codes related to the complications of interest as1082FIG. 1. CONSORT diagram of patient selection.possible to be inclusive of all patients who had the complications. Patients were then classified into subgroups basedon these complications. If a patient developed multiplecomplications, they were included in multiple complication groups for calculating mortality and HCRU (i.e., thegroups formed by complications were not mutually exclusive). We focused on complications that developed duringthe initial admission of ICH, which was defined as the index hospital admission. Any complications developed after the discharge from the index stay were not considereda complication. Similarly, we only considered invasivetreatments for complications within the initial ICH admission (procedure codes to define invasive treatments can befound in eTable 3).Calculating 60-Day In-Hospital MoralityFor tracking 60-day in-hospital mortality, patients werefollowed from the initial diagnosis of ICH until the occurrence of inpatient death. Patients who did not have in-hospital death were censored at the earliest occurrences of thefollowing events: 1) last day of service, 2) disenrollmentfrom the database, or 3) end of 60 days after the initialdiagnosis of ICH.Calculating HCRUHCRU for each complication was calculated by track-J Neurosurg Volume 135 October 2021Unauthenticated Downloaded 07/23/22 09:21 PM UTC
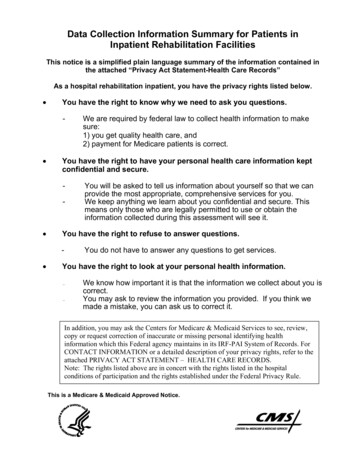
Park et al.ing the inpatient costs and length of stay (LOS) for ICHadmission. Outpatients costs after discharge were also assessed. For hydrocephalus and cerebral edema with invasive treatment options—including craniotomy, craniectomy, and CSF diversions—we compared the costs betweenthose who received invasive treatment versus those whodid not. All costs were assessed for the post-index periodsof 0–7 days, 7–30 days, 30–60 days, and 60–365 days, andthey were adjusted for inflation to 2018 US dollars usingthe Consumer Price Index data from 1913 to 2019.16 Onlypatients with continuous enrollment in each time periodwere included when assessing costs for these time periods.In addition, we calculated cumulative costs up to 7 days,30 days, 60 days, and 1 year post-index.Statistical AnalysisDescriptive statistics were provided for patient demographics, complication rates, LOS, mortality rates, andcosts. Because the complication groups were not mutuallyexclusive, we did not do hypothesis testing for comparingmortality rates across all groups. However, we did performlog-rank tests for comparing the survival between patientswith and those without invasive treatments for hydrocephalus and cerebral edema, and between patients with andthose without complications. The generalized estimatingequations method was used to estimate the mean costs atdifferent time points with a log link function. Covariatesincluded age at diagnosis, sex, region, metropolitan statistical area, insurance type, employment status, ElixhauserComorbidity Index (ECI), types of complications, andinvasive treatments.17 Inpatient mortality rates and cumulative incidences of complications with 95% confidenceintervals were estimated using Kaplan-Meier methods. Inall cases, statistical significance was assessed at 0.05 without adjustment for multiplicity. Analyses were conductedusing SAS (version 9.4, SAS Institute Inc.).ResultsAn initial cohort of 114,430 adult patients, with an index ICH diagnosis in 2010–2014, were identified in theIBM MarketScan Research Database. Of these patients,72,190 were admitted to a hospital within 7 days. After applying all inclusion/exclusion criteria, a cohort of25,322 patients were included in the analyses of demographics, complication rates, and inpatient mortality (Fig.1). Patients who used capitated insurance plans, had invalid claims, or were outliers in terms of cost (defined astop and bottom 1%) were further excluded. Costs werecalculated for the cohort of 21,481 patients with 1-yearpre-index and 1-year post-index continuous health insurance enrollment.Patient Demographics and Baseline CharacteristicsPatient demographic information is summarized for the25,322 patients in Table 1. The median age of the cohortwas 65 years (IQR 55–80 years). The majority of patientswere dependent (41%) or retired (31%) and were utilizingMedicare Supplemental (46%) or commercial (41%) insurance plans. The median baseline ECI score was 0 (IQR0–7).TABLE 1. Demographics and baseline characteristics of the25,322 patientsVariableAge, yrsMean (SD)MedianIQRRangeSex, n (%)MaleFemaleRegion, n (%)*Northeast regionNorth Central regionSouth regionWest regionUnknown region/MedicaidMetropolitan statistical area, n (%)UrbanRuralEmployment status, n g-term disabilityMedicaidInsurance, n (%)MedicaidMedicare supplementalCommercialBaseline ECI‡No.Mean (SD)MedianIQRRangeTotal65.8 (16.6)65.055.0–80.018.0–104.012,738 (50.3)12,584 (49.7)4723 (18.7)5675 (22.4)7488 (29.6)3620 (14.3)3816 (15.1)22,116 (87.3)3206 (12.7)3864 (15.3)7791 (30.8)10,276 (40.6)63 (0.2)3328 (13.1)3328 (13.1)11,581 (45.7)10,413 (41.1)25,3224.4 (7.3)0.00.0–7.0 14.0 to 63.0* Region is not available for Medicaid patients.† Full-time/part-time: 1 active full-time, 2 active part-time; retiree: 3 earlyretiree, 4 Medicare eligible retiree, 5 retiree (status unknown); other: 6 COBRA insurance continuee, 8 surviving spouse/dependent, 9 other/unknown.‡ ECI was calculated using the van Walraven weighted point system scorewithout cardiac arrhythmia.Complication RatesOf the entire cohort, 10,619 patients (42%) developed atleast 1 complication during their index admission for ICH(eTable 4). The in-hospital complication rates during theinitial ICH admission (from highest to lowest) with median time to onset were found to be cerebral edema (22%,0 days), hydrocephalus (11%, 0 days), pneumonia (10%, 3days), UTI (6%, 1 day), VTE (5%, 5 days), and seizures(5%, 0 days). The cumulative incidence for each complication is plotted in Fig. 2.J Neurosurg Volume 135 October 20211083Unauthenticated Downloaded 07/23/22 09:21 PM UTC
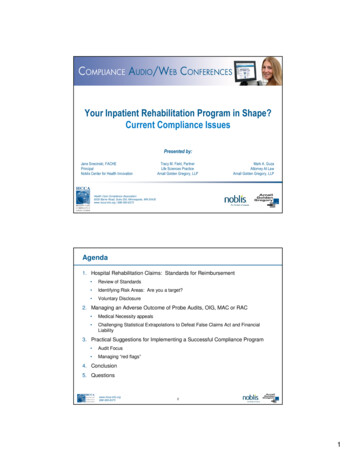
Park et al.FIG. 2. Cumulative incidence for each complication in patients with ICH.More than 99% of the complications occurred within 50 days after index;therefore, the x-axis was truncated at 50 days. Figure is available incolor online only.Inpatient MortalityThe inpatient mortality rates at 7, 30, and 60 days stratified by ICH complication ranked from highest to lowestwere hydrocephalus (24%, 32%, and 34%), cerebral edema(15%, 20%, and 21%), pneumonia (8%, 18%, and 21%), seizure (7%, 13%, and 14%), VTE (4%, 11%, and 13%), andUTI (4%, 8%, and 9%; eTable 5). The Kaplan-Meier plotfor 60-day inpatient mortality is shown in Fig. 3A. Notably, invasive treatments did have a significant effect inprolonging survival in patients with hydrocephalus (Fig.3B; 60-day inpatient mortality rate 26.6% vs 40.7%, p 0.0001, log-rank test) but did not affect inpatient survivalfor patients with cerebral edema (Fig. 3C; 60-day inpatientmortality 22.3% vs 20.3%, p 0.44, log-rank test).HCRUThe median LOS for the entire cohort was 5 days (IQR2–10 days) and it was 4 days (IQR 2–7 days) for patientswithout complications. The occurrence of complicationsprolonged the median LOS (no complication median 4days), with the shortest LOS associated with cerebral edema (median 7 days) and the longest with VTE (median 16days; Table 2).Table 3 provides a summary of the inpatient, outpatient,and total service costs (median, IQR) for all patients atbaseline (1 year pre-index) and 7 days, 30 days, 60 days,and 1 year post-index. Among patients with complications, the hydrocephalus subgroup had the highest totalservice cost of 92,776 at 7 days post-index (index date1084included), while the UTI subgroup had the lowest costof 27,542. The other complications with median costsranked from highest to lowest were VTE ( 77,206), pneumonia ( 69,274), cerebral edema ( 41,966), and seizures( 35,931). The ranking was consistent across all timepoints, except that VTE and pneumonia yielded highercosts than hydrocephalus after 7 days post-index. Withinthe relevant complication groups, the subgroups receivinginvasive treatments also had higher costs than those notreceiving invasive treatments at 7 days post-index: cerebral edema ( 104,284 invasive vs 29,198 noninvasive)and hydrocephalus ( 111,662 invasive vs 62,693 noninvasive; Table 4).The cumulative costs are summarized in eTable 6 andcan be visualized in Fig. 4. At 1 year after index (indexdate included), the top three complications associated withhigh median cumulative total costs were hydrocephalus( 170,839), pneumonia ( 159,428), and VTE ( 153,181).UTI remained the subgroup with the lowest cost at 1 year( 65,437). In complications with the option of consideration for surgical intervention (eTable 7), patients withcerebral edema received invasive treatments and had thehighest cumulative costs of 233,230 at 1 year, 162,454more than the cost of the subgroup with no invasive treatments. Conversely, the difference between the subgroupsof hydrocephalus was not as extreme: 203,535 (invasivetreatment) versus 137,451 (no invasive treatment) at 1year post-index.DiscussionKey FindingsNontraumatic ICH remains a large unmet clinical need.Neurological and medical complications of ICH can serveas useful prognostic factors of early mortality and morbidity, and interventions that address these complicationsmay improve survival and functional outcomes.10,11 Thisstudy examined a large cohort of patients with nontraumatic, primary ICH in the US and characterized the relative incidence of complications and their HCRU. Specifically, we examined hydrocephalus, cerebral edema, VTEs,seizures, and infection, which have each been shown tocontribute to adverse outcomes.12–15 We found that of thetotal 25,322 adult patients included in the study, 10,619(42%) developed at least 1 complication of interest duringthe initial ICH admission. Hydrocephalus had the highestinpatient mortality rate at all time points, as well as thehighest total cost and the highest cumulative cost at 7 daysand 1 year after ICH diagnosis.Incidence and Mortality Associated With HydrocephalusIn our analysis, we found that hydrocephalus (11%) wasthe second most common complication post-ICH, but wasassociated with the highest inpatient mortality at all thestudied time points after the index date. It is important tonote that although hydrocephalus is associated with highmortality itself,18 this trend could be partly due to the frequent superposition of hydrocephalus with other complications such as intraventricular extension of ICH, which isalso associated with a poor prognosis.19,20 Notably, mortality due to hydrocephalus can be mitigated with treatment.J Neurosurg Volume 135 October 2021Unauthenticated Downloaded 07/23/22 09:21 PM UTC
Park et al.FIG. 3. Mortality rates of complications of ICH. A: Kaplan-Meier plot of inpatient survival for patients with ICH at 7, 30, and 60 daysby complication type. B: Inpatient survival for patients with hydrocephalus at 7, 30, and 60 days by treatment type. C: Inpatientsurvival for patients with cerebral edema at 7, 30, and 60 days by treatment type. Figure is available in color online only.Bhattathiri et al. found that early surgical intervention ledto improved outcomes (18%) compared to conservativetreatment alone (12%),12 which is consistent with our results(60-day inpatient mortality 26.6% vs 40.7%), indicating thatinvasive interventions improved the survival rate of patientswith hydrocephalus following ICH. Similarly, a systematicreview regarding treatment of intraventricular hemorrhagesecondary to ICH also reported that the case fatality ratewas 78% for conservative treatment, whereas those whoreceived extraventricular drainage had a rate of 58%.21 Insummary, hydrocephalus is the second most common complication after ICH and is associated with the highest inpatient mortality, but outcomes can be improved with invasiveinterventions. These findings are aligned with the findingsof other groups, and future studies should be performedto elucidate the relationship between hydrocephalus, othercomplications, and overall mortality from ICH.Incidence and Mortality Associated With Cerebral Edema,VTE, and SeizureCerebral edema was the most common complicationpost-ICH, which is consistent with findings in the existingliterature.22 It also had the second highest inpatient mortality in our analysis. Many randomized clinical trials haveshown that invasive interventions such as decompressivecraniectomy are effective when performed within 48 hoursof symptom onset in reducing mortality in patients with infarction secondary to cerebral edema.23–25 After this critical period when herniation has occurred, surgery does notimprove mortality.26 Berrouschot et al. found that mortalityfollowing cerebral infarction secondary to cerebral edemacan range from 70% to 80%, even with the best medicaltreatment.27 Furthermore, the success of invasive management of cerebral edema varies depending on the locationJ Neurosurg Volume 135 October 20211085Unauthenticated Downloaded 07/23/22 09:21 PM UTC
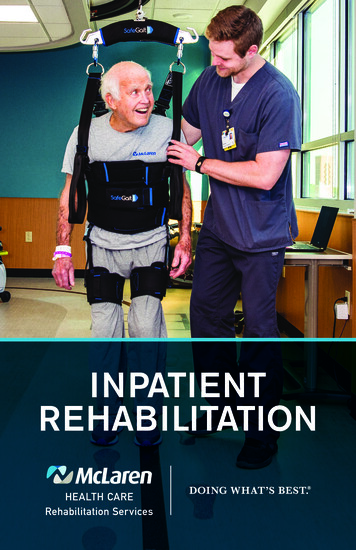
Park et al.TABLE 2. LOS of index hospital admission of ICHVariableOverallNo.Mean (SD)Median (IQR)RangeCerebral edemaNo.Mean (SD)Median (IQR)RangeHydrocephalusNo.Mean (SD)Median (IQR)RangeSeizuresNo.Mean (SD)Median (IQR)RangeVTENo.Mean (SD)Median (IQR)RangePneumoniaNo.Mean (SD)Median (IQR)RangeUTINo.Mean (SD)Median (IQR)RangeTotal25,3228.3 (11.0)5.0 (2.0–10.0)0.0–251.0549011.2 (13.8)7.0 (3.0–14.0)0.0–206.0266915.4 (17.1)12.0 (3.0–14.0)0.0–251.0125912.4 (16.2)8.0 (3.0–14.0)0.0–206.0126620.2 (17.7)16.0 (3.0–14.0)0.0–187.0256519.8 (19.7)15.0 (3.0–14.0)0.0–251.0144014.9 (17.9)9.0 (3.0–14.0)0.0–192.0of ICH. For example, treatment of swelling in the posterior fossa and superficial lobar area has shown mortalitybenefits, whereas its effect is questionable when the ICHis located in the supratentorial region.28,29 Nevertheless, theoverall mortality rate is high. Our data are aligned with previous studies and show that the survival probability of patients with cerebral edema precipitously drops 2 days afterdiagnosis of ICH. Moreover, Kaplan-Meier mortality plotsfor patients who developed cerebral edema with or withoutinvasive intervention both show rapidly decreased survivalrates at day 2. Taken together, the literature and our datasuggest that if the critical 2-day period has passed, then thepatient may be best managed through medical treatment(i.e., osmotherapy, intubation, ventilatory support) focusedon maintaining appropriate intracranial pressure rather1086than through invasive treatment. Further research shouldbe pursued to elucidate this association.Immobilization due to neurological deficit from ICHcan lead to increased risk for VTE such as deep veinthrombosis and pulmonary embolism.30,31 We found thatthe incidence of VTE in our cohort is 5% with relativelylow inpatient mortality (4% at 7 days post-ICH), which isconsistent with the previous literature.32,33Seizures are another common concern after ICH. Wefound an incidence of 5% for seizures post-ICH, which islower than the frequency reported elsewhere in the literature (8%–20%).34,35 We hypothesize that this is potentiallybecause there may be many cases of nonconvulsive seizures that can go undiagnosed without overt clinical presentation.34,36 It is also possible that the relatively high inpatient mortality (60-day inpatient mortality rate of 14%)despite the low incidence of seizures in our data is due toa combination of underdiagnosis from subclinical seizuresand limited data fidelity, as a national claims database maynot accurately represent the diagnosis of single seizureepisodes.Comparison of HCRU Between Hydrocephalus andCerebral EdemaIn comparing HCRU for hydrocephalus and cerebraledema, patients with hydrocephalus ( 170,839) incurredgreater overall cumulative costs compared to cerebral edema ( 90,394) over the course of 1 year.There are many possible reasons that we see a higherHCRU for hydrocephalus compared to cerebral edema.Most saliently, the higher cost for hydrocephalus is atleast partially due to the greater inpatient cost for patientswith hydrocephalus ( 137,117) compared to those withcerebral edema ( 56,426). Expanding on this, there area few possible reasons for the increased inpatient costs.Our data demonstrate a longer LOS for hydrocephaluscompared to cerebral edema (12 vs 7 days). It is possiblethat this is due to the fact that surgical intervention hasbeen demonstrated to improve mortality in patients withhydrocephalus. Therefore, because a greater number ofpatients with hydrocephalus may undergo invasive procedures (i.e., craniotomy, shunts) compared to those withcerebral edema, patients with hydrocephalus will spendmore time in the hospital with increased resource utilization, ultimately leading to higher cost of care.37,38 Additionally, an increased number of operations inherentlyincreases the risk for complications such shunt failuresand infection, potentially leading to more readmissionsand increased HCRU.39,40 Finally, it has been shown thatinvasive treatment does not result in increased survival inpatients with cerebral edema who are 60 years of age andolder.41 Considering that the median age of our patient cohort was 65 years, our data align with the literature in thatthe older patients have a poorer prognosis and were lesslikely to receive invasive interventions, ultimately leading to increased mortality and observed shortest hospitalstay.HCRU Associated With VTEOur findings illustrate that VTE had the highest 1-yearcumulative outpatient cost ( 35,194) of all the investigatedJ Neurosurg Volume 135 October 2021Unauthenticated Downloaded 07/23/22 09:21 PM UTC
n 10,8794931.0 (1016.7–19,148.3)0.0 (0.0–4889.9)3472.7 (882.8–9949.9)n 39973052.4 (671.7–12,114.3)0.0 (0.0–0.0)2638.5 (631.5–8294.3)n 16902508.1 (471.6–10,413.3)0.0 (0.0–0.0)2168.9 (447.0–6999.1)n 9944559.3 (957.3–20,075.4)0.0 (0.0–4257.3)3446.9 (893.4–10,695.9)n 10402889.3 (664.2–14,423.0)0.0 (0.0–0.0)2480.2 (593.5–8028.1)n 19913982.0 (764.1–17,753.8)0.0 (0.0–464.8)2974.6 (687.1–9465.8)n 11884133.7 (887.7–16,366.1)0.0 (0.0–111.0)3084.6 (800.3–10,100.9)No complicationTotal service costInpatient costOutpatient costCerebral edemaTotal service costInpatient costOutpatient costHydrocephalusTotal service costInpatient costOutpatient costSeizuresTotal service costInpatient costOutpatient costVTEsTotal service costInpatient costOutpatient costPneumoniaTotal service costInpatient costOutpatient costUTITotal service costInpatient costOutpatient costAll costs are given as median (IQR). Pre-index 1 year.Pre-IndexComplicationn 10,87917,564.2 (9231.3–37,232.1)15,295.7 (7946.7–33,259.8)815.1 (194.2–2145.7)n 399741,966.1 (18,750.2–100,045.0)38,234.6 (16,687.8–94,628.5)1202.8 (418.5–3248.4)n 169092,775.8 (39,308.3–180,715.9)87,132.5 (36,477.7–174,503.3)1332.7 (449.1–4347.2)n 99435,930.9 (14,439.6–90,770.3)32,545.0 (12,707.8–86,577.1)1066.7 (283.6–2993.7)n 104077,206.2 (30,581.1–174,058.1)73,734.7 (27,220.3–167,770.3)1271.3 (401.8–3925.1)n 199169,273.8 (19,954.9–158,942.1)66,314.5 (18,499.0–155,705.6)980.8 (325.6–2733.1)n 118827,541.6 (12,434.4–74,810.1)24,024.8 (10,663.7–71,746.2)908.4 (237.0–2212.8)7 Days30 DaysPost-Indexn 90921900.7 (487.4–7845.3)0.0 (0.0, 898.6)998.6 (275.5–3049.2)n 33726622.7 (1573.1–25,448.2)1053.4 (0.0–18,124.1)1085.6 (242.0–3722.1)n 136614,835.0 (4317.8–41,199.1)10,037.0 (1844.0–37,131.9)522.6 (20.4–2047.1)n 8184619.4 (1091.8–20,808.4)926.8 (0.0–15,410.5)859.9 (183.2–2698.1)n 91714,708.5 (4232.6–41,443.1)9031.0 (909.9–37,464.1)791.9 (79.8–2726.7)n 162012,845.1 (3828.9–37,843.0)7097.0 (915.9–33,136.1)727.3 (71.2–2923.2)n 10444866.6 (1271.7–17,872.7)786.5 (0.0–10,146.5)923.8 (179.0–3081.7)TABLE 3. Total costs for continuously enrolled patients in each time period by complication typesn 80181459.6 (376.4–5304.2)0.0 (0.0, 0.0)1250.6 (343.8–4108.6)n 29953968.5 (1048.9–16,444.3)0.0 (0.0–966.2)2112.0 (565.7–6935.5)n 12115929.7 (17,65.7–25,284.5)130.0 (0.0–11,792.3)2004.4 (555.1–5792.1)n 7292563.9 (659.8–12,014.4)0.0 (0.0–641.8)1403.2 (363.6–4659.3)n 8037875.6 (2239.7–27,570.4)164.5 (0.0–15,599.0)2317.8 (523.3–7493.4)n 13797896.8 (2087.5–27,965.7)296.8 (0.0–16,449.1)2109.6 (498.9–6972.8)n 9033215.8 (653.3–14,866.9)0.0 (0.0–602.2)1753.6 (384.9–6246.4)60 Daysn 57758501.8 (2554.5–26,504.2)0.0 (0.0, 2647.6)6359.3 (2244.3–16,884.2)n 177116,427.7 (5147.7–50,404.5)0.0 (0.0–13,389.4)11,499.6 (4145.6–30,113.3)n 72919,762.6 (6228.0–56,799.7)0.0 (0.0–19,020.9)14,040.8 (5272.4–33,799.2)n 48913,365.1 (3593.6–45,620.8)0.0 (0.0–11,979.5)8731.2 (2793.4–22,296.6)n 47327,991.8 (8730.0–66,601.5)0.0 (0.0–21,824.7)18,354.6 (7012.1–39,246.6)n 79128,935.7 (7843.5–80,719.9)750.0 (0.0–32,233.5)16,059.4 (5744.5–42,180.1)n 56514,093.7 (3683.4–38,464.0)0.0 (0.0–8050.0)9967.8 (3015.4–24,802.1)1 YrPark et al.J Neurosurg Volume 135 October 20211087Unauthenticated Downloaded 07/23/22 09:21 PM UTC
1088n 39739,893.8 (12,658.7–98,759.6)n 137413,129.1 (4183.2–39,699.9)26,764.7n 40529,232.7 (7838.1–76,008.5)n 32414,679.5 (4770.4–41,152.1)14,553.2n 79610,600.6 (3075.4–33,146.9)n 21992895.7 (756.4–11,053.4)7704.9n 7208131.2 (2645.3–31,894.0)n 4913654.1 (1003.0–15,605.6)4477.1n 79920,808.4 (6944.1–47,743.0)n 5678522.7 (2281.0–26,583.5)12,285.7n 951111,661.5 (59,843.3–209,415.5)n 73962,692.9 (19,018.6–140,372.5)48,968.6n 9512411.9 (407.5–10,326.4)n 7392580.6 (526.3–10,510.2)—n 88517,920.0 (5713.1–46,371.0)n 24874063.2 (1162.9–19,060.7)13,856.8n 1039104,284.0 (55,681.9–189,765.3)n 295829,198.2 (16,407.2–66,718.8)75,085.8n 10392549.5 (498.6–11,102.2)n 29583253.7 (728.1–12,401.9)—Cerebral edemaPatients w/ invasive txTotal costPatients w/o invasive txTotal costDifference in total cost*HydrocephalusPatients w/ invasive txTotal costPatients w/o invasive txTotal costDifference in total cost*complications. This large outpatient cost is partially explained by the work of Lin and colleagues, who foundthat the total cost for VTE-related healthcare resourceswithin 1 year following the date of diagnosis was greaterfor patients with a recurrence compared to those withoutrecurrence ( 38,591 vs 15,123, respectively; p 0.001)when costs were estimated with claims only associatedwith VTE diagnosis and anticoagulant therapy.42 Neurosurgical patients are already at particularly high risk forVTE,43 and it has been demonstrated that the risk of recurrence after an episode of VTE can be more than 50 timeshigher compared to patients without previous VTE.44 Additionally, high outpatient costs also contribute to the highoverall cumulative cost noted for VTE ( 153,181), whichis consistent with the finding that long-term ambulatorycare accounts for about 35% of aggregate lifetime cost ofstroke in the US.45tx treatment.Total costs are given as median (IQR) unless otherwise indicated.* Difference in total cost was calculated by subtracting the median total cost of noninvasive treatment from the median total cost of invasive treatment.1 Yr60 Days30 DaysComplicationPre-Index7 DaysPost-IndexTABLE 4. Total costs for continuously enrolled patients with cerebral edema and hydrocephalus by invasive treatmentsPark et al.LimitationsOur study has inherent limitations due to the nature ofthe claims database and
their associated healthcare resource utilization (HCRU) has been limited. The purpose of this study was to quan-tify the incidence and cost of care associated with treat-ments for each major complication that can arise from ICH. Methods Study Design This was a retrospective cohort study using the IBM Marketscan Research Database, which is a .