Transcription
McDermott et al. BMC Complementary and Alternative Medicine 2014, 2RESEARCH ARTICLEOpen AccessA yoga intervention for type 2 diabetes riskreduction: a pilot randomized controlled trialKelly A McDermott1*, Mohan Raghavendra Rao2, Raghuram Nagarathna2, Elizabeth J Murphy3, Adam Burke4,Ramarao Hongasandra Nagendra2 and Frederick M Hecht1AbstractBackground: Type 2 diabetes is a major health problem in many countries including India. Yoga may be aneffective type 2 diabetes prevention strategy in India, particularly given its cultural familiarity.Methods: This was a parallel, randomized controlled pilot study to collect feasibility and preliminary efficacy dataon yoga for diabetes risk factors among people at high risk of diabetes. Primary outcomes included: changes inBMI, waist circumference, fasting blood glucose, postprandial blood glucose, insulin, insulin resistance, bloodpressure, and cholesterol. We also looked at measures of psychological well-being including changes in depression,anxiety, positive and negative affect and perceived stress. Forty-one participants with elevated fasting blood glucosein Bangalore, India were randomized to either yoga (n 21) or a walking control (n 20). Participants were asked toeither attend yoga classes or complete monitored walking 3–6 days per week for eight weeks. Randomization andallocation was performed using computer-generated random numbers and group assignments delivered in sealed,opaque envelopes generated by off-site study staff. Data were analyzed based on intention to treat.Results: This study was feasible in terms of recruitment, retention and adherence. In addition, yoga participants hadsignificantly greater reductions in weight, waist circumference and BMI versus control (weight 0.8 2.1 vs. 1.4 3.6, p 0.02; waist circumference 4.2 4.8 vs. 0.7 4.2, p 0.01; BMI 0.2 0.8 vs. 0.6 1.6, p 0.05). There wereno between group differences in fasting blood glucose, postprandial blood glucose, insulin resistance or any otherfactors related to diabetes risk or psychological well-being. There were significant reductions in systolic and diastolicblood pressure, total cholesterol, anxiety, depression, negative affect and perceived stress in both the yogaintervention and walking control over the course of the study.Conclusion: Among Indians with elevated fasting blood glucose, we found that participation in an 8-week yogaintervention was feasible and resulted in greater weight loss and reduction in waist circumference when comparedto a walking control. Yoga offers a promising lifestyle intervention for decreasing weight-related type 2 diabetes riskfactors and potentially increasing psychological well-being.Trial registration: ClinicalTrials.gov Identified NCT00090506.Keywords: Yoga, Prediabetes, Type 2 diabetes, India, Randomized controlled pilotBackgroundType 2 diabetes mellitus (T2DM) is a major global healthproblem with a prevalence of 366 million in 2011 thatis projected to increase by 51%, reaching 552 million by2030 [1,2]. India follows this global trend with a prevalence of 60 million in 2011 that is projected to increase by* Correspondence: mcdermottk@ocim.ucsf.edu1Osher Center for Integrative Medicine, University of California, 1545Divisadero St., San Francisco, CA 94115, USAFull list of author information is available at the end of the article63%, reaching 98 million by 2030 [1]. Factors contributingto the high prevalence of T2DM in India include geneticpredisposition exacerbated by environmental factors including increasing prosperity and urbanization resulting inincreased abdominal obesity and insulin resistance [3,4].In India, there is also a high prevalence of prediabetes,with elevated fasting blood glucose (FBG) in the range of5.6-6.9 mmol/L [3,5]. Individuals with prediabetes are atan increased risk of developing T2DM (FBG 7 mmol/L);5-10% will develop T2DM within one year, 25% within 2014 McDermott et al.; licensee BioMed Central Ltd. This is an Open Access article distributed under the terms of theCreative Commons Attribution License (http://creativecommons.org/licenses/by/2.0), which permits unrestricted use,distribution, and reproduction in any medium, provided the original work is properly credited. The Creative Commons PublicDomain Dedication waiver ) applies to the data made available in thisarticle, unless otherwise stated.
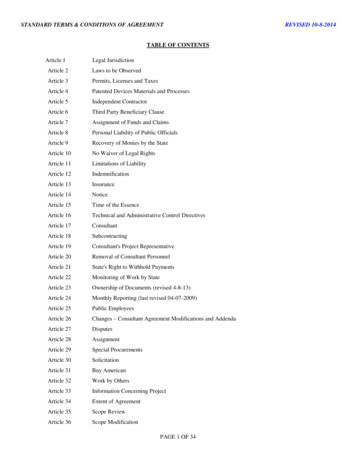
McDermott et al. BMC Complementary and Alternative Medicine 2014, 25 years [6]. Metabolic syndrome is another characterizationof high risk individuals with at least three of the followingfive risk factors: elevated FBG, elevated blood pressure, lowhigh-density lipoproteins (HDL), elevated triglycerides andabdominal obesity [7]. Lower cutpoints for waist circumference plus additional criteria for body mass index (BMI) andtruncal subcutaneous fat have been recommended as criteria for metabolic syndrome in the Indian populationbased on their predisposition for T2DM and cardiovasculardisease (CVD) [4,8].Lifestyle interventions including exercise have been effective in offsetting T2DM complications and the progression from prediabetes or metabolic syndrome to T2DM[6,9-11]. By modifying muscle fibers and enhancing betacell functions, exercise can optimize insulin sensitivity andimprove glucose intolerance [12,13]. Thus, exercise maybe particularly effective in earlier disease stages and hasbeen associated with a 30% reduction in metabolic syndrome [14] and a T2DM risk reduction of 63-65% inpeople with prediabetes [15].In India there is a rich history of using yoga to manageT2DM [3]. Yoga is a mind/body practice based on traditional Indian philosophy, often incorporating three majorcomponents: held or sequences of physical postures,breathing exercises and meditation [16,17]. Yoga’s energyexpenditure is similar to other low to moderate exercise[18-20] and a recent review found yoga had beneficial outcomes similar to those of moderate exercise in populationswith T2DM [21]. Subsequent to the current pilot study,members of our group completed a trial of n 277 participants in Bangalore, India with T2DM, comparing a yogaprogram aimed at T2DM management with an exerciseprogram of comparable intensity. In that study yoga wassimilar to exercise in terms of reducing FBG, hemoglobinA1c (HbA1c), triglycerides, total cholesterol and very lowdensity lipoproteins (VLDL) [22]. Evidence suggesting thatyoga may also be an effective preventive practice in highrisk populations, such as with prediabetes and/or metabolicsyndrome, is also accumulating [23]. Investigators recentlyconcluded a large randomized controlled trial ofrestorative yoga vs. stretching for participants with metabolic syndrome and found that the yoga group hadsignificant reductions in FBG that were sustained at12 months [24].Additional benefits of yoga include improved exerciserelated self-efficacy [25] quality of life [26] and mood[27,28] all of which are important factors in maintenanceof lifestyle behavior change. Yoga also may have a differenteffect on the sympathetic nervous system (SNS) andhypothalamus-pituitary-adrenal (HPA) axis response tostress compared to other types of exercise. Where otherexercise can stimulate the SNS/HPA axis, yoga may bedown regulating it, shifting to parasympathetic dominanceof the stress response [21,23]. In Nagarathna et al., authorsPage 2 of 14found that yoga was superior to exercise at decreasing theneed for oral hypoglycemia medications, decreasing lowdensity lipoproteins (LDL) and increasing HDL, suggesting a benefit associated with yoga in addition to that ofjust increasing exercise [22].The current pilot study compares yoga to a walking control among Indians in Bangalore over an 8-week intervention period. This study is a product of an internationalcollaboration to share areas of expertise between the SwamiVivekananda Yoga Anusandhana Samsthana (SVYASA) inBangalore, India and the Osher Center for IntegrativeMedicine (OCIM) at the University of California, SanFrancisco (UCSF). The pilot study aimed to establish feasibility based on meeting recruitment, retention and adherence goals and to collect preliminary efficacy data onchanges in T2DM risk factors and psychological well-being.MethodsStudy design and participantsThis was a 1:1 randomized controlled pilot study conducted in Bangalore, India. The study was reviewed andapproved by the research ethics committees at SVYASAand UCSF. Written, informed consent was obtained fromall participants. Figure 1 depicts a flow diagram of studyscreening, enrollment and analysis. Participants were recruited over one week, (October 24, 2004 – November 1,2004) using advertisements placed in primary care anddiabetes clinics, as well as strategic locations throughoutthe city. Advertisements invited individuals with a firstdegree relative with T2DM and interest in participating ina yoga program to contact the study staff to schedule ascreening visit. Individuals were asked to come to up totwo screening visits. The first visit evaluated FBG using aglucometer and finger stick capillary whole blood. Thosewith elevated FBG ( 5.6 mmol/L) at the first visit were invited back for a second screening visit. During the secondscreening visit the glucometer assessment of FBG was repeated to confirm eligibility and an oral glucose tolerancetest (OGTT) was performed. The OGTT used a standard75 gm glucose load dissolved in 300 ml of water ingestedover 5 minutes. Glucose was then measured in laboratory assessments of venous blood. OGTT between 7.8-11 mmol/Lwas in the eligible range. Sixteen percent of participants didnot return for the OGTT two-hour blood draw. Becauseall of these participants had a second FBG measure, thesecond FBG was used for screening purposes rather thanthe OGTT.In addition to having two screening FBG 5.6 mmol/L,inclusion criteria for this study also included: 1) a firstdegree relative with T2DM; 2) age between 30–65 years;and, 3) willingness to participate in an 8-week yoga program. Exclusion criteria included: 1) an inability to provideinformed consent; 2) taking medications associated withinsulin resistance (e.g. glucocorticoids, thiazide diuretics,
McDermott et al. BMC Complementary and Alternative Medicine 2014, 2Page 3 of 14(n 250)Normal FBG 5.6 mmol/L (n 148)Did not return for second screen (n 16)Screen 2: FBG and 75mg OGTT,venous blood (n 86)Normal, FBG 5.6 mmol/L (n 39)Eligible but not consented (n 6)EnrollmentRandomized (n 41)Yoga intervention (n 21)Walking control (n 20)AllocationLost to follow up (n 1)Yoga intervention (n 20)Completers/AnalyzedLost to follow up (n 2)Walking control (n 18)Figure 1 Flow diagram of study enrollment.nicotinic acid, β-blockers); 3) prior diagnosis of diabetes ortreatment with diabetes medications; 4) active liver disease(with AST or ALT 3 times the upper limit of normal); 5)anemia with hemoglobin 85 g/L; 6) pregnant or plans tobecome pregnant during the course of the study; 7) recentmajor trauma or surgery that would interfere with participation; and 8) inability to speak either English or Kannada(the local language in Bangalore). Six participants withborderline FBG screening levels were mistakenly enrolledin the study and randomized. These participants are included in the main intention to treat analysis (ITT), but areexcluded in the per-protocol analysis. The per-protocolanalysis only includes participants meeting the inclusioncriteria of having screening FBG 5.6 mmol/L.Sample size and randomization proceduresBased on this study’s primary feasibility and preliminaryefficacy outcomes, sample size was based on resourcesavailable. Randomization was performed using computergenerated random numbers and group assignments delivered in sealed, opaque envelopes generated by off-sitestudy staff. Participants were not blinded to their groupassignment.InterventionThe yoga group attended a day long (eight hour) groupcounseling session on healthy lifestyle changes with topicson healthy diet, increasing physical activity and smokingcessation. Spouses were invited to attend this group counseling session as well. Participants in the interventiongroup were then asked to attend at least three, and up tosix, yoga classes per week over the eight weeks of the study.Yoga classes were offered on six days of each week. Theclasses were held in a community hall and taught by tworegistered Ayurveda medical practitioners with Masterslevel yoga training from SYVASA. While one instructordemonstrated postures for the class, the other instructoradjusted individual participant’s postures or gave them suitable alternative postures if necessary.The yoga intervention was designed to manage glucoselevels by increasing metabolism, reducing stress and facilitating a positive outlook. In addition, the classes sought toconnect participants with a sense of responsibility andcontrol over their health. Each class lasted 75 minutestotal and had the following components: diabetes and stressmanagement education (10 minutes); breathing exercises(6 min); loosening exercises (10 min); standing poses(8 min); supine poses (8 min); prone poses (8 min); sittingposes (8 min); relaxation/corpse pose (6 min); chanting exercises and seated meditation (10 min) (see Table 1 for amore detailed account of postures). The total active time inposes was approximately 32 minutes. Evidence suggeststhat these poses specifically improve muscle metabolismand stress response [29] and the breathing exercises enhance basal metabolic rate [30,31].The yoga intervention was manualized for this studyand while yoga instructors received detailed instructionfrom study staff on how the class was to be conducted, theyoga classes were not observed by study staff. Participantswere asked to do a home practice if they were unable to
McDermott et al. BMC Complementary and Alternative Medicine 2014, 2Table 1 Yoga class material and asana sequencing1.Didactics—10 minutesPage 4 of 14attend at least three classes in a given week and wereasked to keep track of each home practice in a daily diary.Diabetes causes, complications and lifestyle factorsPrinciples, philosophy, and practices related to a yoga basedlifestyle programStress responseMaladaptive behavior and behavior changeEmotion and coping2.Pranayama (Breathing exercises)—6 minutesHands stretch breathingAnkle stretch breathingTiger breathingRabbit breathing3.Loosening exercises (any 3)—10 minutesMeasuresForward, backward, side bendingPrimary feasibility outcomes were determined by percentof recruitment, retention and adherence goals met. Studystaff blinded to group assignment collected preliminary efficacy data on blood pressure, weight, and waist circumference. Blood pressure was measured as the mean of twomeasures taken five minutes apart using a mercury sphygmomanometer. Measurement of height (performed onlyat baseline) used a standard stadiometer and weight wasmeasured and duplicated on a calibrated scale. Waist circumference was measured at the point of minimal circumference at the level of the uppermost lateral border of theright iliac crest at minimal respiration. In addition to theFBG and OGTT measurements, blood was also drawn fora fasting lipid panel and insulin. LDL was calculated directly. Fasting insulin was assessed using a Roche Automated Chemiluminescence analyzer Cobas e411 and RocheDiagnostic’s insulin kits with an intra assay coefficient ofvariation (CV) of 5.4% and inter assay CV of 6%. We usedthe calculator available through the Diabetes Trials Unit toapply version 2 of the homeostasis model assessment(HOMA) algorithm to calculate insulin resistance [32].Secondary outcomes related to psychological wellbeing included changes in depression, anxiety, positiveaffect, negative affect, and perceived stress. Depressionand anxiety were measured using the Hospital Anxietyand Depression Scale (HADS), a 14-item questionnairethat avoids measuring symptoms such as fatigue thatmay be influenced by diabetes risk factors [33]. Positiveand negative affect were measured using the Positiveand Negative Affect Schedule (PANAS), a 20-item questionnaire designed to assess high activation positiveaffect (e.g. interested, excited, enthusiastic) and high activation negative affect (e.g. upset, irritable, ashamed)[34]. Stress was measured using the Perceived StressScale (PSS), a 10-item instrument asking participantshow often they had positive and negative experiencesrelated to stress in the prior month [35].Pavanamuktasana kriya (Supine knees to chest)Surya namaskara (3 sun salutations)Standing asana (any 3)—8 minutesPadahasthasana (Foot hand)Ardhachakrasana (Half moon)Trikonasana (Triangle)Parshvakonasana (Side angle)Ardhakati chakrasana (Half wheel)Vrikshasana (Tree)6.Supine asana—8 minutesSarvangasana (Shoulder stand)Halasana (Plough)Matsyasana (Fish)Pavanamuktasana (Supine knee chest position)Naukasana (Boat)7.Prone asana—8 minutesBhujangasana I, II , III (Cobra)Shalabhasana – alternate legs, both (Locust)Dhanurasana (Bow)Navasana (Boat)8.Sitting asana—8 minutesPaschimottanasana (Seated forward bend)Vakrasana/ardhamatsyendrasana (Half twist)Ustrasana (Camel)Sashankasana (Rabbit)9.The control group attended the same day long (eighthour) group counseling session on lifestyle changes withtheir spouses. The control group was asked to do 30 minutes of walking plus breaks for rest on three to six daysper week during each of the eight weeks of the study. Including rest breaks, the total time was approximatelyequivalent to the 75 minute yoga class. They were askedto perform their walking in the park adjacent to the community hall where the daily yoga classes were held. Twostudy volunteers monitored control group participants’ attendance at daily walks in the park.JoggingTwisting4.ControlRelaxation Shavasana (Corpse) with guided scan—6 minutes10 Chanting ‘OM’ monosyllables, primordial sounds inIndian philosophy
McDermott et al. BMC Complementary and Alternative Medicine 2014, 2Data analysisWithin group changes and between group treatment effects associated with participation in the yoga interventionwere evaluated using chi-square tests for categorical dataand paired t-tests, independent sample t-tests, andCohen’s d effect sizes (standardized mean difference) forcontinuous data. Change scores were calculated as postintervention minus baseline measurements. Given thepilot nature of this study and the relatively small samplesize, we did not have adequate power to detect statisticallysignificant differences in the case of small or medium effect sizes. To provide a measure of the observed effectsizes, we report Cohen’s d for primary and secondary outcome measures.Three participants dropped out for personal reasons unrelated to the study. Based on this and the randomization,we assumed unobserved outcome data was missing at random (MAR) and therefore conducted two primary analyses.First, we excluded dropouts entirely in a complete-caseanalysis. With outcomes at one follow-up time point,complete case is a valid analysis assuming missing outcomes are MAR [36]. Second, we included dropouts withtheir last observation carried forward (LOCF) to include allrandomized participants for ITT. In this case, the LOCFwas the baseline value for the participant who dropped out.Because participants who dropped out did not completethe study, we also assumed that there was no change intheir unobserved outcomes. Based on these two assumptions, the LOCF analysis provides a more conservative estimate of the within and between group effects [36].We replicated the complete case, between group comparison in a per-protocol analysis, excluding the six participants who did not meet the FBG 5.6 mmol/L inclusioncriteria. We calculated Pearson’s correlation coefficientsto further explore relationships between T2DM risk factors and psychological measures. In addition, based on thewide range of ages among enrolled participants (30–65years) and the concern that a number of T2DM riskfactors would vary based on age we conducted a sensitivityanalysis to specifically examine whether baseline or changescores differed by age group. We considered p 0.05to be statistically significant and all analyses were conducted using Stata Statistical Software: Release 12. CollegeStation, TX: StataCorp LP.ResultsRecruitment, retention and adherence goals to determinefeasibility were all met in this pilot study. We retained 94%of participants, exceeding our goal for feasibility of 75%retention. On average, attendance each week for participants in the yoga group did not differ from attendance inthe control group (4 0.5 yoga classes per week vs. 3.8 0.5 monitored walks per week, p 0.13); however, participants in the yoga group had higher overall attendancePage 5 of 14compared to control (p 0.02). Participants in the yogagroup attended 33.6 4.3 classes over the eight weeks ofthe study, which is equivalent to 70% of the maximum offered (six classes per week) and 140% of the minimum required (three classes per week). This is compared toattendance in the control group of 30.2 4.3 walking sessions, which is equivalent to 63% of maximum walks offered and 126% of minimum walks required.The two groups were similar at baseline. In the yogagroup, the mean age was 47.0 9.7 and 43% of participantswere male compared to the control group where the meanage was 47.2 9.1 and 35% of participants were male(Table 2). In between group comparisons, yoga participantshad significantly greater reductions in weight, waist circumference and BMI versus the walking control participants(weight 0.8 2.1 vs. 1.4 3.6, p 0.02; waist circumference 4.2 4.8 vs. 0.7 4.2, p 0.01; BMI 0.2 0.8 vs.0.6 1.6, p 0.05) (Table 3). There were no significant between group differences in FBG, PPBG, insulin, insulin resistance, blood pressure, cholesterol, or psychologicalmeasures of well-being.There were, however, significant reductions in bloodpressure and total cholesterol within both groups over theTable 2 Baseline for Yoga and control groups as mean SD unless indicatedYogaControl(n 21)(n 20)47.0 9.747.2 9.19 (43)7 (35)Fasting BG (mmol/L)6.4 0.96.7 1.9Postprandial BG (mmol/L)8.3 2.66.8 1.2Age (years)Gender (male), n(%)Diabetes risk factorsBMI (kg/m2)28.4 5.326.9 3.0Weight (kg)69.2 10.865.0 7.6Waist (cm)92.5 7.389.8 7.2Insulin (pmol/L)72.3 30.557.7 30.1Insulin resistance1.4 0.61.1 0.6Systolic (mmHg)122.9 8.3127.6 11.4Diastolic (mmHg)82.2 9.182.3 6.3LDL (mmol/L)2.2 0.52.2 0.8Total cholesterol (mmol/L)5.2 1.25.3 0.8Triglycerides (mmol/L)1.9 0.82.2 1.27.8 5.38.3 5.2Psychological factorsAnxietyDepression6.0 4.06.8 3.8Positive affect24.9 7.722.4 11.2Negative affect15.4 12.717.3 11.6Perceived stress18.2 5.418.0 5.6BG fasting blood glucose; BMI body mass index; LDL low-density lipoproteins.
McDermott et al. BMC Complementary and Alternative Medicine 2014, 2Page 6 of 14Table 3 Change scores within yoga and control, and difference between groups with 95% CI and Cohen's d effect sizeYogaControlDiff. (Yoga-Ctrl)(n 20)(n 18)[95% CI]Pdiff.Cohen’sdDiabetes risk factors0 0.30.3 [ 0.5 to 1.1]0.430.27Postprandial BG (mmol/L)a 0.60.1 0.7 [ 2.4 to 0.9]0.380.37BMI (kg/m2) 0.20.6 0.8 [ 1.6 to 0.0]0.050.68Weight (kg) 0.81.4 2.3 [ 4.1 to 0.4]0.020.80Fasting BG (mmol/L)Waist (cm) 4.2*0.7 4.9 [ 7.9 to 1.9] 0.011.11Systolic (mmHg) 5.3* 5.4*0.1 [ 4.8 to 5.1]0.950.02Diastolic (mmHg) 5.3* 3.6* 1.7 [ 7.6 to 4.1]0.550.20Insulin (pmol/L) 16.74.2 20.9 [ 52.2 to 10.4]0.190.46Insulin resistance 0.30.1 0.4 [ 1.0 to 0.2]0.170.48LDL (mmol/L) 0.10.0 0.2 [ 0.6 to 0.3]0.470.24Total cholesterol (mmol/L) 0.9* 0.7* 0.2 [ 0.9 to 0.6]0.670.15Triglycerides (mmol/L) 0.1 0.10 [ 0.6 to 0.6]0.950.02Anxiety 2.1* 3.4*1.3 [ 0.8 to 3.4]0.220.42Depression 2.5* 3.2*0.7 [ 1.7 to 3.2]0.550.21Positive affect4.8*4.60.2 [ 4.9 to 5.2]0.950.02Psychological factorsbNegative affect 5.0* 8.4*3.4 [ 2.3 to 9.0]0.240.41Perceived stress 5.7* 7.9*2.2 [ 1.3 to 5.8]0.210.43aPostprandial BG was calculated based on available data, yoga n 18 control n 10.Three participants were missing data for psychological factors in the control group.*p 0.05.BG blood glucose; BMI body mass index; LDL low density lipoproteins.8bFasting Blood Glucose (mmol/L)67Between group p 0.43p 0.375p 0.98PrePostYogaFigure 2 Pre/post changes in fasting blood glucose.Control
10McDermott et al. BMC Complementary and Alternative Medicine 2014, 2Page 7 of 14Postprandial Blood Glucose (mmol/L)789Between group p 0.38p 0.256p 0.86PrePostYogaControlFigure 3 Pre/post changes in postprandial blood glucose.waist circumference and BMI continued to be significantand continued to favor the yoga intervention (Table 4).There were significant within group changes in systolicblood pressure in both groups, diastolic blood pressure inthe control group and total cholesterol in the yoga intervention (Table 4). The within group changes in psychological factors in the per-protocol analysis were similar tothose found in the main ITT analyses (Table 4).Younger participants had significantly lower LDL andtotal cholesterol at baseline (30–39 years 1.6 0.5; 40–49years 2.2 0.6; 50–59 years 2.6 0.6, 60 years 2.39 0.4,p 0.013) but there were no differences in change scores30course of the 8-week study (Table 3). Figures 2, 3, 4, 5, 6,7, 8, 9, 10, 11, 12 and 13 illustrate within group changes inT2DM risk factors over time. There were also significantwithin group improvements in anxiety, depression, negative affect and perceived stress in both groups and a significant within group improvement in positive affect inthe yoga group (Table 3). For LOCF analysis, the betweengroup effects were not statistically or substantively different from those reported for the complete case analysis.In the complete case per-protocol analysis, participantswith screening FBG 5.6 mmol/L were excluded (yoga n 3, control n 3). The between group reductions in weight,Body Mass Index (kg/m2)26272829Between group p 0.05p 0.2425p 0.13PrePostYogaFigure 4 Pre/post changes in body mass index.Control
75McDermott et al. BMC Complementary and Alternative Medicine 2014, 2Page 8 of 1470Between group p 0.0265Weight (kg)p 0.0960p 0.11PrePostYogaControlFigure 5 Pre/post changes in weight.95based on age. To explore potential relationships further,we examined correlations between changes in T2DM riskfactors and psychological factors within the yoga group.We found significant correlations among changes in negative affect and PPBG (r 0.49, p 0.03) and changes inperceived stress and total cholesterol (r 0.47, p 0.04).We also saw trends for correlations between changes indepression and PPBG (r 0.46, p 0.06); positive affectand insulin (r 0.40, p 0.08); perceived stress and BMI(r 0.42, p 0.06); perceived stress and weight (r 0.43,p 0.06); and positive affect and insulin resistance (r 0.42, p 0.07).DiscussionBoth the yoga intervention and walking control groups inthis study exceeded recruitment, retention and adherencegoals, meeting feasibility criteria. We found a significantdecrease in weight, BMI and waist circumference in theyoga group compared to the walking control, however wedid not see a decrease in FBG, PPBG, insulin, insulin resistance, blood pressure, or cholesterol. We did find significant within group decreases in blood pressure andtotal cholesterol in both yoga and walking control groupsas well as within group improvements in measures of psychological well-being.Between group p 0.01Waist Circumfrence (cm)8590p 0.4880p 0.01PrePostYogaFigure 6 Pre/post changes in waist circumference.Control
McDermott et al. BMC Complementary and Alternative Medicine 2014, 2130Page 9 of 14Systolic Blood Pressure (mmHg)120125Between group p 0.95p 0.01115p 0.01PrePostYogaControlFigure 7 Pre/post changes in serum insulin.lacked power to detect small to medium FBG changes.Over time, improvements in weight and waist circumference could yield additional improvements in FBG andrelated measures.While both groups had statistically significant withingroup improvements in measures of psychological wellbeing, there were no significant differences betweengroups. The control group likely experienced significantimprovement in psychological well-being based on thewalking that they were asked to participate in three to sixdays a week. While we had initially hypothesized that theyoga would improve mood based on a number of factors,85In the yoga group, positive changes in weight, BMIand waist circumference are similar to other reports inthe literature [23,25,37], while the lack of within groupchange in FBG is contrary to other reports in similarhigh risk populations [23,24]. In the per-protocol analysis we excluded participants with very low baselineFBG (those in the normal range) and still saw no changein FBG. Our null results were similar to another smallstudy of yoga for high risk individuals (those with a firstdegree relative with T2DM plus one of the following: impaired FBG, prehypertension, obesity, or abnormal cholesterol) [25] supporting the notion that we may haveDiastolic Blood Pressure (mmHg)77798183Between group p 0.55p 0.0475p 0.03PrePostYogaFigure 8 Pre/post changes in insulin resistance.Control
100McDermott et al. BMC Complementary and Alternative Medicine 2014, 2Page 10 of 14Insulin (pmol/L)708090Between group p 0.1960p 0.750p 0.15PrePostYogaContro
Type 2 diabetes mellitus (T2DM) is a major global health problem with a prevalence of 366 million in 2011 that is projected to increase by 51%, reaching 552 million by 2030 [1,2]. India follows this global trend with a preva-lence of 60 million in 2011 that is projected to increase by 63%, reaching 98 million by 2030 [1]. Factors contributing