Transcription
Financial Analysts JournalISSN: 0015-198X (Print) 1938-3312 (Online) Journal homepage: https://www.tandfonline.com/loi/ufaj20An Empirical Evaluation of Tax-Loss-HarvestingAlphaShomesh E. Chaudhuri, Terence C. Burnham & Andrew W. LoTo cite this article: Shomesh E. Chaudhuri, Terence C. Burnham & Andrew W. Lo (2020) AnEmpirical Evaluation of Tax-Loss-Harvesting Alpha, Financial Analysts Journal, 76:3, 99-108, DOI:10.1080/0015198X.2020.1760064To link to this article: shed online: 30 Jun 2020.Submit your article to this journalArticle views: 587View related articlesView Crossmark dataFull Terms & Conditions of access and use can be found ation?journalCode ufaj20
Financial Analysts Journal A Publication of CFA 0064ResearchAn Empirical Evaluationof Tax-Loss-HarvestingAlphaShomesh E. Chaudhuri , Terence C. Burnham , and Andrew W. LoShomesh E. Chaudhuri is chief technology officer of QLS Advisors, Cambridge, Massachusetts. Terence C. Burnham is an associate professorat George L. Argyros School of Business and Economics, Chapman University, Orange, California. Andrew W. Lo is the Charles E. andSusan T. Harris Professor at Sloan School of Management and director of the Laboratory for Financial Engineering, Massachusetts Instituteof Technology (MIT), Cambridge, Massachusetts; Electrical Engineering and Computer Science Department, MIT; Computer Science andArtificial Intelligence Laboratory, MIT; Santa Fe Institute, Santa Fe, New Mexico.Advances in financial technologyhave made tax-loss harvestingmore feasible for retail investorsthan such strategies were in thepast. We evaluated the magnitudeof this “tax alpha” with the useof historical data from the CRSPmonthly database for the 500securities with the largest marketcapitalizations from 1926 to 2018.Given long-term and short-termcapital gains tax rates of 15% and35%, respectively, we found thata tax-loss-harvesting strategyyielded a before-transaction-costtax alpha of 1.08% per year for oursample period. When the strategywas constrained by the “wash salerule,” the tax alpha decreased from1.08% per year to 0.82% per year.Tax-loss harvesting is a strategy of closing losing positions insecurities with the goal of generating capital losses that can beused to reduce taxes. Prior academic work has described theunderlying logic of tax-loss harvesting and calculated the effectivealpha that can be derived from such a strategy (Garland 1987; Steinand Narasimhan 1999; Arnott, Berkin, and Ye 2001; Berkin and Ye2003). For example, using simulated securities, Arnott et al. reportedthat a tax-aware portfolio outperformed a similar buy-and-hold portfolio by a total of 27% over a 25-year period.When these earlier papers were published, there were two barriers to the widespread implementation of tax-loss harvesting. First,transaction costs in the form of commissions and bid–ask spreadswere relatively high. Second, administrative costs involved in keepingtrack of trades and producing the correct filings were also relativelyhigh. As a consequence, a paper from this earlier period argued thatrecognizing tax alpha is “easier said than done” (Jeffrey 2001). Becauseof these costs, tax-advantaged trading was primarily undertaken bytaxable entities, both institutional and individual, with large accountsfor which the fixed costs of this strategy created a smaller percentagedrag on the portfolio.In the decades since this original work, however, the costs associatedwith trading have declined significantly. For example, commissionshave experienced a persistent decline and are zero at some firms(e.g., Charles Schwab). With the advent of decimalization, bid–askDisclosure: The authors report noconflicts of interest.PL Credits: 2.0Volume 76 Number 3Research support from the MIT Laboratory for Financial Engineering is gratefully acknowledged. We thank Anton Anastasov for excellent research assistance; Tom Brennan, LisaGoldberg, and Nathan Sosner for helpful comments and discussion; and Jayna Cummingsfor editorial assistance. The manuscript was improved by the editors of the FinancialAnalysts Journal, Stephen J. Brown and Steven Thorley, CFA. The views and opinionsexpressed in this article are those of the authors only and do not necessarily represent theviews and opinions of any other organizations, any of their affiliates or employees, or anyof the individuals acknowledged above. 2020 CFA Institute. All rights reserved. 99
Financial Analysts Journal A Publication of CFA Institutespreads have also declined significantly. Finally,the overall decline in computing costs has madeexecution and recordkeeping of trades much lessexpensive than in the past. A tax-alpha strategy isnow practical for entities with much smaller accountsthan before (Stein and Garland 2008).These decreasing costs have led to a number ofnew “fintech” startup firms that market tax-lossharvesting strategies to entities with accountbalances below 100,000. The fintech companies,often called “robo-advisors,” advertise a significanttax alpha for the investor. The firms both solicit fundsthrough their tax-alpha claims and run live portfoliosfor clients.Although the decline in costs has made tax-awareinvesting more favorable, other trends in investingare moving in the opposite direction. Investors havemoved toward passive investing via mutual fundsand exchange-traded funds (ETFs). Mutual funds arebarred from passing through security-level tax losses.Similarly, index-tracking ETFs are not designed toharvest tax losses.With tax-aware investing becoming more costeffective, we believe it will, consequently, becomemore important for investors. In fact, the benefitsof harvesting losses may now be large enough toslow or reverse the powerful trend toward passiveinvesting.Given this possibility, we returned to the earlier academic work on tax-loss harvesting. Using simulatedreturns, we replicated the prior academic analysesand extended that work by using historical data forUS equities broken down into important subperiods.We found that tax alpha was important in the historical US data but that it varied strongly in differenttime periods. Furthermore, we found that becausethe alpha from loss harvesting comes from the abilityto use capital losses to offset capital gains derivedfrom other activities, tax alpha is highest in periodswhen investors are least likely to be able to use thecapital losses to reduce taxes.MethodsThe primary contribution of this article is anexamination of the value of tax-loss harvestingusing historical returns. Therefore, we used thesame methods as earlier studies that used simulatedsecurity returns (e.g., Berkin and Ye 2003). LikeBerkin and Ye, we made a number of assumptions100 when implementing a simulated tax-loss-harvestingstrategy. First, we assumed that the transaction costswere negligible and that securities could be tradedwith no market frictions. Under these assumptions,tax-loss harvesting realized losses whenever the market price of a holding fell below its cost basis, wherethe cost basis was determined by highest in, first out(HIFO) accounting. This assumption should not havehad a significant impact on the results of our analysisbecause our assumptions approximate trading highlyliquid, large-capitalization securities. Note, however,that an actual implementation would harvest lossesonly if they exceeded a threshold defined by marketfrictions, especially in illiquid markets.Second, in our initial analysis, we assumed that thetax-loss-harvesting strategy was not constrained bythe “wash sale rule,” and thus shares that had beensold at a loss could be repurchased immediately.1Although this assumption likely overstated thebenefits of loss harvesting, its effect should havebeen marginal because a stock with similar returncharacteristics could be purchased, in practice,albeit with greater tracking error. Indeed, when weapplied the wash sale rule and assumed the proceedsfrom harvesting losses remained in cash for onemonth before those securities were repurchased,the average annualized tax alpha across the entirehistorical sample, from 1926 to 2018, decreasedfrom 1.08% to 0.82%.Third, we assumed that the tax credit created by harvesting losses could be treated as a cash inflow thatcould immediately be reinvested into the portfolio.This assumption is reasonable because the tax savings of harvesting losses, especially when applied toquarterly tax estimates, provide a nearly contemporaneous cash flow benefit. The money saved frompaying lower taxes remains available for continuedinvestment.Fourth, we confined our attention to long-onlystrategies, although we acknowledge that, in practice, sophisticated investors may be able to achievegreater tax-loss harvesting than our estimatesindicate. A series of papers showed that adding shortpositions increases the tax alpha (Means 2002; Farr2004; Gallmeyer, Kaniel, and Tompaidis 2006; Berkinand Luck 2010; Sialm and Sosner 2018). For example,Berkin and Luck wrote, “Extended mandates areespecially effective for investors subject to taxes”(p. 33). Few retail investors engage in active shortselling, however, and our goal was to gauge the benefits of tax-loss harvesting for the broadest population of individuals, not high-net-worth long–shortThird Quarter 2020
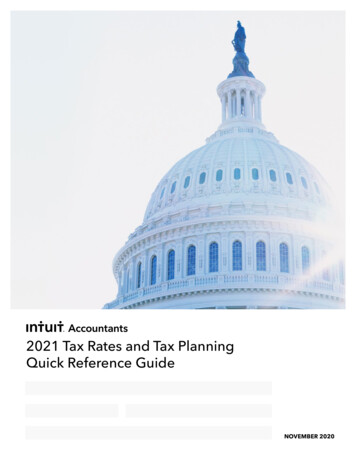
equity hedge fund investors, who have many taxoptimization channels, including offshore funds,low-tax “opportunity zones,” and various charitablegifting and estate-planning structures.Finally, we applied a marginal tax rate of 35% to allshort-term capital gains and a 15% tax rate to alllong-term capital gains and dividends. (Actual UStax rates varied dramatically during the time periodof our analysis.) Because long-term capital gains areoften taxed at lower rates than short-term gains,tax-loss harvesting can improve a portfolio’s performance by shifting the realization of losses toward theshort term. This step effectively reduces the amountof highly taxed short-term capital gains as a fractionof the total capital gains. To study the strategy’sperformance when the investor cannot affect thetax character of the gains, we also applied a constantmarginal tax rate of 35% to all gains.Although we varied tax rates between analyses, eachindividual analysis used a constant set of tax ratesthroughout the entire time period. An additionalanalysis that we considered involved combining thehistorical return data with historical tax regimes,which could provide insights into the actual taxalpha that could have been obtained by investorsover the period of our analysis going back to 1926.Such analyses would rely on a detailed understanding of the tax code in many different regimes,however, and, therefore, were beyond the scope ofthis work.In our simulation, we used the same methodology asBerkin and Ye (2003). Each month, we liquidated alltax lots that had losses and then immediately repurchased the same number of shares. We aggregatedthe tax credits from any harvested losses with thetax obligations from dividends and realized capitalgains, and we reinvested the net cash flow back intothe portfolio. In the event of a net cash outflow, thetax lots with the highest cost basis, as determinedby the HIFO accounting strategy, were sold first.Because our interest was quantifying the after-taxreturns of the fund following tax-loss harvesting invarious historical market conditions, we tracked theportfolio’s net value after subtracting any deferredtaxes that had not yet been realized. As Berkin andYe pointed out, this value is defined as the net-of-taxliquidation value of the portfolio.We extracted stock return data with and withoutdividends from the University of Chicago’s CRSPmonthly database. Only US common stocks wereincluded, which eliminated real estate investmentAn Empirical Evaluation of Tax-Loss-Harvesting Alphatrusts, American Depositary Receipts, and someother types of securities.We applied tax-loss harvesting to a portfolio ofthe 500 largest securities by market cap from July1926 through June 2018. The constituents of thismarket cap–weighted index were rebalanced on thefirst trading day of each month. When a stock wasremoved from the index, it was replaced with a newindex constituent.For this 92-year sample period, we calculated theperformance history of tax-loss harvesting for fournonoverlapping 23-year subperiods: 1926–1949,1949–1972, 1972–1995, and 1995–2018. Each subperiod begins on the first trading day in July and endson the last trading day of June. These subperiodswere chosen to illustrate various market conditions—from economic recession and financial turbulence toeconomic expansion and reduced volatility.We assumed counterfactually, however, that themarginal tax rates on dividends and short- and longterm capital gains remained constant throughoutthese periods. The primary goal of this study was toexplore the value of tax-loss harvesting under current US tax regulations by using historical returns tosample various market conditions.ResultsWe validated our methods by first replicating theresults of Berkin and Ye (2003). Then, we extendedthe analysis by using the same portfolio constructionand measurement but with historical returns insteadof simulated returns.Our measure of performance was the portfolio’sannualized alpha after liquidation taxes. This metricwas calculated as the return on the tax-advantagedportfolio minus the return on the passive benchmarkportfolio, which did not implement loss harvesting. We formed monthly returns by subtracting theinvestor’s cash contribution from the end-of-monthafter-tax-liquidation value of the portfolio, then dividing the result by the initial portfolio value. In the basescenario, we assumed investor deposits were equalto 1% of the gross benchmark portfolio value permonth. For completeness, we report performancestatistics that include the annualized alpha of lossharvesting before liquidation taxes.We accumulated the returns for each portfoliogeometrically and show the plots for each of thefour subperiods in Figure 1. We found that tax-lossVolume 76 Number 3 101
Financial Analysts Journal A Publication of CFA InstituteFigure 1. CumulativeReturns of the TaxAdvantaged andBenchmark Portfoliosfor Four SubperiodsCumula ve Return (%)A. 1926–19491684Tax-Advantaged Por olio2Benchmark1026283032Cumula ve Return (%)163436384042444648B. 1949–1972Tax-Advantaged Por olio8Benchmark421049515355Cumula ve Return (%)5759616365676971C. 1972–1995168Tax-Advantaged Por olio4Benchmark21072747678Cumula ve Return (%)8082848688909294D. 1995–2018168Tax-Advantaged Por olio4Benchmark2101995 97102 99 2001 0305070911131517Third Quarter 2020
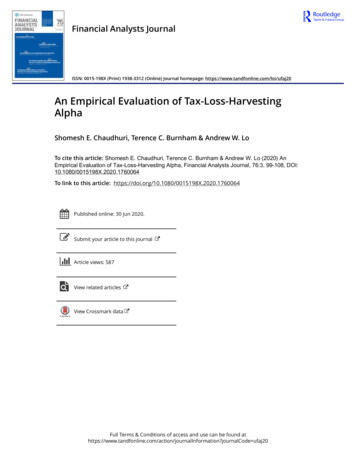
An Empirical Evaluation of Tax-Loss-Harvesting Alphaharvesting improved the after-tax returns during each subperiod but its performance variedsubstantially according to market conditions. Notsurprisingly, the strategy performed well when stockreturns were highly volatile and there were moreopportunities to harvest losses. In contrast, the strategy closely tracked the benchmark’s performanceduring periods of reduced volatility and economicexpansion. Table 1 reports the summary statistics forthe monthly returns of the tax-advantaged portfolio.During the 1926–1949 subsample, which includesthe Great Depression and its subsequent recovery, Table 1 reports that the average annualizedalpha was an impressive 2.13%. Conversely, duringthe post–World War II economic expansion, the1949–1972 subperiod, the average annualized alphawas a modest 0.51%. Finally, the 1972–1995 and1995–2018 periods fell between those extremes offinancial turbulence and moderation. Consequently,their average annual alphas were, respectively, 1.08%and 0.81%.To examine these dynamics more closely, wecalculated the 12-month moving average of thetax-advantaged portfolio’s annualized alpha duringthe 1926–1949 period. This graph is provided inPanel A of Figure 2. We also computed the rollingdistribution of normalized prices for our benchmark index of large-cap stocks, which is providedin Panel B of Figure 2. Normalizing prices sets allthe prices to 1.0 at the start of the period. It allowseffective visualization of volatility.As shown in Panel A of Figure 2, the tax-advantagedportfolio outperformed the benchmark portfolioduring the price declines between 1929 and 1932.This result is understandable because the tax-lossharvesting tilts the balance of losses toward theshort term, reducing the amount of highly taxedshort-term capital gains as a fraction of total capitalgains. This effect outweighs the fact that as pricesdeclined, the benchmark portfolio benefitted fromhaving a higher cost basis once liquidation taxes weretaken into account.As prices recovered from their 1932 nadir, thetax alpha increased substantially. Because thebenchmark portfolio did not harvest losses during the decline, the tax credits that augment theTable 1. Annualized Alpha of the Tax-Advantaged Portfolio and Summary Statisticsof the Monthly Returns of the Benchmark PortfolioPer rkMeanBenchmarkStd. Dev.BenchmarkAvg. CSDBenchmarkMax. DDAfter liquidation .644.98%26.56%6.85%83.42%Before liquidation 20181.4625.859.5617.955.7483.42Notes: “Annualized Alpha” is the annualized alpha of the tax-advantaged portfolio relative to the benchmark portfolio. “AnnualizedTurnover” is the one-sided annualized turnover of the tax-advantaged portfolio. “Benchmark Mean” indicates the average annualizedreturn of the benchmark portfolio. “Benchmark Std. Dev.” indicates the annualized standard deviation of returns of the benchmarkportfolio. “Benchmark Avg. CSD” is the average cross-sectional dispersion of the returns of the benchmark portfolio’s constituents,where dispersion is measured by the absolute deviation. “Benchmark Max. DD” is the maximum drawdown of the benchmark portfolio.Volume 76 Number 3 103
Financial Analysts Journal A Publication of CFA InstituteFigure 2. MovingAverage of the TaxAdvantaged Portfolio’sAnnualized Alpha andNormalized Pricesof Securities in theBenchmark Portfolio,1926–1949A. Twelve-Month Moving Average of theTax-Advantaged Por olio’s Annualized AlphaAnnualized Alpha (%)302520151050–5262830323436384042444648B. Deciles of the Normalized Prices of Securi es in the Benchmark Por olioNormalized Price (US )654321026283032liquidation value of a tax-advantaged portfolio,especially in a rising market where the benefit iscompounded, were never realized. As a result, thetax-advantaged portfolio substantially outperformedthe passive benchmark during the recovery period.This effect was strengthened during this periodbecause of the extreme nature of the price fluctuations. In particular, almost all stocks fell below theirinitial normalized cost basis of 1 during the pricedecline. Similar dynamics can be observed overthe course of subsequent business cycles, but to alesser extent.Of course, this result assumes that investors haveother short-term gains to offset, and in an environment with few gains, like that of the GreatDepression, the value from harvesting losses wouldhave to be carried forward to offset future gains.Often, the amount of loss that can be carried forwardor deducted against ordinary income is limited, whichwould decrease the overall benefit of harvesting104 3436384042444648losses early. These risks are only compounded oncetransaction costs and regulatory constraints (such asthe wash sale rule) are imposed on the portfolio.The Impact of Transaction Costs.Corwinand Schultz (2012) estimated that the averagebid–ask spread for a large-cap US stock is 50 basispoints (bps). We used this bid–ask spread to examinethe transaction costs caused by turnover for ourportfolio. (The large-cap cost is appropriate for thisstudy because we focused on the 500 largest stocks.)If the midpoint of the bid–ask spread is assumed torepresent fair value and each trade is assumed to besmall enough to have a negligible price impact, thenany one buy or sell would incur a cost of 25 bps.A swap of one security for another would incur twosuch costs, for a total of 50 bps.Using this transaction cost estimate and approach,we calculated that every 1% of annual turnoverwould create 0.5 bp of transaction cost. AcrossThird Quarter 2020
An Empirical Evaluation of Tax-Loss-Harvesting Alphathe entire 1926–2018 time period, we report anaverage annual alpha of 108 bps and average turnover of 25.85%. With 26% annual turnover, using0.5 bp per 1% of turnover would subtract 13 bps toyield approximately 95 bps of annual alpha net oftransaction costs.Applying a Constant Marginal Tax Rate.Table 2 reports the tax alpha when a constantmarginal tax rate is applied across all capital gains,both short-term and long-term, and dividends. In thiscase, the tax advantage from tilting the balance oflosses toward the short term is reduced because bothlong- and short-term capital gains are taxed at thesame rate. For example, the annualized tax alpha forthe entire period decreased from 1.08% to 0.53%when the long-term capital gains tax rate increasedfrom 15% to 35% and the short-term capital gainstax rate was held constant at 35%. Harvesting lossesstill provides positive alpha, however, because the taxcredits the losses generate, even when short-termlosses are used to offset long-term gains, compoundover time in rising markets. As prices increase, thesecompounded tax credits counterbalance and exceedthe benefit the benchmark portfolio gains from havinga higher cost basis once liquidation taxes are takeninto account.Sensitivity Analysis.We also studied thereturns of the tax-advantaged portfolio in a widerange of market conditions and examined the effectof portfolio-specific factors and tax regulations onthe performance of the strategy. In this section,we consider the impact of three of these factors:the rate of investor cash contributions, differentTable 2. Annualized Alpha of Tax-LossHarvesting Strategy for ConstantMarginal Tax Rates Applied to AllCapital GainsConstant Marginal Tax 180.190.310.401926–20180.320.530.69Note: Alpha is reported per year.combinations of marginal tax rates on long- andshort-term capital gains, and the wash sale rule.In addition to our analysis of historical data, we alsocarried out a series of Monte Carlo simulations inwhich asset returns followed the capital asset pricingmodel (CAPM) of Sharpe (1964) and Lintner (1965).Specifically,ri rf βi (rm rf ) εi ,(1)whereri the return on asset irf the risk-free rateβi the sensitivity of asset i to market fluctuationsrm the return on the marketεi the idiosyncratic component of riLike Berkin and Ye (2003), we used historical valuesto calibrate the model. The risk-free rate was fixed at0.28% per month, and the expected market returnwas set to 0.94% with a monthly volatility of 5.32%.The betas were drawn randomly from a normaldistribution with mean 1 and standard deviation 0.3truncated at 0.1 and 3, and the dividend yield andidiosyncratic volatility were set to 0.12% per monthand 9% per month, respectively. We simulated a500-asset portfolio for 92 years (i.e., 1926–2018) andassumed index composition turnover of one securityeach month. We repeated this process 1,000 timesto estimate the median annualized alpha.As shown in Table 3, the performance of the taxloss-harvesting strategy can be substantially affectedby the rate of investor transfers into and out of theportfolio. As capital flows into the portfolio, newshares need to be bought, generally at a higher costbasis than the shares already in the portfolio. Thissituation provides the strategy with more opportunities to harvest losses and generate tax credits. Inaddition, the higher cost basis has a nonlinear effecton the relative liquidation value of the tax-advantaged and benchmark portfolios. The results in Table3 show that the combination of these effects is suchthat the tax alpha generally increases with contributions in all market environments. On average, theresults for the entire historical period closely matchthe CAPM simulated results.We also considered the effect of varying the shortterm capital gains tax rate between 20% and 50%Volume 76 Number 3 105
Financial Analysts Journal A Publication of CFA InstituteTable 3. Annualized Alpha of Tax-LossHarvesting Strategy for VaryingRates of Investor CashContributions–1% perMonthPeriod0% perMonth1% perMonth2% M0.450.501.161.46Notes: Alpha is reported per year. Deposits are a percentage of thegross benchmark portfolio value per month. A negative cash contribution rate denotes investor withdrawals. For the Monte Carlosimulated CAPM results, the median annualized alpha is reported.and the long-term rate between 0% and 30%. Ineach of these analyses, we used the same tax ratethroughout the entire time period. (A possibleextension would be to vary the tax rates acrossthe sample and use historical tax rates.) Table 4reports the results for three short-term/long-termrate combinations. Note that the tax alpha increasesmonotonically with the tax rate for all subperiods andthe CAPM simulation. The annualized tax alpha forthe most recent period (1995–2018) increased from0.63% in the 20% short-term/0% long-term case to0.98% in the 50% short-term/30% long-term case.This tax alpha is substantial and over time could havea considerable impact on the portfolio’s value.Finally, we constrained the tax-loss harvesting bythe wash sale rule and assumed the proceeds fromharvesting losses remained in cash for one monthbefore those securities could be repurchased. Inpractice, the investor could purchase a stock withsimilar return characteristics immediately rather thanholding the receipts in cash, so this implementationprovides a lower bound on performance. As Table 5shows, under this conservative assumption, the average annualized tax alpha across the entire historicalsample, 1926–2018, decreased from 1.08% to 0.82%.Furthermore, if 0.13% was subtracted for transaction costs and the strategy conformed to the washsale rule, the tax alpha for the whole sample perioddropped to 0.69%.DiscussionThis study is an update and extension to prioracademic work on tax alpha strategies. Unlike earlierstudies, which used simulated returns to model taxaware strategies, ours used historical US returns toextend the conclusions. We reported that tax alphaexists in a wide variety of real market conditions.After dividing the data into four historically relevanttime periods and a relatively small number of marketregimes, we reported finding positive tax alpha ineach period.In our original analysis, we ignored the wash salerule. In a live portfolio, however, an investor wouldTable 4. Annualized Alpha of Tax-Loss-Harvesting Strategy for VaryingCombinations of Short-Term and Long-Term Capital Gains Tax RatesTax RateShort-Term 20%,Long-Term 0%Short-Term 35%,Long-Term erm 50%,Long-Term 30%Notes: Alpha is reported per year. For the Monte Carlo simulated CAPM results, the median annualizedalpha is reported.106 Third Quarter 2020
An Empirical Evaluation of Tax-Loss-Harvesting AlphaTable 5. Annualized Alpha of the Tax-LossHarvesting Strategy with andwithout the Wash Sale RulePeriodWithout WashSale RuleWith WashSale 2CAPM1.160.98Notes: Alpha is reported per year. For the Monte Carlo simulated CAPM results, the median annualized alpha is reported.With the wash sale rule, the proceeds from harvesting lossesremained in cash for one month before those securities wererepurchased.have to honor the wash sale rule; instead of reinitiating the same position, the investor would have tobuy a different security with similar characteristicsand a high return correlation with the sold security.Honoring the wash sale rule introduces some tracking error between the portfolio and the benchmark.The equity market regimes can be characterized bythree market attributes related to tax-loss harvesting.The first attribute is the geometric mean return forthe market. In general, the higher the market return,the lower the investor’s ability to find losses toharvest. The second attribute is the volatility of themarket. The higher the volatility of the market, themore losses exist for the investor to harvest.The third attribute is the cross-sectional dispersionof the individual security returns. Again, the higherthe dispersion, the greater the opportunity fortax-loss harvesting. Thus, the ideal environment forgenerating tax credits through tax-loss harvestingis a volatile stock market with high dispersion andlow overall market returns. If this period of marketturbulence is followed by a recovery period with highreturns, the benefit of harvesting earlier losses iscompounded. In the historical data, the period from1926 to 1949 had exactly the characteristics thatwould be predicted to generate high tax alpha, andthis period did indeed generate the highest annualalpha in our analysis.Tax-loss harvesting yielded substantial value in thehistorical US data from 1926 to 2018: a geometricaverage of 1.08% in tax alpha per year and a positivetax alpha in every subperiod that we examined.Three caveats need to be kep
tax obligations from dividends and realized capital gains, and we reinvested the net cash flow back into the portfolio. In the event of a net cash outflow, the tax lots with the highest cost basis, as determined by the HIFO accounting strategy, were sold first. Because our interest was quantifying the after-tax