Transcription
Forreryd et al. BMC Genomics 2014, 9RESEARCH ARTICLEOpen AccessEvaluation of high throughput gene expressionplatforms using a genomic biomarker signaturefor prediction of skin sensitizationAndy Forreryd, Henrik Johansson, Ann-Sofie Albrekt and Malin Lindstedt*AbstractBackground: Allergic contact dermatitis (ACD) develops upon exposure to certain chemical compounds termedskin sensitizers. To reduce the occurrence of skin sensitizers, chemicals are regularly screened for their capacity toinduce sensitization. The recently developed Genomic Allergen Rapid Detection (GARD) assay is an in vitroalternative to animal testing for identification of skin sensitizers, classifying chemicals by evaluating transcriptionallevels of a genomic biomarker signature. During assay development and biomarker identification, genome-wideexpression analysis was applied using microarrays covering approximately 30,000 transcripts. However, themicroarray platform suffers from drawbacks in terms of low sample throughput, high cost per sample and timeconsuming protocols and is a limiting factor for adaption of GARD into a routine assay for screening of potentialsensitizers. With the purpose to simplify assay procedures, improve technical parameters and increase samplethroughput, we assessed the performance of three high throughput gene expression platforms - nCounter ,BioMark HD and OpenArray - and correlated their performance metrics against our previously generatedmicroarray data. We measured the levels of 30 transcripts from the GARD biomarker signature across 48 samples.Detection sensitivity, reproducibility, correlations and overall structure of gene expression measurements werecompared across platforms.Results: Gene expression data from all of the evaluated platforms could be used to classify most of the sensitizersfrom non-sensitizers in the GARD assay. Results also showed high data quality and acceptable reproducibility forall platforms but only medium to poor correlations of expression measurements across platforms. In addition,evaluated platforms were superior to the microarray platform in terms of cost efficiency, simplicity of protocols andsample throughput.Conclusions: We evaluated the performance of three non-array based platforms using a limited set of transcriptsfrom the GARD biomarker signature. We demonstrated that it was possible to achieve acceptable discriminatorypower in terms of separation between sensitizers and non-sensitizers in the GARD assay while reducing assay costs,simplify assay procedures and increase sample throughput by using an alternative platform, providing a first steptowards the goal to prepare GARD for formal validation and adaption of the assay for industrial screening ofpotential sensitizers.Keywords: Genomic biomarker signature, GARD, Microarrays, nCounter , BioMark HD , OpenArray * Correspondence: Malin.lindstedt@immun.lth.seDepartment of Immunotechnology, Lund University Medicon, Village 406,Scheelevägen 2, 223 81 Lund, Sweden 2014 Forreryd et al.; licensee BioMed Central Ltd. This is an Open Access article distributed under the terms of the CreativeCommons Attribution License (http://creativecommons.org/licenses/by/2.0), which permits unrestricted use, distribution, andreproduction in any medium, provided the original work is properly credited. The Creative Commons Public DomainDedication waiver ) applies to the data made available in this article,unless otherwise stated.
Forreryd et al. BMC Genomics 2014, 9BackgroundAllergic contact dermatitis (ACD) is characterized byredness of the skin, accompanied by periodic and recurrent episodes of itching [1]. The disease is a type IV delayed type hypersensitivity reaction initiated and mediatedby cytotoxic CD8 T cells and CD4 Th1 cells [2] and develops upon repeated or prolonged exposure to contact allergens [3]. With a prevalence of 15-20% [4,5], ACD hasrapidly become a major occupational and environmentalhealth problem [6,7]. ACD is a chronic condition and therecommendation to affected individuals is complete avoidance of inducing contact allergen [3].Contact allergens capable of inducing ACD are termedskin sensitizers. An important group of skin sensitizersare chemical compounds present in common householdproducts such as cosmetics and personal care products.To limit and control the use of sensitizers in such products, chemicals are regularly screened for their capacity toinduce sensitization. Historically, such assays have reliedexclusively on animal experimentation, with the murinelocal lymph node assay (LLNA) [8] being the preferredmethod. However, as of March 2013, an EU legislation [9]imposed a ban on the use of animals for safety assessmentof cosmetic products, regardless of the availability of nonanimal test as an alternative to animal testing. Thus, thedemand for alternative in vitro methods for prediction ofchemical sensitization is urgent.Recently, we developed the Genomic Allergen RapidDetection (GARD) assay, a novel alternative to animaltesting for identification and risk assessment of humanskin sensitizing chemicals using a predictive genomicbiomarker signature termed the GARD prediction signature (GPS) [10]. The GPS was established using a panelof reference chemicals comprising 18 well known sensitizers and 20 non-sensitizers. By stimulating the myeloidcell line MUTZ-3 with the panel of reference chemicals,we were able to identify the 200 most potent discriminatory transcripts between non-sensitizers and sensitizers.The information given by differentially expressed transcripts in the GPS was used to train a support vector machine model (SVM) [11]. Subsequently, the SVM model isused for classification of unknown chemical compoundsas either sensitizers or non-sensitizers.The technical format currently used for transcriptional analysis in the GARD assay is Affymetrix wholetranscriptome microarrays. The array platform has beenvaluable during assay development to identify differentially regulated genes in the GPS from the entire transcriptome, yet it suffers from drawbacks in terms of lowsample throughput, high cost per sample and time consuming protocols. Furthermore, the microarray platformhas known limitations in terms of sensitivity, reproducibility and dynamic range [12-15]. For an in vitro methodto be used for regulatory purposes and eventually forPage 2 of 17industrial screening of sensitizers, it needs to be validatedaccording to internationally recognized procedures [16].With the purpose to prepare GARD for formal validationunder the supervision of The European Union ReferenceLaboratory for alternatives to animal testing (EURL ECVAM),and in order to simplify assay procedures, improve technicalparameters and increase sample throughput, the GARDassay would benefit from a technical platform transfer.The number of available technologies for high throughputquantitative transcriptome analysis is steadily increasing,but only a handful of comparisons between gene expressions measurements on various platforms exist. Thus,there is a need to evaluate and compare results obtainedfrom the various technologies to assess reliability and biological significance of measurements. We performed a systematic head to head comparison to assess the performanceof three of the most prominent high throughput gene expression platforms, including the nCounter analysis system (NanoString technologies) [17], BioMark HD system (Fluidigm corporation) [18] and the OpenArray system (Life Technologies ) [19]. The nCounter analysissystem is a novel hybridization based technology enablinggene expression measurements to be performed directlyfrom cell lysate. The technology use transcript specificcolor coded molecular probe pairs to capture andcount individual transcripts and has several advantagesin comparison to microarray platform including easy protocols, less hands-on time and higher sample throughput[17]. BioMark HD and OpenArray are RT-qPCR basedtechnologies which is considered as the gold standard forquantitative transcription analysis due to its high sensitivity, high reproducibility and large dynamic range [19-21].RT-qPCR is however a low throughput technology in itsconventional format. Utilizing slightly different strategies,both BioMark HD and the OpenArray system providestechnologies that aims to conserve the intrinsic analyticalbenefits of the conventional RT-qPCR while enabling geneexpression measurement in a high throughput format[22]. Both systems use streamlined protocols that enableprogression from cDNA into results in less than threehours for the OpenArray system and less than sevenhours for the BioMark HD system. In this report, wepresent a per application relevant comparison and evaluation of the nCounter , BioMark HD and the OpenArray platforms in the context of the GARD assay. This report isnot intended to serve as a general recommendation of aparticular platform, but rather to investigate the trade-offsin terms of price, throughput, protocols, analytical performance and applicability of a selection of high throughput platforms for the GARD assay. Primary focuses wereto compare non-technical parameters such as samplethroughput, price per sample and simplicity of protocolsbetween the platforms as well as to evaluate the moretechnical parameters in terms of precision and data
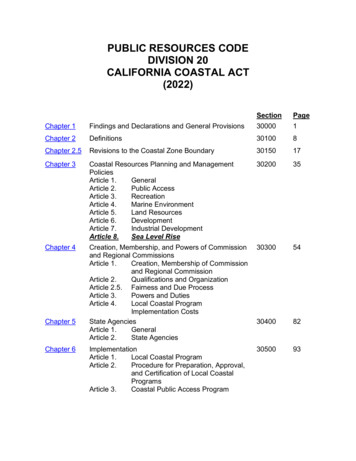
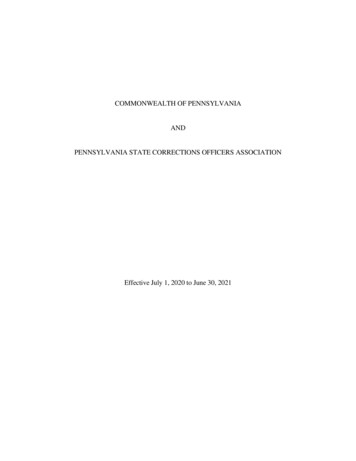
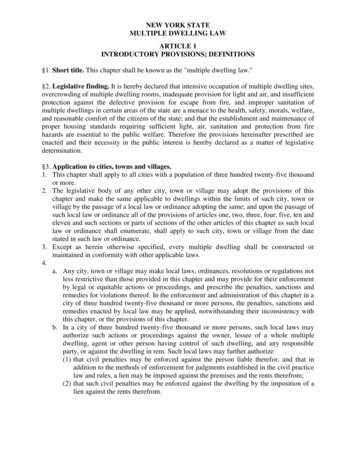
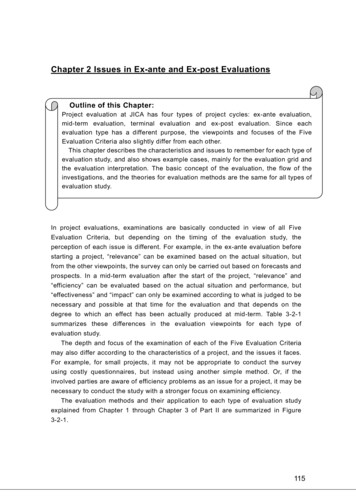
Forreryd et al. BMC Genomics 2014, 9Page 3 of 17consistency within each platform, to assess inter-platformconsistency, and to determine if transcriptional analysisperformed on the evaluated platforms could be appliedto the GARD model to classify sensitizers from nonsensitizers. In conclusion, we found that it was possible toachieve acceptable detection sensitivity, reproducibilityand discriminatory power of the GARD assay while at thesame time simplify assay procedures and reduce assay costwhen using any of the suggested high-throughput platforms evaluated in this study.ResultsBiological model for evaluation of high throughputplatforms and phenotypic analysis of unstimulatedMUTZ-3 cellsThe GARD assay was chosen as a biological model toachieve a per application relevant assessment of the performance of selected high throughput platforms. The cellline used in the GARD assay is the dendritic cell (DC)-likehuman myeloid leukemia-derived cell line MUTZ-3 [23].Analogous to primary DCs, MUTZ-3 cells express CD1a,HLA-DR, CD54, CD80 and CD86. The MUTZ-3 population also consists of subpopulations of CD14 , CD34 and double negative cells as previously described [24].Phenotypic analysis of cells was performed prior to eachround of stimulation to ensure that MUTZ-3 cells were inan immature stage. Cell surface expression levels of themarkers CD54, CD86, CD80, HLA-DR, CD14, CD34 andCD1a were verified using flow cytometry prior to stimulations. Results are illustrated in Table 1 and correlated withpreviously published examples of phenotypic profiles forthe MUTZ-3 cells [10].Inducible up-regulation of CD86 cell surface marker inresponse to stimulation of MUTZ-3 with skin sensitizersTo enable a comprehensive evaluation between platforms,a panel of 16 chemical compounds including eight sensitizers and eight non-sensitizers initially being used to definethe GARD prediction signature (GPS) were prepared forstimulation of MUTZ-3 cells (Table 2). Each stimulationTable 1 Phenotype of MUTZ-3 cellsCell surface markerCD1a% positive cellsStandard 800.40.2CD8627.81.8HLA-DR87.44.1Expression levels of the cell surface markers CD54,CD80,CD86,HLA-DR,CD1a,CD14 and CD34 were determined using flow cytometry to ensure proliferatingcells were not differentiated. Results illustrates average percentage of positivecells together with standard deviation (n 3).was performed in biological triplicates, generating a dataset comprising 48 chemical stimulations. The GARD assayuses the inducible cell surface expression of CD86 afterchemical stimulation as a general measure of the maturitystate of the cells and as a quality control to ensure bioavailability of chemical stimulations. Cell surface expression of CD86 was confirmed after 24 h of stimulation withchemicals using flow cytometry (Figure 1). CD86 wassignificantly up-regulated on cells stimulated with thesensitizers 2-hydroxyethyl acrylate, 2-aminophenol, 2nitro-1,4-phenylendiamine and p-phenylendiamine in comparison to vehicle controls. None of the non-sensitizersinduced a significant up-regulation of CD86. The outcomeof the experiment correlated with previously publisheddata [10].Transcriptional profiling of MUTZ-3 using high throughputgene expression platformsSelection of transcripts for this study was performed intwo consecutive steps. In a first step, transcripts were selected in order to obtain a representative expression profilefrom the GPS to allow for a decisive evaluation of technicalparameters such as intra platform reproducibility and limitof detection. In this step, transcripts were selected to coverthe whole dynamic range of gene expression present in theoriginal GPS (including low, medium and highly expressedtranscripts) as well as to include heavily regulated transcripts, weakly regulated transcripts and to include bothup- and down regulated transcripts when comparing expression profiles of chemically stimulated cells to nonstimulated cells. For the transcripts selected in the firststep, a second round of selection was performed to includeonly the most potent predictor genes to allow for assessment of the biological relevance of gene expression data interms of the GARD assay. Selection of the most potentpredictor genes were based on validation call frequenciesas described in [10]. The abundance of each transcript included in this study (Table 3) was determined on all platforms using samples from the same cellular stimulation.Data were analyzed to evaluate intra-platform reproducibility, inter-platform reliability and relevance of data produced on each platform for construction of a predictivemodel for skin sensitization in the GARD assay. A schematic view of the experimental workflow from chemicalstimulation to mRNA quantification using the variousplatforms is illustrated in Figure 2. The data from the highthroughput platforms were compared to Affymetrix microarray data from a previous study [10]. A comparisonof non-technical parameters of evaluated platforms is illustrated in Table 4.Preprocessing of dataGene expression data obtained on evaluated platformswere normalized prior to any analysis as described in
Forreryd et al. BMC Genomics 2014, 9Page 4 of 17Table 2 List of chemical compounds used during evaluation of platformsCompoundAbbrev.Potency according to LLNAVehicleGARD input concentration Water5002-hydroxyethyl ERWeakDMSO500PEN GWeakWater500DMSO500GeraniolPenicillin GNon-sensitizers1-ButanolBUTDimethyl formamideDFWater500Ethyl vanillinEVDMSO500Metyl salicylateMSDMSO500Propylene glycolPGWater500Salicylic acidSADMSO500WaterdH2O--Dimethyl sulfoxideDMSO--Vehicle controlsList of chemical compounds used for evaluation of platforms. List includes information on sensitizing potency, vehicle, GARD input concentration andabbreviation for each chemical.Figure 1 Cell surface expression of CD86 in MUTZ-3 cells after stimulation with sensitizing and non-sensitizing chemicals. Levels ofexpression of the cell surface marker CD86 were determined using flow cytometry after stimulation with various chemicals for 24 h. Figureillustrates percentage of CD86 positive cells for each chemical (n 3). Gating were performed to exclude dead cells/debris and quadrants wereestablished by comparing with isotype controls. Statistics were performed using Student’s t-test (*p 0.05).
Forreryd et al. BMC Genomics 2014, 9Page 5 of 17Table 3 List of transcripts used during evaluation of platformsGene symbolEntrez gene IDDELTAGene assay IDADAM208748GEP00055625NanoString probe IDNM 003814.4:1420Life technologies assay IDCD33945GEP00055628NM 001177608.1:730Hs00233544 m1CD86942GEP00055621NM 175862.3:1265Hs01567026 m1CD9322918GEA00016079NM 012072.3:4270Hs00362607 m1DHCR241718GEA00025118NM 014762.2:975Hs00207388 m1DHX33Hs01083178 s156919GEP00055629NM 001199699.1:2873Hs01063767 m1FAS355GEP00055622NM 152876.1:1740Hs00907759 m1FASN2194GEA00032375NM 004104.4:5387Hs00188012 m1FDXR2232GEA00028039NM 004110.3:1123Hs01031618 g1GDAP254834GEA00028183NM 001135589.1:640Hs00214424 m1GDF1110220GEA00006411NM 005811.3:3590Hs00195156 m1GNL3L54552GEA00029786NM 001184819.1:1935Hs00535521 m1HIST1H3J8356GEA00014232NM 003535.2:364Hs00361917 s1HMGCS13157GEA00026981NM 002130.4:420Hs00940429 m1HNRNPL3191GEA00029122NM 001533.2:757Hs00704853 s1LY9623643GEP00055624NM 015364.2:360Hs01026734 m1MAPK135603GEP00055633NM 002754.3:1050Hs00559623 m1MTR4548GEA00030234NM 000254.2:6816Hs00299285 s1NQO11718GEA00013124NM 000903.2:790Hs02512143 s1219968GEA00014658NM 001005218.1:292Hs02339238 s1PFAS5198GEA00032277NM 012393.2:4655Hs00389822 m1PHLDA323612GEA00015249NM 012396.3:532Hs01926548 s1RFC25982GEP00055631NM 181471.1:835Hs00945948 m1SFPQ6421GEP00055626NM 005066.2:1995Hs00192574 m1SLC37A42542GEP00055634NM 001164277.1:1248Hs00184616 m1OR5B21SQLE6713GEP00055620NM 003129.3:250Hs01123768 m1TLR610333GEA00012581NM 006068.2:2530Hs00271977 s1TMEM9727346GEP00055627NM 014573.2:2055Hs00299877 m1TXNRD17296GEA00013820NM 001093771.1:1009Hs00917067 m1ABCB45244GEP00055630NM 018849.2:2125Hs00240956 m1GAPDH2597GEP00055153NM 002046.3:972Hs03929097 g1HPRT13251GEP00055483NM 000194.1:240Hs99999909 m1A set of 30 transcripts from the GPS was analyzed on all three platforms. Transcripts are listed by gene symbol, Entrez Gene ID, DELTAGene assay ID,NanoString probe ID and Life Technologies Assay ID. In addition to transcripts from the GPS, three reference transcripts, ABCB4, GAPDH and HPRT1 wereanalyzed on the evaluated platforms and used for normalization of data.Methods. Due to issues with a batch of samples duringRNA preparation, one of the replicates from the following chemical stimulations had to be removed from analysison all platforms: p-phenylendiamine, geraniol, eugenol and1-butanol. In addition, one of the replicates from the following chemical stimulations had to be removed from analysis on nCounter platform due to platform specific issues:2-aminophenol and water. Total dataset analyzed onnCounter consisted of 42 samples. In addition to the samples removed due to issues during RNA preparation, oneof the replicates from the following chemical stimulationshad to be removed from analysis on BioMark HD andOpenArray platforms due to insufficient amounts ofcDNA: propylene glycol, methyl salicylate, geraniol and dimethyl sulfoxide. Total dataset analyzed on BioMark HD and OpenArray consisted of 40 samples. All stimulationsexcept geraniol was present in at least biological duplicates.For chemical stimulations consisting of two replicates, averaged values were calculated from duplicate reactions instead of on triplicate as applied to remaining stimulations.The total number of sample shared between all platformscomprised 38 samples.
Forreryd et al. BMC Genomics 2014, 9Page 6 of 17Figure 2 Experimental workflow for evaluation of high throughput platforms. Schematic view of the experimental design illustrating theprocedure from chemical stimulation to mRNA quantification on the various platforms.Detection sensitivityTo determine how evaluated platforms compared in sensitivity to each other, we estimated the total number oftranscripts detected on each platform. Using the set of38 chemical stimulations shared between all platformsand measuring the expression levels of all 33 transcriptsin each stimulation, a total of 1254 transcripts wereassayed on each platform. Transcripts were defined as either detected or undetected in a certain chemical stimulation based on platform specific criteria as described inMethods. The overall number of detected transcripts in allsamples was higher on the BioMark HD platform (1246/1254) in comparison to both the OpenArray platform(1210/1254) and the nCounter platform (1128/1254). Inorder to generate a uniform set of transcripts for comparative analysis between the platforms, we chose to include only those transcripts detected in at least two of thethree replicate reactions for all stimulations and on allof the evaluated platforms during downstream analysis. Identities and number of detected transcripts forall stimulations and on each platform are summarizedin Table 5. While all transcripts were detected in atTable 4 Comparison of platformsPlatformTechnologyInput materialAffymetrix nCounter MicroarraycDNASample consumption 300 ng total RNA/sampleTime for analysisProtocolsPricea 4 days from RNAto resultsBioMark HD OpenArray HybridizationRT-qPCRRT-qPCRTotal RNAPre-Amp cDNAcDNA200 ng total RNA/sample125 ng cDNA/sample22 h from RNA to results with 7 h from cDNA to results witha hands on time of 15 minutes.a hands on time of 4 h120 ng cDNA/sample3 h from cDNA to results with ahands on time of 20 minutes.DifficultEasyMediumEasy aComparison are based on the 48 samples analyzed in the present study. Platforms were graded based on total cost to analyze the complete set of 48 samples.The number of denotes the relation in costs between the platforms, with the highest number assigned to the most expensive platform.
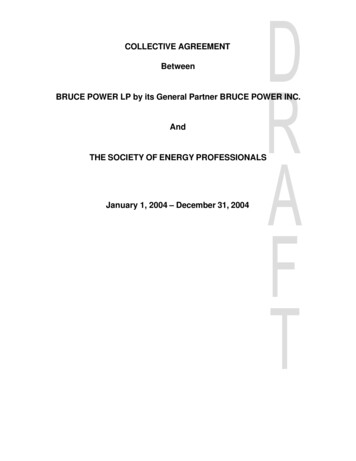
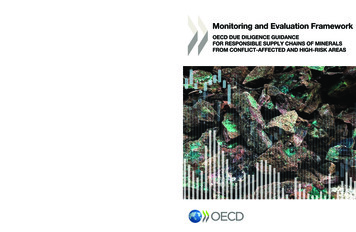
Forreryd et al. BMC Genomics 2014, 9Page 7 of 17Table 5 Comparison of the number of detected genes inthe 38 samples shared between all platformsGene symbolnCounter BioMark HD OpenArray ABCB41 (3%)31 (82%)18 (47%)FDXRD37 (97%)36 (95%)OR5B210 (0%)D37 (97%)ADAM2011 (29%)D35 (92%)HIST1H3J36 (95%)D36 (95%)GDF1130 (79%)DDLY96DD36 (95%)TLR636 (95%)DDCD8633 (87%)D36 (95%)FASNDD37 (97%)PFASMAPK13DD36 (95%)37 (97%)DDDD36 (95%)TMEM9735 (92%)DDDHX33GDAP235 (92%)DDRFC2DD37 (97%)ACLYDD35 (92%)TXNRD1DD37 (97%)HPRT1DD37 (97%)GAPDHDD37 (97%)The set of 33 transcripts were measured in the 38 chemical stimulationsshared between all platforms. The table illustrates the number of detectedcalls for a specific transcript across the 38 samples with percentage inparentheses. Table lists only transcripts declared as undetected in any of thestimulations on either nCounter , BioMark HD or OpenArray . D denotes thattranscript is present in all samples.least two of the three replicates for all stimulationson BioMark HD , one transcript (ABCB4) on theOpenArray platform, and three transcripts (ABCB4,ORB5B21 and ADAM20) on the nCounter platform,did not fulfill the stringent requirements for use indownstream analysis. Subsequently, ABCB4, ORB5B21and ADAM20 were removed from the set of transcripts. Two of the removed transcripts, ORB5B21and ADAM20 originated from the GPS while thetranscript ABCB4 was originally considered to beused as a reference gene. All of the removed transcripts were confirmed as low expressed transcripts inthe MUTZ-3 cell line based on microarray data (datanot shown). The total gene set used for further analysis thus consisted of a total of 28 transcripts fromthe GPS.Intra-platform reproducibility and data consistencyWe chose to evaluate precision and to measure dataconsistency within each platform by calculating coefficient of variation (CV%) between biological replicatemeasurements. Calculations of CV were performed onintra-platform replicates for each chemical stimulationusing quantitative gene expression signals from the subsetof 28 transcripts shared between the evaluated platforms.The distribution of replicate CV values across all transcripts are summarized in a series of box and whiskersplots visualized in Figure 3. All platforms demonstratedgood reproducibility of gene expression data. The replicateCV median values for Affymetrix were the lowestamongst the platforms, ranging from 1-3% for all chemicalstimulations. The replicate CV median values for themajority of the chemical stimulations measured onnCounter , BioMark HD and OpenArray platformswere in the range of 5-15%, although the distributionof replicate CV varied slightly between various chemicalstimulations measured on the same platform. Examplesinclude larger dispersion of replicate CV values for thestimulations ethyl vanillin, 1-butanol, salicylic acid, methylsalicylate, dimethyl formamide, dimethyl sulfoxide andwater in comparison to 2-aminophenol, 2-nitro-1,4-phenylendiamine, p-phenylendiamine and ethylendiamine.However, the pattern of dispersion of the CV values forthe different stimulations seems to be comparable acrossthe evaluated platforms.Inter-platform consistencyWe further evaluated reliability of gene expression datameasured on the nCounter , BioMark HD and OpenArray platforms by comparing their abilities to measure transcripts in the GARD signature to each other and toAffymetrix microarrays. Absolute signals of gene expression values generated on the different platforms couldnot be compared directly since the different platforms utilized different chemistry, quantitation, and normalizationmethods. Therefore, we evaluated the correlation betweendata in fold change matrices. Cross-platform comparisonswere performed by evaluating concordances of log2 foldchanges by pair wise regression analysis of fold differencesfor chemical stimulations in comparison to vehicle controls. Biological replicate measurements for the 38 samples shared between all platforms were used to calculatethe average log2 fold changes across the 28 transcriptspresent in each stimulation. Dimethyl sulfoxide and waterwere used as reference samples. The chemical stimulationgeraniol was removed from the analysis as no replicatesamples were available. This left a dataset consisting of364 matched measurement pairs (averaged values from 13stimulations). The matched measurement pairs from eachplatform were pair-wise plotted against each other andsubjected to bivariate analysis. Pearson correlation coefficients and linear fits to the log2 ratios were calculatedfor each pair-wise platform comparison (Figure 4). Strongcorrelation was observed between log2 fold change measurements on nCounter and BioMark HD platforms
Forreryd et al. BMC Genomics 2014, 9Page 8 of 17Figure 3 Distribution of replicate coefficient of variation (CV). As a measure of intra-platform precision and data consistency, the replicateCV of 28 transcripts present in all stimulations were determined from triplicate stimulations and illustrated in a series of box and whiskersplots. The interquartile range (25th and 75th percentile), median (Gap) and the 10th and 90th percentile values as well as outliers areindicated in each plot.(Figure 4A, R 0.84). Lower correlations were observed ofeither of BioMark HD (Figure 4B, R 0.44) or nCounter (Figure 4C, R 0.50) to Affymetrix . Low correlationswere also observed between log2 fold change measurements of either of BioMark HD (Figure 4D, R 0.53),nCounter (Figure 4E, R 0.50) and Affymetrix (Figure 4F,R 0.14) with the OpenArray data. Level of compressionor expansion of gene expression data measured on thedifferent platforms were evaluated by comparing theslope of the best fitted line of a least square linear regression of the log2 fold changes between pairs of platforms to the ideal slope of 1. Only a minor compressionwas observed between nCounter and BioMark HD (slope: 0.83). Compression effects were observed for bothnCounter (slope 0.33) and BioMark HD (slope 0.35) inrelation to OpenArray . Affymetrix data compressed log2fold change measurements relative to the other platforms(slope 0.12, 0.18, 0.040 for BioMark HD, nCounter andOpenArray respectively).Comparison of transcriptional profiles from differentplatforms as predictive models for skin sensitizationWe evaluated overall structure and relevance of gene expression data measured on evaluated high-throughputplatforms on a per application basis in order to determine if platforms could be used to distinguish sensitizersfrom non-sensitizers in the GARD assay. Principal component analysis (PCA) was used to visualize gene expressiondata from the various platforms. PCA plots were constructed in the software Qlucore Omics Explorer v.2.1using the subset of 28 transcripts shared between evaluated platforms as variable input. Construction of PCAplots based on the 40 samples in the BioMark HD andOpenArray sample datasets revealed significant outliersthat had to be removed, otherwise they would have prevented visualization and classification of separate groups(data not shown). From the BioMark HD data set,one of the replicate of dimethyl formamide had to beremoved, leaving a dataset comprising 39 samples. From
Forreryd et al. BMC Genomics 2014, 9Page 9 of 17Figure 4 Fold change correlations between gene expression data quantified by the various platforms. Cross-platform comparisons wereperformed by evaluating the concordance of log2 fold changes by pair wise regression analysis of fold differences for chemical stimulations incomparison to vehicle controls. The average log2 fold changes for 28 transcripts present in all stimulations and detected on all three platformswere subjected to bivariate analysis. Subplots (A-F) illustrates the correlation between the following platforms: A) nCounter and BioMark HD ,B) Affymetrix and BioMark HD , C) Affymetrix and nCounter , D) BioMark HD and OpenArray , E) nCounter a
biomarker signature termed the GARD prediction signa-ture (GPS) [10]. The GPS was established using a panel of reference chemicals comprising 18 well known sensi-tizers and 20 non-sensitizers. By stimulating the myeloid cell line MUTZ-3 with the panel of reference chemicals, we were able to identify the 200 most potent discrimin-