Transcription
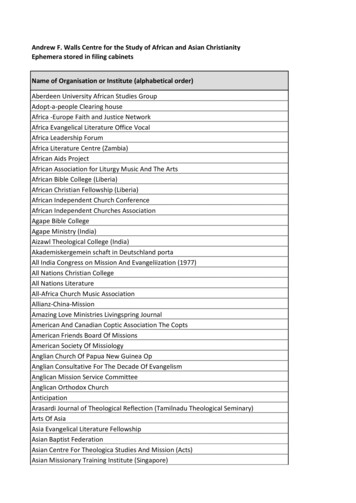
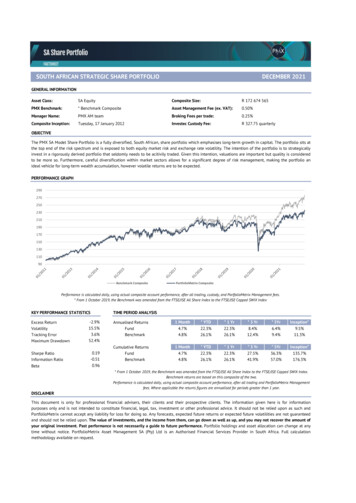
SOUTH AFRICAN STRATEGIC SHARE PORTFOLIODECEMBER 2021GENERAL INFORMATIONAsset Class:SA EquityComposite Size:R 172 674 565PMX Benchmark:* Benchmark CompositeAsset Management Fee (ex. VAT):0.50%Manager Name:PMX AM teamBroking Fees per trade:0.25%Composite Inception:Tuesday, 17 January 2012Investec Custody Fee:R 327.75 quarterlyOBJECTIVEThe PMX SA Model Share Portfolio is a fully diversified, South African, share portfolio which emphasises long-term growth in capital. The portfolio sits atthe top end of the risk spectrum and is exposed to both equity market risk and exchange rate volatility. The intention of the portfolio is to strategicallyinvest in a rigorously derived portfolio that seldomly needs to be acitivily traded. Given this intention, valuations are important but quality is consideredto be more so. Furthermore, careful diversification within market sectors allows for a significant degree of risk management, making the portfolio anideal vehicle for long-term wealth accumulation, however volatile returns are to be expected.PERFORMANCE GRAPH29027025023021019017015013011090Benchmark CompositePortfolioMetrix CompositePerformance is calculated daily, using actual composite account performance, after all trading, custody, and PortfolioMetrix Management fees.* From 1 October 2019, the Benchmark was amended from the FTSE/JSE All Share Index to the FTSE/JSE Capped SWIX IndexKEY PERFORMANCE STATISTICSExcess ReturnVolatilityTracking ErrorMaximum DrawdownSharpe RatioInformation RatioBetaTIME PERIOD ANALYSIS-2.9%15.5%3.6%52.4%0.19-0.510.96Annualised ReturnsFundBenchmark1 Month* YTD* 1 Yr* 3 Yr* 6.4%9.4%9.5%11.3%Cumulative ReturnsFundBenchmark1 Month* YTD* 1 Yr* 3 Yr* %36.3%57.0%135.7%176.3%* From 1 October 2019, the Benchmark was amended from the FTSE/JSE All Share Index to the FTSE/JSE Capped SWIX Index.Benchmark returns are based on this composite of the two.Performance is calculated daily, using actual composite account performance, after all trading and PortfolioMetrix Managementfees. Where applicable the returns figures are annualised for periods greater than 1 year.DISCLAIMERThis document is only for professional financial advisers, their clients and their prospective clients. The information given here is for informationpurposes only and is not intended to constitute financial, legal, tax, investment or other professional advice. It should not be relied upon as such andPortfolioMetrix cannot accept any liability for loss for doing so. Any forecasts, expected future returns or expected future volatilities are not guaranteedand should not be relied upon. The value of investments, and the income from them, can go down as well as up, and you may not recover the amount ofyour original investment. Past performance is not necessarily a guide to future performance. Portfolio holdings and asset allocation can change at anytime without notice. PortfolioMetrix Asset Management SA (Pty) Ltd is an Authorised Financial Services Provider in South Africa. Full calculationmethodology available on request.
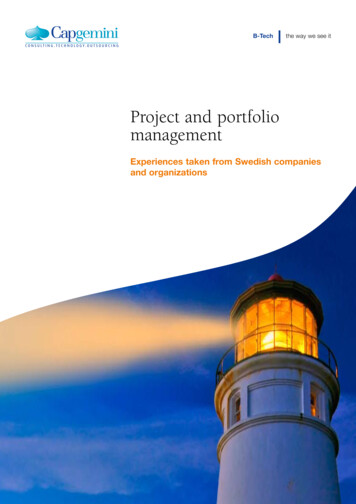
SHARE PORTFOLIO MONTHLY FACTSHEETPORTFOLIO SECTOR WEIGHTSKEY PORTFOLIO STATISTICS1.3%1.8%6.6%CashBasic MaterialsConsumer GoodsConsumer ServicesFinancials Excluding PropHealthcareIndustrialsPropertyInformation d Yield4.1%Price to Earnings Ratio12.8Price to Cash Flow Ratio8.4Price to Book Ratio2.1Current Ratio4.3%1.6Return on Equity19.9%4.4%3.1%4.5%13.4%24.8%TOP 10 PORTFOLIO HOLDINGSASSET ALLOCATIONBhp Group Plc (Bhp)SA ListedProperty4.3%3.4%Northam Platinum Hldgs L (Nph)Cash1.8%3.6%Sanlam Limited (Slm)3.7%Naspers Ltd -N- (Npn)3.7%Mtn Group Ltd (Mtn)4.2%Impala Platinum Hlgs Ltd (Imp)4.3%SA Equity93.9%Standard Bank Group Ltd (Sbk)5.0%Firstrand Ltd (Fsr)5.6%Prosus N.V. (Prx)6.1%Anglo American Plc RThis document is only for professional financial advisers, their clients and their prospective clients. The information given here is for informationpurposes only and is not intended to constitute financial, legal, tax, investment or other professional advice. It should not be relied upon as such andPortfolioMetrix cannot accept any liability for loss for doing so. Any forecasts, expected future returns or expected future volatilities are not guaranteedand should not be relied upon. The value of investments, and the income from them, can go down as well as up, and you may not recover the amount ofyour original investment. Past performance is not necessarily a guide to future performance. Portfolio holdings and asset allocation can change at anytime without notice. PortfolioMetrix Asset Management SA (Pty) Ltd is an Authorised Financial Services Provider in South Africa. Full calculationmethodology available on request.
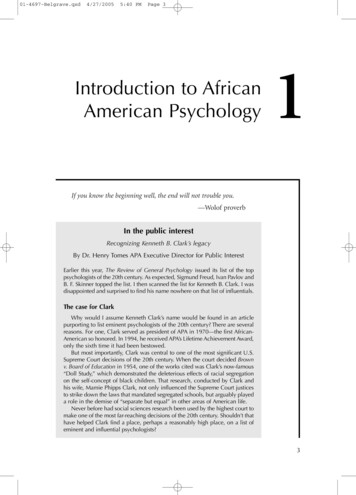
PORTFOLIOMETRIX GLOBAL STRATEGIC SHARE PORTFOLIODECEMBER 2021GENERAL INFORMATIONAsset Class:Global EquityComposite Size: 10 360 968PMX Benchmark:MSCI All Country World IndexAsset Management Fee (ex. VAT):0.80%Manager Name:PMX AM teamBroking Fees per trade:0.25%Composite Inception:Wednesday, 17 April 2013Custody Fee p.a.:0.20%OBJECTIVEThe PortfolioMetrix Global Strategic Share Portfolio is a fully diversified, global, USD denominated share portfolio which emphasises long-term growth incapital. The portfolio sits at the top end of the risk spectrum and is exposed to both equity market risk and exchange rate volatility. The intention of theportfolio is to strategically invest in a rigorously derived portfolio that seldomly needs to be acitivily traded. Given this intention, valuations areimportant but quality is considered to be more so. Furthermore, careful diversification within market sectors still allows for a significant degree of riskmanagement, making the portfolio an ideal vehicle for long-term wealth accumulation, however volatile returns are to be expected.PERFORMANCE GRAPH27025023021019017015013011090MSCI ACWI TRPortfolioMetrix CompositePerformance is calculated daily, using actual composite account performance, after all trading, custody, and PortfolioMetrix Management fees. In USD.KEY PERFORMANCE STATISTICSExcess Return (ann.)VolatilityTracking ErrorMaximum DrawdownSharpe RatioInformation RatioBetaTIME PERIOD ANALYSIS-1.1%15.4%4.1%41.7%0.61-0.270.99Annualised Returns FundBenchmark1 MonthYTD1 Yr3 .4%13.3%14.4%10.0%11.1%Cumulative Returns1 MonthYTD1 Yr3 .5%87.1%95.9%129.6%150.6%FundBenchmarkPerformance is calculated daily, using actual composite account performance,after all trading and PortfolioMetrix Management fees. Portfolio currency is USD. Where applicable the return figures are annualised for periods greater than 1 year.DISCLAIMERThis document is only for professional financial advisers, their clients and their prospective clients. The information given here is for informationpurposes only and is not intended to constitute financial, legal, tax, investment or other professional advice. It should not be relied upon as such andPortfolioMetrix cannot accept any liability for loss for doing so. Any forecasts, expected future returns or expected future volatilities are not guaranteedand should not be relied upon. The value of investments, and the income from them, can go down as well as up, and you may not recover the amount ofyour original investment. Past performance is not necessarily a guide to future performance. Portfolio holdings and asset allocation can change at anytime without notice. PortfolioMetrix Asset Management SA (Pty) Ltd is an Authorised Financial Services Provider in South Africa. Full calculationmethodology available on request.
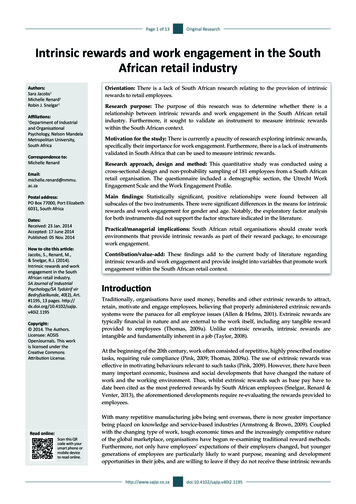
SHAREPORTFOLIOPORTFOLIOMETRIXGLOBAL STRATEGIC SHARE PORTFOLIODECEMBER 2021PORTFOLIO SECTOR WEIGHTSKEY PORTFOLIO STATISTICSMaterialsConsumer StaplesConsumer DiscretionaryFinancialsReal EstateHealthcareIndustrialsInformation TechnologyCommunication ServicesEnergyEmerging MarketsUtilitiesCash2.7% 2.4% 2.6%Dividend Yield6.5%10.9%9.1%2.01%Price to Earnings Ratio28.7Price to Cash Flow Ratio13.8Price to Book Ratio3.0Current Ratio3.1%1.2Return on Equity7.9%14%11.7%2.5%20.6%11.1%9.1%TOP 10 PORTFOLIO HOLDINGSASSET ALLOCATIONSIEMENS AG-SPONS ADR2.6%ALPHABET INC-CL A2.7%VISA INC-CLASS A SHARES2.7%AMAZON.COM INC2.7%TAIWAN SEMICONDUCTOR-SP ADRGlobalProperty2.5%3.2%NVIDIA CORP3.7%APPLE INCGlobalEquity95.1%4.1%MICROSOFT CORP4.4%VANGUARD FTSE EMERGING MARKE10.9%VANGUARD HEALTH CARE LAIMERThis document is only for professional financial advisers, their clients and their prospective clients. The information given here is for informationpurposes only and is not intended to constitute financial, legal, tax, investment or other professional advice. It should not be relied upon as such andPortfolioMetrix cannot accept any liability for loss for doing so. Any forecasts, expected future returns or expected future volatilities are not guaranteedand should not be relied upon. The value of investments, and the income from them, can go down as well as up, and you may not recover the amount ofyour original investment. Past performance is not necessarily a guide to future performance. Portfolio holdings and asset allocation can change at anytime without notice. PortfolioMetrix Asset Management SA (Pty) Ltd is an Authorised Financial Services Provider in South Africa. Full calculationmethodology available on request.
PORTFOLIOMETRIX SA OFFSHORE SOLUTIONDECEMBER 2021GENERAL INFORMATIONAsset Class:Global EquityComposite Size: 13 114 248PMX Benchmark:MSCI All Country World IndexAsset Management Fee (ex. VAT):0.25%Manager Name:Brandon ZietsmanBroking Fees per trade:0.25%Composite Inception:Tuesday, 29 September 2015Custody Fee p.a.:0.20%PORTFOLIO CHARACTERISTICSThe portfolio is comprised of a globally diversified set of Exchange Traded Funds (ETFs) which emphasises long-term growth in capital. The portfolio sitsat the top end of the risk spectrum and is exposed to both equity market risk and exchange rate volatility. Careful diversification within fundamentalmarket factors still allows for a significant degree of risk management, making the portfolio an ideal vehicle for long-term wealth accumulation, howevervolatile returns are to be expected. Investors need to be aware that, even with diversification, this portfolio may produce negative returns for evensustained periods and that investors need to demonstrate composure in the face of volatile markets.PERFORMANCE GRAPH25023021019017015013011090PortfolioMetrix CompositeMSCI ACWI TRPerformance is calculated daily, using actual composite account performance, after all trading, custody, and PortfolioMetrix Management fees.KEY PERFORMANCE STATISTICSExcess Return (ann.)VolatilityTracking Error (Weekly)Maximum DrawdownSharpe RatioInformation RatioBetaTIME PERIOD d ReturnsFundBenchmark1 Month3 Month6 Month1 Year3 8%20.3%10.3%13.8%Cumulative Returns1 Month3 Month6 Month1 Year3 6%74.5%85.1%125.1%FundBenchmarkPerformance is calculated daily, using actual composite account performance, after all trading and PortfolioMetrix Managementfees. Where applicable the return figures are annualised for periods greater than 1 year.DISCLAIMERThis document is only for professional financial advisers, their clients and their prospective clients. The information given here is for informationpurposes only and is not intended to constitute financial, legal, tax, investment or other professional advice. It should not be relied upon as such andPortfolioMetrix cannot accept any liability for loss for doing so. Any forecasts, expected future returns or expected future volatilities are not guaranteedand should not be relied upon. The value of investments, and the income from them, can go down as well as up, and you may not recover the amount ofyour original investment. Past performance is not necessarily a guide to future performance. Portfolio holdings and asset allocation can change at anytime without notice. PortfolioMetrix Asset Management SA (Pty) Ltd is an Authorised Financial Services Provider in South Africa. Full calculationmethodology available on request.
PORTFOLIOMETRIX SA OFFSHORE SOLUTIONDECEMBER 2021INVESTMENT STRATEGYEnhanced Indexing (EHI) is an exciting new approach to traditional portfolio construction. The approach questions the soundness of using MarketCapitalisation weighted indexes as the foundation of portfolio construction. To address these concerns alternatively constructed factor indexes are used,the supporting theory suggests that these indexes offer superior and more persistent sources of risk adjusted returns.PortfolioMetrix adopts a risk-based methodology by applying optimisation techniques on fundamental market factors. This requires sound financialengineering, to exploit portfolio efficiency. The target factor allocations are populated with ETFs that faithfully reflect the characteristics of the MarketFactor they are mandated to represent. The portfolio leans towards a "buy and hold" strategy. The intention of the portfolio is to strategically invest in afully diversified international portfolio of ETFs, that seldomly need to be actively traded.PORTFOLIO tumValueEmerging MarketsLiquidityMinimum VolatilityQualityCashMarket FactorInstrumentMomentumiShares MSCI World Momentum ETF - USDWeight16.66%ValueiShares MSCI World Value ETF - USD22.54%Emerging MarketsVanguard FTSE Emerging Markets ETF - USD12.74%Small CapiShares MSCI Small Cap ETF - USD19.60%Minimum VolatilityiShares MSCI World Minimum Volatility ETF - USD16.17%QualityiShares MSCI World Quality Factor UCITS ETF - USD10.29%CashCash - USD2.00%DISCLAIMERThis document is only for professional financial advisers, their clients and their prospective clients. The information given here is for informationpurposes only and is not intended to constitute financial, legal, tax, investment or other professional advice. It should not be relied upon as such andPortfolioMetrix cannot accept any liability for loss for doing so. Any forecasts, expected future returns or expected future volatilities are not guaranteedand should not be relied upon. The value of investments, and the income from them, can go down as well as up, and you may not recover the amount ofyour original investment. Past performance is not necessarily a guide to future performance. Portfolio holdings and asset allocation can change at anytime without notice. PortfolioMetrix Asset Management SA (Pty) Ltd is an Authorised Financial Services Provider in South Africa. Full calculationmethodology available on request.
The PMX SA Model Share Portfolio is a fully diversified, South African, share portfolio which emphasises long-term growth in capital. . PORTFOLIOMETRIX GLOBAL STRATEGIC SHARE PORTFOLIO DECEMBER 2021 1.2 2.01% 28.7 13.8 14% 3.0 SHARE PORTFOLIO 2.6% 6.5% 9.1% 11.7% 2.5% 11.1% 9.1% . VANGUARD HEALTH CARE ETF VANGUARD FTSE EMERGING MARKE .