Transcription
Reece et al. Molecular Cancer 2014, 91RESEARCHOpen AccessEpidithiodiketopiperazines (ETPs) exhibit in vitroantiangiogenic and in vivo antitumor activityby disrupting the HIF-1α/p300 complex in apreclinical model of prostate cancerKelie M Reece1, Emily D Richardson1, Kristina M Cook1, Tessa J Campbell1, Stephen T Pisle4, Alesia J Holly2,David J Venzon3, David J Liewehr3, Cindy H Chau1, Douglas K Price1 and William D Figg1,2,5*AbstractThe downstream targets of hypoxia inducible factor-1 alpha (HIF-1α) play an important role in tumor progressionand angiogenesis. Therefore, inhibition of HIF-mediated transcription has potential in the treatment of cancer. Oneattractive strategy for inhibiting HIF activity is the disruption of the HIF-1α/p300 complex, as p300 is a crucialcoactivator of hypoxia-inducible transcription. Several members of the epidithiodiketopiperazine (ETP) family ofnatural products have been shown to disrupt the HIF-1α/p300 complex in vitro; namely, gliotoxin, chaetocin, andchetomin. Here, we further characterized the molecular mechanisms underlying the antiangiogenic and antitumoreffects of these ETPs using a preclinical model of prostate cancer. In the rat aortic ring angiogenesis assay, gliotoxin,chaetocin, and chetomin significantly inhibited microvessel outgrowth at a GI50 of 151, 8, and 20 nM, respectively.In vitro co-immunoprecipitation studies in prostate cancer cell extracts demonstrated that these compoundsdisrupted the HIF-1α/p300 complex. The downstream effects of inhibiting the HIF-1α/p300 interaction wereevaluated by determining HIF-1α target gene expression at the mRNA and protein levels. Dose-dependentdecreases in levels of secreted VEGF were detected by ELISA in the culture media of treated cells, and thesubsequent downregulation of VEGFA, LDHA, and ENO1 HIF-1α target genes were confirmed by semi-quantitativereal-time PCR. Finally, treatment with ETPs in mice bearing prostate tumor xenografts resulted in significantinhibition of tumor growth. These results suggest that directly targeting the HIF-1α/p300 complex with ETPs maybe an effective approach for inhibiting angiogenesis and tumor growth.Keywords: Hypoxia, HIF-1α, p300, ETPs, Angiogenesis, VEGFIntroductionHypoxia, a reduction in tissue oxygen levels below physiological levels, is a nearly universal hallmark of solid tumors,and commonly develops due to heterogeneous blood flowfrom structurally and functionally abnormal blood vesselswithin the tumor [1,2]. Intratumoral hypoxia can drivetumor progression leading to a malignant phenotype thatis associated with increased risk of invasion, metastasis,* Correspondence: figgw@helix.nih.gov1Molecular Pharmacology Section, Center for Cancer Research, NationalCancer Institute, Bethesda, MD 20892, USA2Clinical Pharmacology Core, Center for Cancer Research, National CancerInstitute, Bethesda, MD 20892, USAFull list of author information is available at the end of the articletreatment failure, and patient mortality. Adaptation to hypoxia is critical for tumor survival and growth and is mediated through activation of heterodimeric hypoxia induciblefactor 1 (HIF-1), which facilitates transcriptional responsesto changes in oxygen levels [3-7].HIF-1 is a heterodimeric transcription factor composedof an O2-regulated HIF-1α subunit and a constitutivelyexpressed HIF-1β subunit. Under oxygenated conditions, HIF-1α is rapidly degraded via the von HippelLindau tumor suppressor gene product (pVHL)-mediatedubiquitin-proteasome pathway. However, in hypoxic conditions, HIF-1α is stabilized and translocates into the nucleus where it binds as a heterodimer with HIF-1β to itscognate DNA sequence, the hypoxia response element 2014 Reece et al.; licensee BioMed Central Ltd. This is an Open Access article distributed under the terms of the CreativeCommons Attribution License (http://creativecommons.org/licenses/by/2.0), which permits unrestricted use, distribution, andreproduction in any medium, provided the original work is properly credited.
Reece et al. Molecular Cancer 2014, 91(HRE). The heterodimer then recruits the p300/CBPfamily of coactivators to initiate the transcription of a diverse group of genes involved in the adaptive response tohypoxia [3,5,7,8].HIF-1 expression is elevated in many human cancers,and its levels in cells correlate with tumorigenicity andangiogenesis, the formation of new blood vessels via thesprouting and remodeling of preexisting vessels [3-5,9,10].The newly generated blood vessels are required to supplyadequate oxygen and nutrition to the growing tumormass, which further accelerates tumor growth and facilitates metastasis. Thus, tumor angiogenesis plays a key rolein cancer cell survival, tumor growth and metastasis[1,11-13]. In particular, HIF plays a central role in theactivation of multiple genes that encode angiogenicgrowth factors, including VEGF, the most potent stimulator of angiogenesis, stromal-derived factor 1 (SDF1), placental growth factor (PGF), and angiopoietin (ANGPT) 1and 2 [14,15]. Therefore, inhibition of HIF-1 is an attractive therapeutic strategy for targeting hypoxia and tumorangiogenesis.Many HIF-1 inhibitors have been generated in the lastseveral years, most of which function by altering signaltransduction pathways that are indirectly associated withHIF or that are part of more complex pathways relevantto human cancer, clearly limiting their specificity of action and increasing their likelihood of toxicity [10,16,17].As a result, most of these inhibitors have failed in clinical trials. Thus, there is a clear need for direct HIF inhibitors, yet no such agent has been clinically developedto date [10,16]. One promising approach for directlyinhibiting HIF is by disrupting the complex that HIF-1αforms with p300, an essential transcriptional coactivator[10,18]. Previous research from our laboratory showedthat several members of the epidithiodiketopiperazine(ETP) family of fungal secondary metabolites; namely,gliotoxin, chaetocin, and chetomin are able to block theinteraction between HIF-1α and p300 in vitro by a zincejection mechanism [19,20].Angiogenesis plays a critical role in prostate cancer development and progression, and inhibition of angiogenesis in preclinical models has been shown to be aneffective target in metastatic prostate cancer. Thus, inthis study, we used prostate cancer cells as a preclinicalmodel to further characterize the molecular mechanismsof these compounds in respect to their antiangiogeniceffects. Data from rat aortic ring assays demonstratedthe antiangiogenic properties of these ETPs, and coimmunoprecipitation experiments showed that theseeffects are due, at least in part, to disruption of the HIF1α/p300 complex, which led to a subsequent decrease inHIF activity. We also demonstrated that these ETPs haveantitumor efficacy in vivo. Taken together, these data indicate that directly inhibiting HIF-1 by targeting thePage 2 of 12HIF-1α/p300 interaction with these ETPs may provevaluable in suppressing tumor angiogenesis and prostatecancer progression.Materials and methodsCell culturePC3 human prostate cancer cells (ATCC; Manassas, VA)were grown in Ham’s F-12K medium (Gibco; Carlsbad,CA), and HCT116 human colon cancer cells (ATCC)were grown in McCoy’s 5a medium (Gibco). Both celllines were supplemented with 10% fetal bovine serum(Atlanta Biologicals; Lawrenceville, GA), 50 U/ml penicillin, and 50 mg/ml streptomycin (Gibco). Cells weregrown in a 37 C incubator with 5% CO2. For hypoxicconditions, 200 μM of cobalt chloride (CoCl2) was addedto the media, or cells were placed in a modular incubator chamber flushed with 1% O2, 5% CO2, 94% N2.Antibodies and reagentsMonoclonal HIF-1α antibody was purchased from BDBiosciences Pharmingen (San Diego, CA). Monoclonalp300 antibodies were purchased from Thermo Scientific(Rockford, IL) and Calbiochem (Billerica, MA). AlexaFluor 680 goat anti-mouse IgG for fluorescence detectionusing the Odyssey Imaging System was from MolecularProbes (Eugene, OR). The FITC rabbit anti-mouse secondary antibody was used for immunofluorescence staining, and was purchased from Abcam (Cambridge, MA).Protein A/G Agarose was purchased from Thermo Scientific,and CoCl2 was purchased from Sigma (St. Louis, MO).Gliotoxin, chaetocin, and chetomin were purchased fromSigma, and sorafenib was purchased from Toronto Research Chemicals (Ontario, Canada). Each of the ETPsand sorafenib were stored frozen in DMSO. Odysseyblocking buffer was from LICOR (Lincoln, NE).Rat aortic ring assayThe rat ring assay was performed similarly to that previously described [21]. Twelve-well tissue culture plateswere covered with 250 μl Matrigel (BD Biosciences) andallowed to gel for 30 to 45 min at 37 C, 5% CO2. Thoracicaortas were excised from 6- to 8-week-old male Sprague–Dawley rats, and the fibroadipose tissue was removed.The aortas were cut into 1 mm-long cross-sections andplaced on the Matrigel-coated wells. They were then covered with an additional 250 μl Matrigel and allowed to gelfor 30 to 45 min at 37 C. The rings were cultured for 24 hin 1 ml EGM-2 (Atlanta Biologicals). After 24 h, themedium was removed and replaced with 1 ml EBM-2(Atlanta Biologicals), supplemented with fetal bovineserum (2%), ascorbic acid, hydrocortisone, heparin, andamphotericin, at concentrations consistent with EGM-2media. Each ETP (gliotoxin, chaetocin, chetomin) was dissolved in DMSO and added to the EBM media (final
Reece et al. Molecular Cancer 2014, 91DMSO concentration of 0.1%) before being added to thewell. The rings were incubated in treatment media for5 days, after which they were imaged on an inverted phasecontrast microscope. All images were acquired with Spotversion 4.5 imaging software. Vascular outgrowth wasquantified using Adobe Photoshop CS3 version 10; theinner portion of the rings was excluded from analysis.ImmunofluorescenceRat ring assays were performed as described in the previoussection; however, 6-well tissue culture plates were used andno drug was added. The rings were incubated for 7 days inEGM-2 media, after which the media was removed and2 ml of Cell Recovery Solution was added to the wells (BDBiosciences) to depolymerize the Matrigel and release theendothelial cells. After a 2-h incubation, the recovery solution was removed, the cells were washed once in PBS containing 0.1% Tween (PBS-Tween), and were then fixed in4% paraformaldehyde for 30 min at 37 C. Subsequently, thecells were washed again with PBS-Tween and permeabilized with 0.5% Triton X-100 (Sigma) for 4 min. Afteranother PBS-Tween wash, the cells were blocked for 1 h inPBS containing 2% BSA (Sigma), and then incubated for1 h in a 1:50 dilution of HIF-1α antibody. After threewashes with PBS-Tween, the rings were incubated for 1 hin the dark with a 1:500 dilution of FITC-labeled antimouse antibody. The cells were washed three times withPBS-Tween and mounted onto slides with VECTASHIELDMounting Medium with DAPI (Vector Laboratories;Burlingame, CA). Images were taken on an Olympus BX51microscope with UplanF1 40x lens. InSight Firewire cameraand Spot version 4.5 imaging software were used to capturethe images. Adobe Photoshop CS3 version 10 was used forafter-capture edits where all photos were processed thesame and merged equally.Page 3 of 12Western blot analysisSDS-solubilized protein samples were resolved usingthe Novex NuPage SDS-PAGE gel system (Invitrogen;3-10% Tris Acetate gels for p300 detection, 4-12%Bis-Tris gels for HIF-1α detection), and electrophoretically transferred to 0.45 μm nylon-supported nitrocellulose membranes (Biorad; Hercules, CA). Membraneswere blocked for 1 h in Odyssey blocking buffer, andthen incubated overnight at 4 C in a 1:1000 dilution ofHIF-1α monoclonal antibody (BD Biosciences) and a1:500 dilution of p300 monoclonal antibody (ThermoScientific). After three washes in lysis buffer for 5 mineach, the membranes were incubated for 1 h at roomtemperature in a 1:10,000 dilution of fluorophoreconjugated goat anti-mouse IgG, and washed anotherthree times for 10 min each. Bound antibodies werevisualized via the Odyssey Infrared Imaging Systemand Odyssey software.Cell viability assaysHCT116 and PC3 cells were seeded overnight into96-well plates in 100 μl of medium at a concentration of5 104 cells well 1. After overnight incubation at 37 C,medium was removed and replaced with 200 μl ofmedium containing increasing concentrations of ETPsor vehicle control (DMSO). Plates were placed in eithera normoxic incubator or a hypoxic chamber (BillupsRothenberg; Del Mar, CA) for 18 h. Cell viability wasmeasured by adding 20 μl CellTiter-Blue cell viabilityreagent (Promega; Madison, WI) to each well, afterwhich the cells were returned to the 37 C incubatoruntil sufficient color change. Fluorescence intensity wasread at 570 nm using a SpectraMax M2 fluorescenceplate reader (Molecular Devices; Sunnyvale, CA).HIF-1α/p300 co-immunoprecipitationVEGF ELISAPC3 cells were treated with media containing 200 μMCoCl2 and either DMSO or the indicated concentrationsof ETPs. The media covering the cells was removed after18 h, and the cells were washed once with PBS containing CoCl2. Cells were then scraped from the plates in200 μl of ice-cold lysis buffer containing 25 mM Tris,pH 8.0, 150 mM NaCl, 2 mM EDTA, 1% Triton, andprotease and phosphatase inhibitors (Nacalai; San Diego,CA). The lysed cells were pipetted into a 1.5-mlEppendorf tube, incubated on ice for 30 min, and microcentrifuged at 14,000 g for 30 min at 4 C. Clarified lysates were incubated overnight at 4 C with 0.3 μg ofp300 monoclonal antibody (Calbiochem), and then incubated for 1 h with Protein A/G Agarose. Beads were extensively washed in lysis buffer, and bound proteins wereeluted in SDS sample buffer and subjected to Westernblot analysis.HCT116 and PC3 cells were seeded into 96-well platesat a concentration of 50,000 cells/ml and 190,000 cells/ml,respectively. After overnight incubation at 37 C, themedia was removed and replaced with 210 μl serumfree media containing either drug or vehicle control(DMSO), in the absence or presence of 200 μM cobaltchloride. The plates were incubated for 18 h at 37 C.The supernatant was then collected on ice, after whichthe number of viable cells in each well was determinedusing the CCK8 assay (Dojindo Molecular Technologies;Rockville, MD). After cell viability assessment, the concentration of secreted VEGF in the tissue culture supernatantwas determined using the Quantikine human VEGFELISA Kit (R & D Biosystems; Minneapolis, MN) according to the manufacturer’s instructions. Relative VEGF concentrations in the supernatant were normalized to the cellnumber in each well.
Reece et al. Molecular Cancer 2014, 91Semi-quantitative real time-PCR (qPCR)HCT116 and PC3 cells were treated for 18 h with ETPsunder hypoxic conditions (hypoxic chamber or treatmentwith 200 μM CoCl2). Total RNA extraction was performed using the RNAeasy mini kit (Qiagen; Valencia,CA) according to the manufacturer’s protocol. RNA concentration was determined using a NanoDrop spectrophotometer (Molecular Devices). Purified RNA (1.5 μg)from HCT116 cells was reverse transcribed per 25-μlcDNA synthesis reaction using the RT2 First Strand kit(SABiosciences; Valencia, CA) according to the manufacturer’s instructions. Purified RNA (0.24-0.32 μg) from PC3cells was reverse transcribed per 20 μl cDNA synthesis reaction using The Superscript III First-Strand SynthesisSystem for RT-PCR (Invitrogen) according to the manufacturer’s protocol.For qPCR reactions with RNA extracted from HCT116cells, cDNA reaction products (25 μl) were diluted 1:4 inwater. For each sample, 1 μl each of cDNA, forward andreverse primers (VEGFA, ENO1, LDHA, ACTB), weremixed with 2x RT2 SYBR Green/ROX qPCR Master Mix(SABiosciences) in a total volume of 25 μl. qPCR was performed using a Stratagene Mx3005P Real-Time PCRSystem with MxPro analysis software (Stratagene; SantaClara, CA). For qPCR reactions with RNA extracted fromPC3 cells, cDNA reaction products (20 μl) were diluted1:3 in water. For each sample, 2 μl of cDNA was mixedwith 18 μl master mix containing 1 μl of forward and reverse primers, 7 μl water, and 10 μl Taqman Gene Expression Master Mix (Applied Biosystems) for a total volumeof 20 μl. qPCR was performed using an Applied Biosystems StepOnePlus Real-Time PCR system with StepOneSoftware. All qPCR reactions were run in triplicate.β-Actin (ACTB) was used as a reference housekeepinggene. Fold-change in RNA levels was calculated using theΔΔCt method (SABiosciences 2009 RT2 Profiler PCRArray System User Manual; Frederick, MD).XenograftsMale, Fox Chase SCID Beige Mice were purchased at5 weeks of age from the National Cancer Institute AnimalProduction Area (Frederick, MD). Animals were housed inpolycarbonate cages, and kept on a 12-h light/dark cyclewith food and water given ad libitum. The National CancerInstitute is accredited by AAALAC International and follows the Public Health Service Policy for the Care and Useof Laboratory Animals. Animal care was provided in accordance with the procedures outlined in the “Guide forCare and Use of Laboratory Animals” (National ResearchCouncil; 1996; National Academy Press; Washington, DC).The study protocol was approved by the NCI Animal Careand Use Committee (Bethesda, MD).Xenografts were generated by subcutaneously injescting mice with 3 million PC3 or DU-145 cells suspendedPage 4 of 12in 100 μl of sterile PBS. Tumor volume (V) was calculated according to the following formula: V length width heigth 0.52. When tumor volume reached100 mm3, mice were divided randomly into treatmentand control groups of 7 rats each. ETPs and vehicle(12.5% DMSO, 37.5% PEG 400, 50% sterile saline) wereadministered to the animals by daily intraperitoneal injection at the previously determined MTD doses of0.50 mg/kg, 0.25 mg/kg, and 0.50 mg/kg for gliotoxin,chaetocin, and chetomin, respectively, at a dosing volume of 5 ml/kg. Tumors were measured 3 times a week.After 2 weeks, tumors were excised and frozen for subsequent immunohistochemistry analysis.ImmunohistochemistryFrozen samples of tumor xenografts were submitted tothe Pathology/Histotechnology Laboratory (PHL) atNCI-Frederick. Samples were thawed in 10% bufferedneutral formalin, paraffin-embedded, and cut into 5-mmsections. Staining was performed using the Bond MaxAutostainer from Leica Biosystems (Buffalo Grove, IL).EDTA was used for antigen retrieval and 10% normalrabbit serum (Vector Laboratories) was used as blockingbuffer. Sections were incubated with a 1:100 dilution ofVEGF or CD31 antibodies (R & D Systems) for 30 min,followed by incubation with a 1:500 dilution of biotinylated secondary antibody (Vector Laboratories) for 30 min.Immune reactivity was visualized with the Intense RDetection Kit (Leica Biosystems). Sections were counterstained with hematoxylin and eosin (H & E). All slideswere imaged on an Aperio bright field ScanScope.Statistical analysisAnalysis of variance (ANOVA) was performed on eitherraw or transformed data. Various fixed effects models,mixed models, or repeated measures ANOVA were usedas appropriate. Hochberg’s method was used for adjusting p-values for multiple comparisons. For the xenograftmodel, treatment groups were compared using Mann–Whitney U test. P values less than 0.05 were consideredstatistically significant, and all reported p-values aretwo-tailed.ResultsETPs decrease microvessel outgrowth from rat aortic ringsTo determine if gliotoxin, chaetocin, and chetomin haveantiangiogenic properties, a series of rat aortic ring assays were performed with increasing concentrations ofeach ETP. Specifically, ETPs were added to the culture,and their effect on vessel outgrowth was determinedusing image analysis software to measure the length andabundance of the sprouting microvessels. DMSO wasused as a negative control and sorafenib, a known antiangiogenic agent used to treat hepatocellular carcinoma
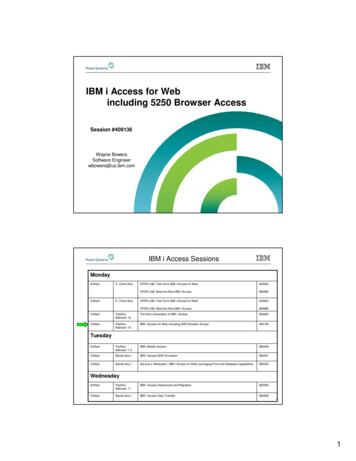
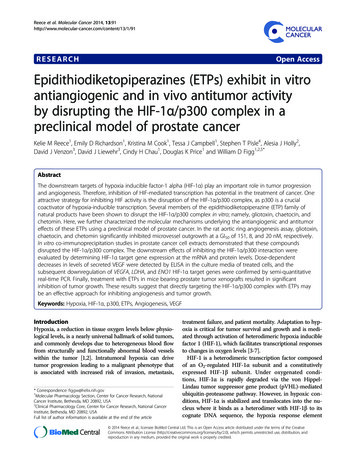
Reece et al. Molecular Cancer 2014, 91and kidney cancer [17], was used as a positive control.As seen in Figure 1A, a dose-dependent decrease inmicrovessel outgrowth occurred with increasing concentrations of each ETP. Quantification of vessel outgrowth,where mean percent inhibition of vessel growth wascompared to vehicle, confirmed the dose-dependenteffect of the ETPs (Figure 1B). At a concentration of25 nM, gliotoxin exhibited little to no effect on outgrowth, whereas inhibition was statistically evident atconcentrations of 250 nM and above; 500 nM of gliotoxin led to greater than 90% inhibition (p 0.0001). Atconcentrations of 1 and 5 nM, chaetocin and chetominhad little effects on outgrowth, but 25 nM and above ledto inhibition of angiogenesis; 100 nM of either ETPinhibited approximately 90% of microvessel outgrowth(p 0.0001). The GI50 of gliotoxin, chaetocin, and chetomin was 151, 8, and 20 nM, respectively.A previous in vitro study from our laboratory used afluorescent binding assay to show that ETPs are capableof disrupting the interaction between the C-TAD domain of HIF-1α and the CH1 domain of p300, and electrospray ionization mass spectrometry (ESI-MS) analysesdetermined that this occurs via a zinc ejection mechanism [19,22,23]. Since the interaction between HIF-1αand p300 is critical for transactivation, blocking thiscomplex reduces HIF-1α-induced transcription of angiogenic genes [23-25]. Thus, it seemed likely that the antiangiogenic effects of the ETPs observed in the rat aorticring assays were mediated through disruption of theHIF-1α/p300 complex. To test this hypothesis, we firstimmunostained the aortic rings for HIF-1α to confirmits presence in the endothelial cells of the microvesseloutgrowth (Figure 1C).ETPs disrupt the interaction of HIF-1α and p300 in cellsNext, we performed co-immunoprecipitation experimentsto determine if the ETPs could disrupt the interaction ofendogenous HIF-1α and p300. Briefly, endogenous p300was immunoprecipitated from PC3 human prostate cancer cells under hypoxic conditions in the absence andpresence of ETPs, and co-immunoprecipitated HIF-1αwas detected by Western blotting. The low and high concentrations of ETPs used in this experiment representedthose concentrations that either had little effect on angiogenesis or that inhibited approximately 90% of microvesseloutgrowth in the rat ring assay, respectively. As expected,the expression levels of p300 in the cell lysates remainedthe same under both normoxia and hypoxia (200 μMCoCl2; a hypoxia mimetic), and no HIF-1α expressioncould be seen under normoxic conditions (Figure 2A, B;left panel). Western blot analysis of the immune complexes showed no effect in the presence of 25 nM gliotoxin; however, in the presence of 500 nM gliotoxin, lessHIF-1α co-immunoprecipitated with p300 (Figure 2A;Page 5 of 12right panel). Similarly, treatment of cells with only 5 nMchetomin did not cause disruption of the complex, but100 nM chetomin was able to disrupt the HIF-1α/p300complex (Figure 2B; right panel). Neither gliotoxin norchetomin affected the expression levels of HIF-1α or p300under hypoxic conditions. Thus, the observed decrease inthe amount of HIF-1α in the p300 immunoprecipitatesupon treatment with gliotoxin and chetomin demonstrates their ability to disrupt the interaction betweenHIF-1α and p300 in cells. In accordance with a previousstudy [26], chaetocin treatment inhibited HIF-1α expression in a dose-dependent manner (data not shown); thus,co-immunoprecipitations could not be performed fromchaetocin-treated cells.ETPs decrease VEGF secretion in a dose-dependent mannerTo determine whether blocking the HIF-1α/p300 complex in cells with ETPs affected angiogenic signaling,VEGF secretion was examined in the presence of ETPssince VEGF is a prominent target of HIF-1α and a potent stimulator of angiogenesis. To this end, PC3 cellswere treated with different concentrations of each ETPunder hypoxic conditions. After 18 hours of treatment,cell culture media was collected, and a VEGF ELISA wasperformed to measure the effects of ETPs on VEGFlevels in the media. As shown in Figure 3A, treatmentwith gliotoxin, chaetocin, and chetomin led to a dosedependent decrease in hypoxia-induced VEGF expression. This trend was also seen in HCT116 colorectalcarcinoma cells (Additional file 1: Figure S1A), indicating that the observed effects with ETPs were not limitedto PC3 cells. Interestingly, gliotoxin did not have an effect on VEGF expression in this cell line (at the concentrations shown), signifying that this compound may havecell-specific effects.To ensure that the observed decrease in secreted VEGFlevels was not due to a nonspecific reduction in cell viability, PC3 cells were treated with increasing concentrationsof gliotoxin, chaetocin, and chetomin under hypoxic conditions, followed by measurement of cell viability. Significanttoxicity was not observed, as only concentrations close to10 μM decreased cell viability to approximately 50% inboth cell lines (Figure 3B), whereas nanomolar concentrations of ETPs, which did not impact cell viability,were able to significantly reduce VEGF levels (Figure 3A).Similar results were obtained for HCT116 cells up to 1µM (Additional file 1: Figure S1B). Together with our previous data, these results demonstrate that the potent effectof these ETPs in reducing VEGF protein levels was notcaused by general cellular cytotoxicity.ETPs inhibit HIF-1α transcriptional activitySince HIF-1α is a transcription factor, it was importantto determine if disrupting the HIF-1α/p300 complex
Reece et al. Molecular Cancer 2014, 91Figure 1 (See legend on next page.)Page 6 of 12
Reece et al. Molecular Cancer 2014, 91Page 7 of 12(See figure on previous page.)Figure 1 Rat ring assay shows dose-dependent inhibition of microvessel outgrowth by ETPs. A, Cells were treated with DMSO (negativecontrol), 1 μM sorafenib (positive control), and increasing concentrations of gliotoxin, chaetocin, and chetomin. Three concentrations of each ETPare shown to illustrate the dose-dependent effect of the drugs on microvessel outgrowth. B, Dose response curves showing a decrease inoutgrowth with increasing ETP concentrations. Gliotoxin, chaetocin, and chetomin had a GI50 of 151, 8, and 20 nM, respectively. Data points arepresented as mean S.E.M (error bars) from independent experiments run in triplicate (n 6). *, p 0.05, **, p 0.001, ***, p 0.0001. C, Rat aorticrings at day 5 were stained with a HIF-1α monoclonal primary antibody and a FITC-conjugated secondary antibody to label endothelial cells. Themerged image shows DAPI-stained nuclei in blue and HIF-1α expression in green (indicated by arrows). Three representative images are shown.specifically affected HIF-1α transcriptional activity. Sincethere are several pathways and processes that regulatethe production of VEGF protein [27,28], we could notdefinitively ascertain that the observed decrease in secreted VEGF was due to a decrease in HIF-1α activity.Therefore, as a way to measure HIF-1α transcriptionalactivity, we performed qPCR in the absence and presence of ETPs and monitored levels of VEGF mRNA. Asan additional way of demonstrating the specificity ofHIF-1α transcriptional activation, we also monitored thelevels of two other HIF-1α target genes; namely lactatedehydrogenase A (LDHA) and enolase-1 (ENO1), whichhave one hypoxia response element (HRE) and threeHRE sites, respectively that are required for expression[29]. Briefly, PC3 cells were incubated under normoxicor hypoxic conditions in the absence or presence ofthe indicated concentrations of gliotoxin, chaetocin,and chetomin. After 18 hours, total cellular RNA wasextracted from the cells, followed by qPCR; β-actin wasused as a reference housekeeping gene. As shown inFigure 4, levels of VEGF, LDHA, and ENO1 were lowerin normoxia, and increased about 2-fold under hypoxicFigure 2 ETPs disrupt the endogenous HIF-1α/p300 complex in cells. PC3 cells were cultured under normoxia or hypoxia (CoCl2) in thepresence or absence of the indicated concentrations of gliotoxin and chaetocin. After 18 h, co-immunoprecipitations were performed fromthe cell lysates using a p300 mouse monoclonal antibody and Protein A/G Agarose. Bound proteins were eluted with SDS buffer followed byimmunoblot analysis of the lysates (left panels) and immune complexes (right panels) with antibodies recognizing p300 and HIF-1α. A, Treatmentwith 25 nM and 500 nM gliotoxin (GLIO). B, Treatment with 5 nM and 100 nM chaetocin (CTM) (n 3 for all).
Reece et al. Molecular Cancer 2014, 91Page 8 of 12Figure 3 ETPs decrease VEGF secretion in a dose-dependentmanner. A, Hypoxia was induced for 18 h in PC3 cells in theabsence or presence of the indicated concentrations (1000 nM isnot shown) of gliotoxin, chaetocin, and chetomin. This was followedby ELISA quantification of secreted VEGF normalized to DMSO underhypoxic conditions. A repeated measures ANOVA was performedon the data; Hochberg’s post-hoc method was used to adjust thep-values. Data are presented as mean S.E.M from independentexperiments run in triplicate (n 2-7). *, p 0.05, **, p 0.001,***, p 0.0001. B, PC3 cells were treated with increasing concentrationsof ETPs or with vehicle control (DMSO). Plates were placed in either anormoxic incubator or hypoxic chamber for 18 h. Cell viability was thendetermined using the CellTiter-Blue cell viability reagent. Data points arepresented as mean S.E.M from independent experiments run intriplicate (n 4).conditions, which was expected since HIF-1α transcriptional activity increases under hypoxic c
verse group of genes involved in the adaptive response to hypoxia [3,5,7,8]. HIF-1 expression is elevated in many human cancers, and its levels in cells correlate with tumorigenicity and angiogenesis, the formation of new blood vessels via the sprouting and remodeling of preexisting vessels [3-5,9,10].