Transcription
ANNUAL REPORTFiscal Year Ended: June 30, 2004EXPLORE.EXPERIENCE.EXCEL
BOARD OF TRUSTEES(As of June 30, 2004)Deanna L. ClarkNilza I. Delgado,M.S.Chief Probation OfficerDudley District CourtThomas J. Foley, M.A.Lucille Gibbs, M.Ed.WESTFIELDSTATECOLLEGEGina Golash, M.B.A. (Secretary)Executive DirectorFOR Community Services, Inc./Sunshine VillageJames C. Hagan, M.B.A.Senior Vice PresidentWestfield Savings BankRobert A. Magovern, B.S.PresidentNeighbor to Neighbor of America, Inc.ANNUAL REPORTCornelius D. Mahoney, M.B.A. (Chair)President and Chief Executive OfficerWoronoco Savings Bank(Audited)Pablo A. Nyarady, B.E.President and Chief Executive OfficerTranscon Technologies, Inc. (d/b/a ECI,Electronic Coils)Fiscal Year 2004(July 1, 2003 - June 30, 2004)Gregory A. Schmidt, J.D. (Vice Chair)AttorneyDoherty, Wallace, Pillsbury & Murphy PCRobert A. McDonaldStudent RepresentativeCURRENT SENIOR ADMINISTRATIONFINANCE ADMINISTRATIONVicky L. Carwein, D.N.S.PresidentNick A. Wojtowicz, B.S.Vice President, Administration and FinanceJoan A. Rasool, Ed.D.Interim Senior Vice President, Academic AffairsLisa M. Freeman, B.S.B.A.Director of FinanceNick A. Wojtowicz, B.S.Vice President, Administration and FinanceMark Solomon, B.A.Director of Student AccountsArthur R. Jackson, Ed.D.Vice President, Student AffairsBarry M. Maloney, M.P.A.Vice President, Advancement and CollegeRelationsTimothy C. Murphy, M.P.A.Director, Human Resourcesi
Vice PresidentAdministration and FinanceTransmittal LetterThe annual report for fiscal year ended June 30, 2004 is presented to President Carwein and theCollege Board of Trustees. The College has prepared the Statement of Net Assets, the Statement ofRevenues, Expenditures and Changes in Net Assets and the Statement of Cash Flows in accordancewith Governmental Accounting Standards Board (GASB) principles. The annual report alsoincludes the financial activity of the Westfield State College Foundation as well as supplementalschedules for the State Building Authority Trust Fund.The annual state appropriation in fiscal year 2004 reached an all time low of 18.4 million. Thisrepresented a reduction of 4.7% from the previous fiscal year. The state appropriation nowrepresents 35% of the total College operating revenues. To offset this reduced revenue and allowthe College to meet the budgeting requirements identified in the Colleges’ mission statement, thefollowing actions were taken: (1) increased the technology fee by 800, (2) continued to fund onlyessential departmental activities, (3) maintained a hiring freeze on all non-instructional positionsand (4) received authorization from the Board of Trustees to allocate 2.3 million of reserve fundsto the operating budget. These and many additional actions enabled the College to continue to befinancially solid.A number of administrative systems were upgraded during the fiscal year. Some of the areasincluded Admissions, Financial Aid, Registrar, Billing, Finance and Housing. In fiscal year 2005,Alumni will be the final implementation. The total cost of this project will total almost 3.0million. The College secured a five year, 2.0 million dollar loan through Woronoco Savings Bank.The balance will be paid with revenue generated by the technology fees. When fully activated, thisstate of the art application will be 100% web accessible to all students, prospective students, facultyand staff.The College continued its commitment of maintaining and improving campus facilities in fiscalyear 2004. A total of approximately 3.0 million was budgeted for special projects including theexpansion of the student parking south lot of 1.1 million, food service improvements of 310,000,electrical improvements to the Davis residential building of 105,000, and many miscellaneousdepartmental improvements of 390,000. Because the Commonwealth no longer provides capitalfunds for deferred maintenance projects, more and more pressure is placed on the Colleges’ localfinancial resources in order to maintain the plant in a safe, attractive and competitive condition.The timely preparation of this comprehensive annual report was made possible by the dedicated andproficient services of my assistant, Lisa Freeman. I would also like to acknowledge theprofessionalism and leadership provided by the firm and staff of PricewaterhouseCoopers LLP.Respectfully submitted,Nick A. WojtowiczVice PresidentAdministration and Financeii
Westfield State College(A Component Unit of the Commonwealth of Massachusetts)Management’s Discussion and AnalysisIntroductionThis section of the Westfield State College annual financial report presents management’sdiscussion and analysis of the financial activities of Westfield State College for the fiscal yearended June 30, 2004, with comparative information for the year ended June 30, 2003 and 2002. Forfinancial reporting purposes, Westfield State College’s reporting entity consists of Westfield StateCollege (the College) and its component unit, Westfield State College Foundation, Inc. (theFoundation). Since this analysis is designed to focus on current activities, resulting changes andcurrently known facts, it should be read in conjunction with the transmittal letter, the basic financialstatements, and the footnotes to the basic financial statements. The transmittal letter, the financialstatements, footnotes and this discussion are the responsibility of management.Westfield State College is a comprehensive public institution of higher learning with approximately4,300 FTE day and evening students combined. The College offers 23 academic undergraduatemajors in both the traditional arts and sciences and in professional fields, including nearly 60concentrations of study and four additional academic minors. There are also 23 distinct graduatedegree programs offered by the Division of Graduate and Continuing Education. This broad rangeof graduate programs and undergraduate majors, minors, and concentrations reflect the commitmentof Westfield State College to providing quality educational programs.Westfield State College Foundation, Inc. is a not-for-profit corporation operated exclusively forcharitable, scientific, and educational purposes related to Westfield State College, including suchactivities as soliciting or receiving tangible property, rendering financial aid, promoting andsupporting educational and other legal activities, and participating in any and all activities designedand carried on by the College to promote the general education of the people within theconstituency served by the College.Listed below are the definitions of each entity that may be represented in this discussion andanalysis.Westfield State CollegeOverall financial activities of Westfield State College and its component unit, the FoundationPrimary Institution (the College)Component Unit (the Foundation)Financial activities of Westfield State CollegeFinancial activities of Westfield State CollegeFoundation, Inc.1
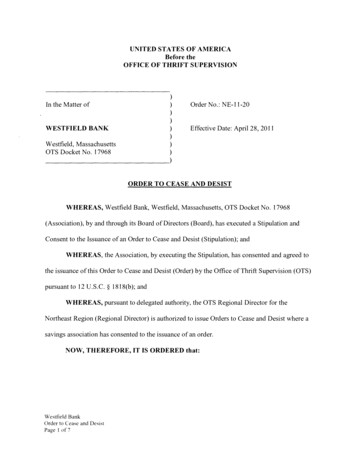
Primary Institution Financial HighlightsGraphically displayed, the comparative net asset increases by category for the fiscal years endedJune 30, 2004, 2003 and 2002 are shown below:Comparison of Net Assets-Primary Institution 35.0 30.0 25.0 20.0In Millions 15.0 10.0 5.0 UnrestrictedRestrictedNetInvestment inCapital AssetsTotal NetAssets2004 8.0 0.6 22.0 30.62003 4.4 0.5 15.9 20.82002 2.9 0.5 12.9 16.3The College’s financial position continued to improve during the fiscal year ended June30, 2004, with a 9.8 million or 47.3% increase in total net assets. Net assets, whichrepresent the residual interest in the College’s assets after liabilities are deducted,increased to 30.6 million from 20.8 million in 2003. The College’s financial positionimproved during the fiscal year ended June 30, 2003, with a 4.5 million or 27.3%increase in total net assets, which increased to 20.8 million from 16.3 million in 2002.Expenses incurred during fiscal year 2004 totaled 53.2 million. Revenues from tuitionand fees, state capital support and appropriations, grants, and other sources totaled 63.0million resulting in an increase in net assets of 9.8 million. Expenses incurred duringfiscal year 2003 totaled 48 million. Revenues from tuition and fees, state capitalsupport and appropriations, grants, and other sources totaled 52.5 million resulting inan increase in net assets of 4.5 million as compared to an increase of 2.1 million forthe year ended June 30, 2002.The increase in net assets during the fiscal year ended June 30, 2004 is attributable tomany factors including the acquisition of capital assets associated with the newacademic/athletic facility, specifically the cost of the building provided by a stateappropriation in the amount of approximately 7.8 million and the acquisition of a newstudent parking lot in the amount of 1.1 million. The increase in net assets during thefiscal year ended June 30, 2003 is attributable to many factors including the acquisitionof capital assets associated with the new academic/athletic facility, various buildingimprovement projects, a new telephone system and administrative system software andinstallation, a combined increase in general and technology fees of 799 per studentcoupled with budget imposed decreases in departmental spending and salary and relatedbenefits reductions as a result of the early retirement incentive.2
Overview of the Financial StatementsWestfield State College’s financial report includes three financial statements: the Statement of NetAssets, the Statement of Revenues, Expenditures and Changes in Net Assets and the Statement ofCash Flows. These financial statements have been prepared in accordance with GovernmentalAccounting Standards Board (GASB) principles. The statements are designed to present all theactivities of Westfield State College and consolidate the activities into one total.The Financial Statements:The Statement of Net Assets presents the financial position of Westfield State College at the end ofthe fiscal year and includes all assets and liabilities of Westfield State College. The differencebetween total assets and total liabilities (net assets) is one indicator of the current financial conditionof Westfield State College, while the change in net assets serves as a useful indicator of whether thefinancial position is improving or deteriorating.The Statement of Revenues, Expenditures, and Changes in Net Assets presents Westfield StateThis statement presentsCollege’s results of operations and other non-operating revenues.information that shows how Westfield State College’s net assets changed during the most recentfiscal year.The Statement of Cash Flows provides additional information about Westfield State College’sfinancial results by reporting the major sources and uses of cash. Governmental AccountingStandards Board (GASB) Statements 34 and 35 require that the direct method be used to preparethis statement. The direct method of cash flow reporting portrays the net cash flow from operationsby major classes of operating receipts and disbursements.The financial statements can be found on pages 11-14 of this financial report.Notes to the financial statements:The footnotes provide additional information that is essential to a full understanding of the dataprovided in the financial statements. The notes to the financial statements can be found on pages15-27 of this financial report.Other information:In addition to the financial statements and accompanying footnotes, this financial report alsocontains certain required supplementary information concerning the Westfield State CollegeBuilding Authority trust fund. This supplementary information can be found on pages 29-30 of thisfinancial report.3
Financial Analysis of Westfield State College as a WholeAs previously noted, net assets may serve over time as a useful indicator of Westfield State College’sfinancial position. Westfield State College’s financial position remained strong with a combined(College and Foundation) net asset increase of 10.2 million for the year ended June 30, 2004 ascompared to a combined net asset increase of 5.0 million as of June 30, 2003 and 2.4 million as ofJune 30, 2002.Westfield State College’s Condensed Statement of Net AssetsAs of June 30, 2004, 2003 and 2002Current 002 17,347,799 15,478,999 11,970,352 771,893 894,927 458,671Non-current AssetsCapital Assets, net of ,740455,4023,075,795Total ,9183,989,868Current 38256,372Non-current 0202,200Total 1,238458,572Net AssetsInvested in Capital Assets, net ofRelated debtRestricted for: 04,404,7902,884,4701,468,1911,102,0651,092,422 30,631,484 20,800,719 16,337,035 4,477,670 4,097,680 3,531,296Restricted for: ExpendableUnrestrictedTotal Net AssetsNet assets invested in capital assets, net of related debt, represents Westfield State College’s capitalassets, net of accumulated depreciation and outstanding principal balances of debt attributable to theacquisition, construction or improvement of those assets. By far the largest portion of Westfield StateCollege’s net assets (63% at June 30, 2004 and 65% at June 30, 2003), these capital assets are used toprovide services to students, faculty and administration; consequently, these assets are not available forfuture spending. The 6.1 million increase in net assets invested in capital assets as of June 30, 2004and 3.1 million increase as of June 30, 2003 reflects Westfield State College’s continued developmentand renewal of its capital assets in accordance with its long-range plan.An additional portion of Westfield State College’s net assets, restricted expendable (4% at June 30, 2004and 6% at June 30, 2003) represents scholarships, grants, and donations that are subject to externalrestrictions on how they must be used. Restricted nonexpendable net assets (6% at June 30, 2004 and7% at June 30, 2003) primarily include Westfield State College’s endowment funds. The remainingbalance of unrestricted net assets (27% at June 30, 2004 and 22% at June 30, 2003) may be used to meetWestfield State College’s ongoing obligations.A review of Westfield State College’s statement of net assets at June 30, 2004, 2003 and 2002 showsthat Westfield State College continues to build upon its strong financial foundation. This financialhealth reflects the prudent utilization of its financial resources, including careful cost controls,management of its endowment, conservative utilization of debt and adherence to its long range capitalplan for the maintenance and replacement of the physical plant.As of June 30, 2004, 2003 and 2002 all of Westfield State College’s net asset categories have positivebalances.4
Westfield State College’s Condensed Statement of Revenues, ExpendituresAnd Changes in Net AssetsAs of June 30, 2004, 2003 and 2Operating Revenue 21,071,559 18,357,166 15,055,185---Less: Student Financial AidFederal, state and private grants andContractsTuition and ,712,5964,525,555---Auxiliary ,884372,152 119,394 52,054 6,729Other sourcesTotal Operating revenueLess: Operating expensesNet operating -Non-operating RevenueState appropriation, net-Private gifts and grants---242,231573,094793,896Net investment Interest on capital asset-related debtTotal non-operating revenueIncome before other revenues, expenses, gains orlossesRelated entity 69,476178,54686,264136,165276,213---Additions to permanent endowment-State capital appropriations8,663,376Increase in Net AssetsNet Assets-beginning of yearNet Assets-end of 3,284,286 30,631,484 20,800,719 16,337,035 4,477,670 4,097,680 3,531,296Westfield State College’s Condensed Statement of Cash FlowsAs of June 30, 2004, 2003 and titution200420032002Cash received from operating activities 41,726,418 37,951,340Cash expended for operating activities(56,555,990)Net cash used by operating activitiesNet cash provided by non-capital financing activitiesNet cash used by capital and related financingactivitiesNet cash provided (used) by investing activitiesNet (decrease) increase in cashCash – beginning of yearCash – end of tion2003 33,855,800 119,394 52,054 ,473,0725,635,2223,500,160329,502295,995622,447 10,439,604 10,473,072 5,635,222 92,953 329,502 295,9955
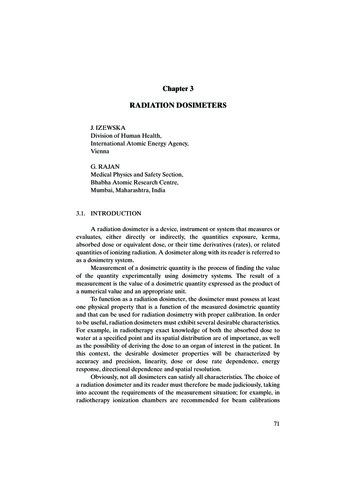
Westfield State College’s combined liquidity decreased slightly during the year ended June 30,2004 with a 270,017 decrease in cash. The following discussion amplifies the overview of cashflows presented above.For the year ended June 30, 2004, the College’s cash used by operating activities increasedapproximately 5.0 million over the prior year. This was due to an increase in cash received of 3.8million offset by increases in amounts paid of 8.8 million. State appropriations decreased by 1.6million during the current year, which resulted in the decrease in net cash provided by noncapitalfinancing activities. Cash used by capital and related financing activities decreased approximately 1.6 million due to various factors including a decrease in purchases of capital assets, an increase instate capital appropriations, higher principal debt and interest payments, and a decrease in proceedsfrom capital debt. A slight increase in cash provided by investing activities of 32,484 was alsorecognized during the fiscal year ended June 30, 2004.During the year ended June 30, 2003, Westfield State College’s combined liquidity improved with a 4.9 million increase in cash. The following discussion amplifies the overview of cash flowspresented above.For the year ended June 30, 2003, the College’s cash used by operating activities decreasedapproximately 5.0 million over the prior year. This was due in part to an increase in cash receivedfor tuition and fees of 2.6 million combined with a decrease in amounts paid to employees of 1.8million. State appropriations decreased by 1.4 million during the current year, which resulted inthe decrease in net cash provided by noncapital financing activities. Cash used by capital andrelated financing activities increased approximately 656,000 due to various factors includinghigher principal debt and interest payments, a decrease in state capital appropriations and anincrease in purchases of capital assets. More favorable market conditions during the fiscal yearended June 30, 2003 resulted in a slight increase in cash provided by investing activities ofapproximately 50,000.The following is a graphic illustration of operating revenues by source, which were used to fund theCollege’s operating activities for the years ended June 30, 2004, 2003 and 2002.Operating Revenues by Source - Primary Institution60%50%40%30%20%10%0%T u it io n a n d f e e s , n e to f s t u d e n t f in a n c ia la idF e d e ra l, s t a t e a n dp riv a t e g if t s , g ra n t sa n d c o n t ra c t sA u xilia ry o p e ra t io n s ,ne t o f s tude ntf in a n c ia l a idO t h e r s o u rc e s200455%13 %30%2%200353%15 %3 1%1%200248%17 %34%1%6
The College’s operating revenues consist primarily of tuition and fee revenue and auxiliaryoperations. Tuition and fee revenue increased 2.7 million or 15% during the fiscal year endedJune 30, 2004 and increased 3.3 million or 22% during the fiscal year ended June 30, 2003. Theprimary factor relating to the change during fiscal year 2004 was an increase in technology fees of 800 per student. Major factors impacting the increase during fiscal year 2003 include higher thanprevious year enrollment, an increase in general student fees of 659 per student ( 2.5million) andan increase in technology fees of 140 per student ( .5million).Tuition and fees received by the College include the following:TuitionStudent Activity Fees:General feesStudent feesTechnology feesMiscellaneous feesTotalJune 30, 2004 7,378,225June 30, 2003 7,589,997June 30, 2002 7,354,7488,722,486702,3034,049,425219,120 21,071,5598,581,854719,3171,226,653239,345 18,357,1666,044,845702,002729,326224,264 15,055,185Auxiliary operations include the operation of the College’s Building Authority trust fund and itsfood service. The revenue generated from these operations was 10,323,956, 9,584,199, and 9,007,814 (which is net of scholarship allowances of 1,265,193, 1,476,244, and 1,461,887) forthe years ended June 30, 2004, 2003 and 2002, respectively. The increase in revenues of 739,757or 7.7% is attributable to the increase in room and board charges combined with a decrease in thescholarship allowance for the year ended June 30, 2004. The increase in revenues of 576,000 or6.4% is attributable to the increase in room and board charges for the year ended June 30, 2003.Major grants and contracts received by Westfield State College for the years ended June 30, 2004,2003 and 2002 included the following:U.S. Department of Education – Student Support Services 244,858 (2004) 245,057 (2003) 256,995 (2002)U.S. Department of Education – College Work Study 368,333 (2004, 2003 and 2002)U.S. Department of Education – SEOG 295,448 (2004, 2003 and 2002)The following is a graphic illustration of operating expenses by function for the year ended June 30,2004, 2003 and 2002.7
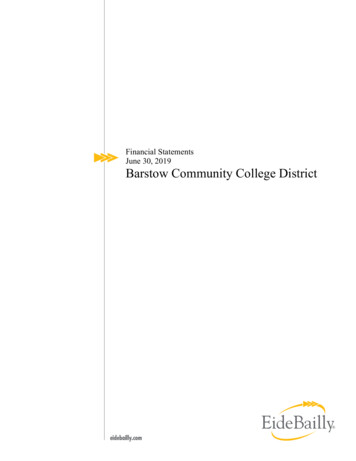
Operating Expenses by Function - Primary Institution40%35%30%25%20%15%10%5%0%Inst ruct ionAcademicSt udentInst it uionalSupportServicesSupportOpert ion andmaint enance ofScholarshipsPlantAuxiliaryOperat ionsDepreciat %4%200238%7%12%7%11%1%19%4%A summary of the College’s expenses by functional classification for the years ended June 30,2004, 2003 and 2002 is as follows:InstructionPublic serviceAcademic supportStudent servicesInstitutional supportOperation and maintenance of plantScholarships and fellowshipsAuxiliary operationsLoss on disposal of assetsDepreciationTotalJune 30, 2004June 30, 2003June 30, 2002 4101,174,1729,537,40259,2802,695,126 53,211,861 590531,3069,736,6188,6762,068,735 47,957,114 576340,7758,958,75521,1642,035,167 48,202,017The College’s total operating expenses increased significantly during fiscal year ended June 30,2004 by 5,254,747 or 11% due to various factors including an increase in salaries and associatedfringe benefits resulting from the Commonwealth’s decision to fund the outstanding collectivebargaining salary and wage increases for two previous fiscal years. However, only a portion of theretroactive salary adjustments have been funded by the Commonwealth to date. The remainingpotential liability for the Commonwealth is estimated at approximately 1.5 million. Other factorsimpacting the increase are increases in student scholarships, an increase in costs associated withimplementing our new computer system, and increased spending related to maintaining andimproving campus facilities. During fiscal year ended June 30, 2003 the College’s total operatingexpenses decreased by 244,903 or .5% due to various factors including a reduction in salaries andassociated fringe benefits as a result of the early retirement incentive program effective June 30,2002 and budget mandated departmental spending decreases. These decreases were offset byexpense increases related to higher utility costs, increases in scholarship expense, and increases inauxiliary operations expense.8
Loss from OperationsThe following table presents the College’s incurred losses from operations and its non-operatingrevenues for the fiscal years ended June 30, 2004, 2003 and 2002Tuition and feesOther revenue, net of Student Financial AidOperating expensesOperating lossCommonwealth direct appropriation, fringe benefitsfor Commonwealth employees, net of tuition remittedto the CommonwealthInvestment IncomeInterest on capital asset-related debtRelated entity transfersState capital appropriationNon-operating revenuesIncrease in net assetsJune 30, 2004June 30, 2003June 30, 2002 21,071,55912,945,38653,211,861(19,194,916) 18,357,16612,318,07047,957,114(17,281,878) 781329,481(112,332)(25,000)276,21323,492,143 9,830,765 4,463,684 2,147,140Due to the nature of public higher education, institutions incur a loss from operations. TheCommonwealth’s Board of Higher Education determines tuition while the College sets fees andother charges. The College, with the purpose of balancing educational and operational needs withtuition and fee revenue, approves budgets to mitigate losses after Commonwealth appropriations.The 7.3 million increase in non-operating revenues during fiscal year 2004 is associated with therecognition of a state capital appropriation in the amount of approximately 7.8 million forconstruction expenditures related to the new academic/athletic facility, the Woodward Center,discussed below. The College also received an 850,000 capital appropriation for the purchase ofequipment and furnishings for the Woodward Center. These increases were offset by a decrease inthe Commonwealth direct appropriation of 1.4 million.Capital Assets and Debts of Westfield State CollegeWestfield State College’s investment in capital assets, net of accumulated depreciation, as of June30, 2004, 2003 and 2002 was 29,548,713, 21,430,823 and 15,413,331 respectively. Thisinvestment in capital assets includes land, land improvements, buildings and improvements,furnishings and equipment, construction in progress, and library books. The capital asset increase of 8.1 million or 38% during the fiscal year ended June 30, 2004, and increase of 6.0 million or 39%during the fiscal year ended June 30, 2003 was due to capital additions outpacing depreciationexpense. Capital additions during the fiscal year ended June 30, 2004 amounted to 10,827,767 ascompared to 8,099,054 as of June 30, 2003, and 2,367,635 as of June 30, 2002. Major additionsduring 2004 include construction expenses related to the Woodward Center ( 7,800,000), theconstruction of a new student parking lot ( 1,100,000), construction expenses related to the storagefacility for the Woodward Center in progress at June 30, 2004 ( 114,000), the purchase ofequipment and furnishings for the Woodward Center ( 572,000), and the purchase of manycomputers for faculty and staff ( 295,000). Major additions during 2003 include constructionexpenses related to the academic/athletic facility in progress at June 30, 2003 ( 5,200,000), the roofreplacement to the administration building at 333 Western Avenue ( 429,000), the installation of anew e-mail system including hardware and software ( 199,000), the installation of a new telephonesystem ( 534,000), the installation of the new administrative computing system called Banner,including hardware, software and installation costs ( 604,000), and the purchase of many computersfor faculty and staff ( 232,000).9
The completion of the Woodward Center, Westfield State College’s new academic/athletic facilitytook place during fiscal year ended June 30, 2004. This facility will be shared by the AthleticDepartment and the Movement Science Department. The surrounding community will also haveaccess to the facility. The Commonwealth of Massachusetts and the College shared funding for thisproject. The Commonwealth appropriated 9.6 million and the college borrowed 5.8 million fromthe Massachusetts Health and Educational Facilities Authority (MHEFA) to partially fund theproject. The College’s portion will be repaid over a twenty-year period from an existing studentfee, which has been budgeted for this project. The receipts from Westfield State College’s firstfund raising capital campaign may help to reduce this debt. As of June 30, 2004 and 2003 theoutstanding debt on the MHEFA borrowing amounted to 5,491,105, and 5,658,206, respectively.Economic Factors That Will Affect the FutureApproximately 35% of the College’s operational budget depends on revenue from the state (i.e. thestate’s allocation to its agencies, of which the college is but one of numerous major state agenciesfunded). When the state’s revenue declines, legislative action has been to reduce the state’sallocation to the college. Give
Westfield Savings Bank WESTFIELD STATE COLLEGE Robert A. Magovern, B.S. President Neighbor to Neighbor of America, Inc. ANNUAL REPORT Cornelius D. Mahoney, M.B.A. (Chair) President and Chief Executive Officer Woronoco Savings Bank Pablo A. Nyarady, B.E. President and Chief Executive Officer Transcon Technologies, Inc. (d/b/a ECI,