Transcription
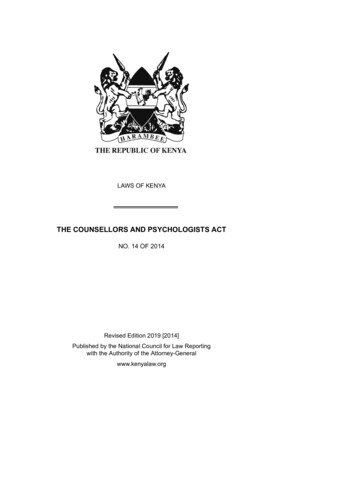
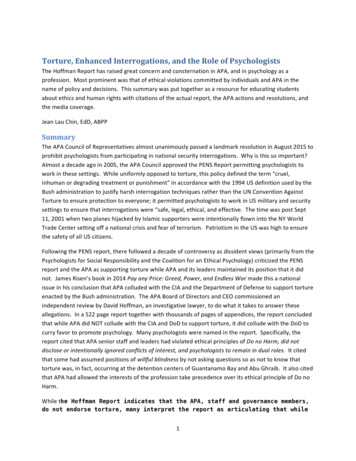
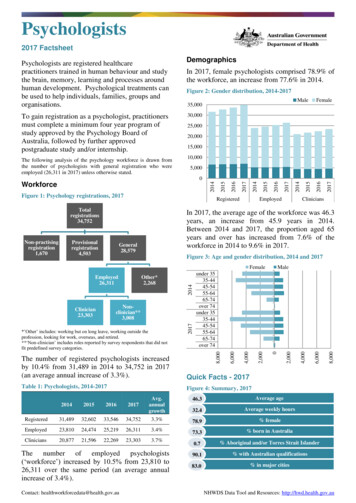
Psychologists2017 FactsheetPsychologists are registered healthcarepractitioners trained in human behaviour and studythe brain, memory, learning and processes aroundhuman development. Psychological treatments canbe used to help individuals, families, groups andorganisations.To gain registration as a psychologist, practitionersmust complete a minimum four year program ofstudy approved by the Psychology Board ofAustralia, followed by further approvedpostgraduate study and/or internship.The following analysis of the psychology workforce is drawn fromthe number of psychologists with general registration who wereemployed (26,311 in 2017) unless otherwise stated.DemographicsIn 2017, female psychologists comprised 78.9% ofthe workforce, an increase from 77.6% in 2014.Figure 2: Gender distribution, 0,0005,000Figure 1: Psychology registrations, 5792017201620152014Figure 3: Age and gender distribution, 2014 and 201720162017Avg.annualgrowth46.3Average age32.4Average weekly hoursRegistered31,48932,60233,54634,7523.3%78.9% femaleEmployed23,81024,47425,21926,3113.4%73.3% born in % Aboriginal and/or Torres Strait Islander90.1% with Australian qualifications83.0% in major citiesThe number of employed psychologists(‘workforce’) increased by 10.5% from 23,810 to26,311 over the same period (an average annualincrease of 3.4%).Contact: healthworkforcedata@health.gov.au8,000Figure 4: Summary, 20176,000Table 1: Psychologists, 2014-20174,000Quick Facts - 20172,000The number of registered psychologists increasedby 10.4% from 31,489 in 2014 to 34,752 in 2017(an average annual increase of 3.3%).02,0004,0008,000*’Other’ includes: working but on long leave, working outside theprofession, looking for work, overseas, and retired.**‘Non-clinician’ includes roles reported by survey respondents that did notfit predefined survey aleunder 3535-4445-5455-6465-74over 74under 3535-4445-5455-6465-74over In 2017, the average age of the workforce was 46.3years, an increase from 45.9 years in 2014.Between 2014 and 2017, the proportion aged 65years and over has increased from 7.6% of theworkforce in 2014 to 9.6% in ,670201520140WorkforceNHWDS Data Tool and Resources: http://hwd.health.gov.au
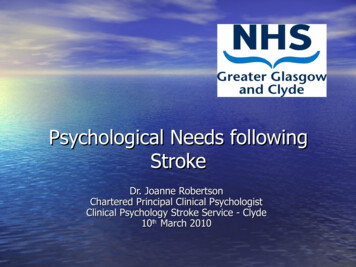
Replacement RateSecond job roleIn 2017, there were 2.0 new registrants for everypsychologist that did not renew their registrationfrom 2016.In 2017, 21.2% of the workforce reported a secondjob role in psychology, a decrease from 22.2% in2014.Hours WorkedTable 4: Second job role, 2014 and 2017In 2017, psychologists worked an average of 32.4hours per week in total, and worked an average of8.7 hours per week in non-clinical roles.Table 2: Average hours per week, 2014-2017Average 6Non-clinical9.28.99.08.7Total32.832.432.632.4In 2017, female psychologists worked an averageof 31.5 hours per week, a decrease from 31.6 hoursin 2014. Male psychologists worked an average of35.8 hours per week, decreasing from 36.7 hours in2014. In 2017, males in the 45-54 age groupworked the most hours, at 38.4 hours per week onaverage.Figure 5: Average hours per week by gender and agegroup, 2014 and 2017Average hours worked454035302014Second istratorTeacher icianArea of Practice EndorsementTo be eligible to apply for an area of practiceendorsement, a psychologist must undertakeadvanced training (an accredited qualification inthe area of practice followed by a period ofsupervised practice).In 2017, 38.6% of the workforce held at least onearea of practice endorsement, increasing from36.5% in 2014. The most common area of practiceendorsement was Clinical psychology, which washeld by 29.0% of the workforce while all otherendorsements were held by less than 4% of theworkforce.Table 5: Area of practice endorsement, 2014 and 2017252015Males - 2014Males - 2017Females - 2014Females - 2017Area of 9Age groupJob RolePrincipal roleIn 2017, 88.6% of psychologists worked as aclinician in their principal role, an increase from87.7% in 2014.Table 3: Principal role, 2014 and 20172014Principal ministratorTeacher linicianContact: healthworkforcedata@health.gov.auClinical logyEducational anddevelopmentalpsychologyForensic psychologyOrganisationalpsychologyHealth psychologySport and rincipal Work SectorIn 2017, 31.6% of the workforce reported that intheir principal role, they worked only in the publicsector, a decrease from 35.1% in 2014.NHWDS Data Tool and Resources: http://hwd.health.gov.au
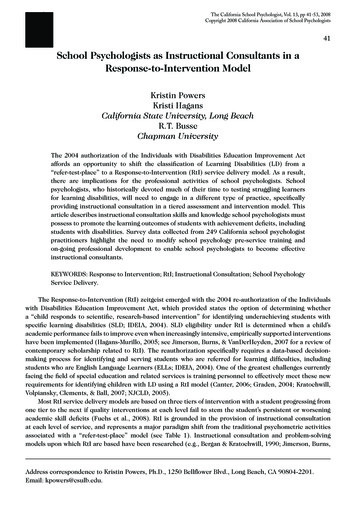
Of those psychologists reporting a second job rolein 2017, 80.5% reported they worked only in theprivate sector, an increase from 79.3% in 2014.Note: In this instance the principal work setting headcount for the reportedsecond job does not equal the principal role for the reported second job. Thisoccurs when the survey respondent indicates a second job work setting butnot a second job principal role.Figure 6: Sector in which clinical hours were worked,2014 and 2017Principal Job AreaJob 2Job 1Public sector onlyBothPrivate sector only20142017201420170%20%40%60%80%100%Note: ‘Not applicable’ responses are excluded from the chartIn 2017, 40.2% of psychologists worked in a Soloor Group private practice setting in their principalrole, an increase from 36.8% in 2014, and 10.4%worked in a School setting, a decrease from 10.6%in 2014.In 2017, psychologists working in the Defenceforces (included in ‘Remaining work settings’)reported the highest average weekly hours (35.8)and those in GP practices reported the lowestaverage weekly hours (28.7).Table 6: Principal work setting, 2014 and 2017Solo privatepracticeGroup privatepracticeSchoolCommunitymental her gov deptCommercial/business serviceOthercommunityhealth careserviceOtherGeneralpractitioner(GP) practiceOther privatepracticeRemainingwork settingsTotalBetween 2014 and 2017, the proportion ofpsychologist reporting Mental health interventionas the principal area of their main job increased by21.6%, while those working in the areas ofTraining for work purposes and Consulting /advising for work decreased by over 18%.Table 7: Principal job area, 2014 and 2017Principal Work SettingPrincipal worksettingIn 2017, almost half (42.1%) of the psychologyworkforce reported that the principal area of theirmain job was Counselling and over a quarter(26.6%) reported Mental health 6922170882176Prinicpaljob cognitiveassessmentPsychologymanagement/ adminConsulting/advising forworkOtherResearchand lassessmentPersonaldevelopment/ coachingRecruitmentTraining 066%42.12014 3Initial Qualification2,1513102,286362The workforce survey asks psychologists wherethey obtained their initial qualification. In 2017,23,8105,96126,3116,563Contact: healthworkforcedata@health.gov.auNHWDS Data Tool and Resources: http://hwd.health.gov.au
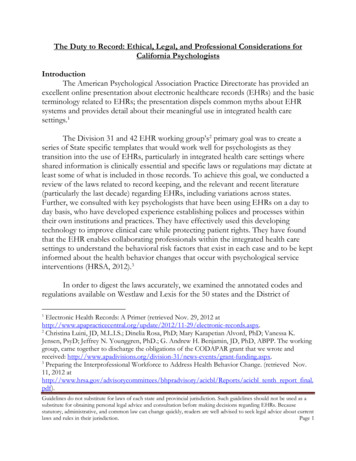
90.1% of the workforce obtained their initialqualification in Australia and 8.1% obtained theirinitial qualification overseas.Table 8: Distribution by state/territory, 2017State /TerritoryHeadcountTotalFTEAvg.totalhours2FTE rateper 732.491.1Figure 7: Initial qualifications, 5,00002014201520162017Note: ‘Not stated/Unknown’ responses are excluded from this chartNote: ‘Not stated/Unknown’ are excluded from this table but are included inthe totalWorking IntentionsIn 2017, psychologists had, on average, worked 15years in the profession and intended to work foranother 19 years. In 2014, psychologists hadworked 14 years on average, and had intended towork for another 19 years.Figure 8: Workforce intentions by principal role, 2017Years workedYears intended to workClinicianAdministratorRemoteness AreaIn 2017, 95.3% of psychologists worked in eithermajor cities or inner regional locations, comparedto 95.1% in 2014.Between 2014 and 2017, the largest shift inaverage hours worked was in remote areas,decreasing from 35.4 hours per week in 2014 to33.3 hours in 2017. Subsequently, the FTE rate inremote areas decreased by -1.7.Table 9: Distribution by remoteness area, 2017Teacher or alhoursrateper 100,000populationMajor cities21,84918,550.532.3105.0Inner regional3,2142,735.332.362.3DistributionOuter regional1,059956.034.346.7State and TerritoryRemote124108.833.337.2Very erOther201510505101520In 2017, the jurisdictions with the most full-timeequivalent psychologists per 100,000 population(FTE rate) were ACT and VIC. Between 2014 and2017 the total FTE rate increased from 87.5 to91.1. However, during this period, the number ofpsychologists in the NT decreased from 189 to 182and correspondingly the FTE rate in the NTdecreased by -6.6.In 2017, psychologists in NT worked the mosthours per week on average (36.7 hours) and thosein VIC worked the fewest (31.6 hours).Contact: healthworkforcedata@health.gov.auTotalNote: ‘Not stated/Unknown’ are excluded from this table but are included inthe totalOther Work Location Outside Major CitiesIn 2017, 6.2% of the psychology workforcereported that they had worked in a regional, ruralor remote location, in addition to their principal orsecond job location. Of these respondents, 72.0%had worked in an inner regional or outer regionallocation, and 10.3% had worked in either remoteor very remote locations.NHWDS Data Tool and Resources: http://hwd.health.gov.au
ReferencesModified Monash ModelIn 2017, the majority (82.8%) of FTEpsychologists were located in a major city or alocation considered as MMM1 under the ModifiedMonash Model (MMM) classification system, anincrease from 82.6 % in 2014.(See www.doctorconnect.gov.au for more information on the MMM).Figure 9: FTE distribution by MMM, 2017MMM2MMM4MMM3MMM5MMM6MMM1MMM71) National Health Workforce Dataset (NHWDS): AlliedHealth Practitioners 2014-2017.2) ABS - 3218.0 - Regional Population Growth, Australia,2016-17, Released 31/08/18.Notes1) ‘NP’ denotes figures that are not published (supressed)for confidentiality reasons2) The 2013-2016 NHWDS have been revised due to anerror in recoding the missing values for job role. As suchthe figures may not match those that were previouslypublished.3) FTE number measures the number of standard-hourworkloads worked by employed health practitioners. TheFTE number provides a useful measure of supplybecause it takes into account both the number ofpractitioners who are working and the hours that theywork. FTE number is calculated based on the total hoursworked in a 'standard working week'. The standardworking week is assumed to be 38 hours, equivalent to 1FTE for all practitioners with the exception of medicalpractitioners where it is assumed to be 40 hours.Commonwealth of Australia 2019MMM1 locations had the highest FTE rate ofpsychologists (105.6) followed by MMM3 (76.7).The lowest FTE rate was in MMM5 locations(20.0).Tele-HealthThe workforce survey asks psychologists to reporttheir hours practiced via tele-health in psychologyin the previous year.Note: Tele-health is the use of telecommunication techniques for thepurpose of providing telemedicine, medical education, and healtheducation over a distance.A total of 3,357 psychologists (12.8%) provided aresponse to the Tele-Health question in 2017. Onaverage, these respondents practiced via TeleHealth for 3.5 hours per week, with the majority(82.5%) of Tele-Health services provided bypractitioners based in a major city.This work is copyright. You may download, display, print andreproduce the whole or part of this work in unaltered form for yourown personal use or, if you are part of an organisation, for internaluse within your organisation, but only if you or your organisation donot use the reproduction for any commercial purpose and retain thiscopyright notice and all disclaimer notices as part of thatreproduction.Apart from rights to use as permitted by the Copyright Act 1968 orallowed by this copyright notice, all other rights are reserved andyou are not allowed to reproduce the whole or any part of this workin any way (electronic or otherwise) without first being given thespecific written permission from the Commonwealth to do so.Requests and inquiries concerning reproduction and rights are to besent to the Communication Branch, Department of Health, GPOBox 9848, Canberra ACT 2601, or via e-mail tocopyright@health.gov.au.Enquiries concerning this report and its reproduction should bedirected to:Department of HealthGPO Box 9848Canberra ACT 2601healthworkforcedata@health.gov.auTable 9: Tele-Health psychologists by remotenesslocation, yremote82.5%11.2%5.3%0.7%0.3%Note: The tele-health workforce remoteness location refers to thelocation of the Practitioner, not the location of the person receivingthe service.Contact: healthworkforcedata@health.gov.auNHWDS Data Tool and Resources: http://hwd.health.gov.au
In 2017, 40.2% of psychologists worked in a Solo or Group private practice setting in their principal role, an increase from 36.8% in 2014, and 10.4% worked in a School setting, a decrease from 10.6% in 2014. In 2017, psychologists working in the Defence forces (included in 'Remaining work settings')