Transcription
2009-2010 Performance ReportSouth Plains College – 1SPEST. 1957LIEAMTIDRESHNPLAI S COLGELESOUT2009-2010RECEDE REASouth Plains Collegeimproves each student’s life.SEPTEMBER 2010
2 – South Plains College2009-2010 Performance Report
2009-2010 Performance ReportSouth Plains College – 3IntroductionSouth Plains College has made a significant commitment to accountability and quality with the adoption of a comprehensive institutional effectiveness program. This planning and assessment process isbased on successful accomplishments of the college’s vision and mission within the context of an institutional plan and as measured by student and institutional outcomes.To ensure effectiveness, South Plains College has embraced a process of continuous organizational improvement designed to improve the way the work of the institution is done and to accomplish the goalsand objectives of the institution. The college has established a four-year strategic planning cycle thatsets institutional goals based on a review of the college’s vision, mission, role and scope, and commitment statements. Each goal is reached through a set of priority objectives and strategies. These goals,objectives and strategies formulate the college’s Institutional Plan and provide the framework for thedevelopment of operational objectives on departmental and program levels.A companion assessment process measures the extent to which the college accomplishes its missionthrough its Institutional Plan. The college has identified these indicators as Critical Success Factors(CSF) and Indicators of Institutional Effectiveness which map the college’s performance against highstandards. The college uses this process to monitor its effectiveness and make necessary adjustments inprograms and services.A yearly update of the institutional effectiveness program is presented to the South Plains CollegeBoard of Regents. The document used to convey these annual results is the Institutional Effectiveness Performance Report. The 2009-10 Performance Report presents the most recent available assessment resultsrecorded for Year 1 of the 2009-2013 Institutional Plan.For additional information about the institutional effectiveness program at South Plains College or toaddress questions, contact the Office of Institutional Advancement, South Plains College, 1401 S. College Ave., Levelland, Texas 79336. Telephone: (806) 716-2217 or (806) 716-2218.
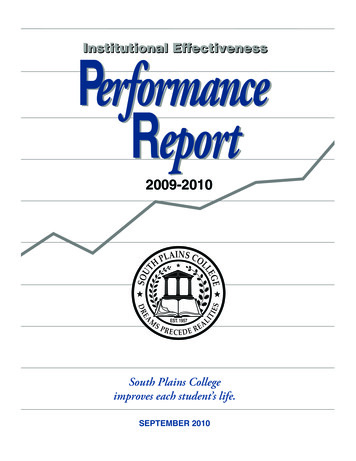
4 – South Plains College2009-2010 Performance ReportCritical Success Factorsand Indicators of Institutional EffectivenessInstitutional effectiveness is at the heart of what an institution does. South Plains College believes that its institutional effectiveness process will improve teaching and learning and contribute to the attainment of the college’svision and validation of its mission.South Plains College measures its performance through an outcome-based assessment process. The college hasidentified six factors that are critical to its success as an institution of higher learning. Through these Critical Success Factors, SPC maintains a comprehensive evaluation system that measures the extent to which institutionalgoals and objectives are accomplished. These Critical Success Factors include the following.Dynamic Educational Programs and Quality InstructionStudent Success OutcomesQuality Student and Support ServicesEconomic Development and Community InvolvementEffective Leadership and ManagementCollaborative Organizational ClimateTo monitor progress and achievement in each of these areas, the college has identified 26 indicators of institutional effectiveness. Benchmarks (standards) have been developed for each of these measures. The results ofperformance are compared against these benchmarks and indicate how well the college has achieved its statedgoals and objectives. The achievement of the identified Critical Success Factors is positive proof of the college’seffectiveness. This system of outcome assessment against critical success factors is illustrated in the table found onpage 6.The indicators and benchmarks and their supporting measurement criteria are the observed, quantified or qualified results of performance. The collected data provide valuable information for those making decisions about thefuture direction of the college. The following section contains the identified benchmarks for evaluation and thereview of data which describes the college’s performance in each critical success area. Interpretation of the findings is provided for each benchmark and if the standard was not met, an action plan for the next year (2009-10)has been developed.Definition of Critical Success FactorsCSF A: Dynamic Educational Programs and Quality InstructionThe primary mission of South Plains College is to provide quality educational programs that prepare studentsfor transfer to a university or to enter the workplace. Faculty design curricula to develop students’ competencies,skills and general knowledge in order to be successful in a rapidly changing world. The quality of instructionreceived by the student in these programs is an essential contributor to student success. At the same time, thesecurricula address the needs and expectations of transfer institutions, employers in business and industry, and accrediting bodies.CSF B: Student SUCCESS OutcomesThe success of South Plains College is measured by the success of students as they attain their goals. These goalsmay include remaining in college and graduating in a field of study, attaining specific job skills, successfullytransferring to a university, obtaining employment in the workplace, obtaining licensure in certain professions,and performing well in their chosen careers.
2009-2010 Performance ReportSouth Plains College – 5CSF C: Quality Student AND Support ServicesSouth Plains College provides opportunities for widely diverse populations to access its educational programsand services. To successfully respond to these constituencies, the college continually assesses the needs and satisfaction levels of its students, alumni and employers. This information is used to provide appropriate programs,services, facilities, technology and resources to assist students in achieving their goals.CSF D: Economic Development & Community ENGAGEMENTThe college supports economic and workforce development by providing educational programs that facilitatethe training of entry-level workers and the retraining of current workers, based on local business and industrydemands. South Plains College faculty, staff and students are actively involved in the community and its development. At the same time, the community is actively engaged in the events, activities and programs of the college.CSF E: Effective Leadership & ManagementTo be effective, the college must be accountable to the citizens and students who provide resources. This accountability includes demonstrating effective leadership, cooperative planning, resource management, acquisition ofresources and the development of facilities and technology in order to accomplish college goals.CSF F: Collaborative Organizational ClimateThe culture of an organization powerfully influences the performance of its members, the use of resources, andthe quality of its programs and services. South Plains College seeks to promote a collaborative institutionalclimate through a shared institutional vision and common organizational values. Decision-making and resourceallocation reflect these values and are influenced by broad input from college employees.Comparative StandardsThe Texas Higher Education Coordinating Board has developed, in consultation with the state’s community colleges, the Community College Accountability System which reports the performance of thestate’s 51 community college districts in the areas of participation, success, and excellence. Key measures and contextual measures for each of these areas are defined and data is collected and reportedon an annual basis. South Plains College has incorporated a number of these measures and standards,as reported in this Institutional Effectiveness Performance Report, into its overall system of outcome assessment. As a result, SPC’s performance is compared against the performance of all Texas communitycolleges, as well as a Large College Peer Group that is based on enrollment. The following institutionsform the Large College Peer Group.Amarillo College, Amarillo, TexasBlinn College, Brenham and Bryan/College Station, TexasCentral Texas College, Killeen, TexasDel Mar College, Corpus Christi, TexasLaredo Community College, Laredo, TexasSouth Plains College, Levelland, Lubbock and Plainview, TexasTexas Southmost College, Brownsville, TexasTyler Junior College, Tyler, Texas
perativeof ResourcesPlanning &Goal AttainmentCSF-EEFFECTIVELEADERSHIP& MANAGEMENTInteractionwith theCommunityAssessmentof Programs& ServicesEducationin Supportof EconomicDevelopmentAccess,Participation& EquityCSF-DECONOMICDEVELOPMENT& COMMUNITYENGAGEMENTCSF-CQUALITYSTUDENT& SUPPORTSERVICES3EmployeeSatisfactionAcquisition ofPublic/PrivateResourcesPartnerships& AlliancesRetention& PersistenceAcademicTransfer eementsReview &Planning1EmployerSatisfactionof sageProgramPlacementStudentSatisfactionof Instruction4Success inDevelopmentalEducationFacultyQualifications& Instruction6INDICATORS OF INSTITUTIONAL MS& QUALITYINSTRUCTIONCRITICALSUCCESSFACTORSSYSTEM OF OUTCOME ASSESSMENTPersonal Growthand GoalAttainment76 – South Plains College2009-2010 Performance Report
2009-2010 Performance ReportSouth Plains College – 7Index of Effectiveness IndicatorsCSF A: Dynamic Educational Programs and Quality InstructionA-1: Curriculum Review and Planning. 8A-2: Accreditation. 8A-3: Articulation Agreements. 9A-4: Student Satisfaction with Instruction. 10A-5: Employer Satisfaction with Graduates.11A-6: Faculty Qualifications and Instruction. 12CSF B: Student Success OutcomesB-1:B-2:B-3:B-4:B-5:B-6:B-7:Course Completion. 14Graduation and Persistence Rates. 14Academic Transfer and Performance. 17Technical Program Placement Rates. 21Licensure Passage and Skills Attainment. 22Success in Developmental Education. 24Personal Growth and Goal Attainment. 25CSF C: Quality Student and Support ServicesC-1: Access, Participation and Equity. 26C-2: Assessment of Programs and Services. 30C-3: Retention and Persistence. 33CSF D: Economic Development and Community EngagementD-1: Education in Support of Economic Development. 35D-2: Interaction with the Community. 36D-3: Partnerships and Alliances. 39CSF E: Effective Leadership and ManagementE-1:E-2:E-3:E-4:Cooperative Planning and Goal Attainment. 40Management of Resources. 40Acquisition of Public/Private Resources. 43Facility Development. 45CSF F: Collaborative Organizational ClimateF-1: Ongoing Professional Development. 47F-2: Employee Diversity. 47F-3: Employee Satisfaction. 49
8 – South Plains College2009-2010 Performance ReportCSF A: Dynamic Educational Programsand Quality InstructionMeasurement A-1: Curriculum Review and PlanningBenchmark and ResultsA-1.1 The number of curriculum changes each year will be within the normal limits of variationfrom year to year or the reasons for the extra variation will be known.Number of Curriculum ChangesAnnual Report to the riculum Changes1501721821726955Upper Control Limit221221221221221221SOURCE: Office of Academic AffairsInterpretation:South Plains College provides an up-to-date curriculum to meet the needs of students andservice area constituents. Changes to the curriculum are made annually. The number of curriculum changes has remained relatively stable. The annual number of changes is still belowthe upper control limit which is calculated as two Standard Deviations above the Mean of thepopulation. The standard is met.Measurement A-2: AccreditationBenchmark and ResultsA-2.1 Individual educational programs subject to accreditation by external review bodies shallachieve re-accreditation status with a minimum of recommendations.Status Report: The following programs received accreditation or certification by external review bodies. The Associate Degree Nursing Program received full program approval status with commendations from the Texas Board of Nursing. The Vocational Nursing Programs at Levelland, Reese and Plainview received full programapproval status with commendations from the Texas Board of Nursing.
2009-2010 Performance ReportSouth Plains College – 9Measurement A-3: Articulation AgreementsBenchmark and ResultsA-3.1 South Plains College will maintain articulation agreements with 100% of all accredited universities in the college’s service area.Status Report: South Plains College maintains active articulation agreements with the following accredited universities: Texas Tech University, Lubbock Christian University and Wayland Baptist University.Additionally, articulation agreements are maintained with the following universities locatedoutside the college’s service area: West Texas A&M University, Eastern New Mexico University,Midwestern University, Sul Ross State University and Angelo State University. The standard ismet.Benchmark and ResultsA.3-2 South Plains College will increase articulation agreements with accredited IndependentSchool Districts in the college’s service area by 5% each year until 100% saturation is reached.Number of Articulation Agreements with Service Area ISDsData Elements2007-082008-092009-10Total Service Area ISDs494949Tech Prep Agreements494949Dual Credit Agreements446265100%100%100%Percent InvolvementSOURCE: Office of Academic AffairsInterpretation:The college maintains some form of articulation agreement with 100% of the public schooldistricts in the college’s service area. In some districts, multiple agreements are maintained.An active partnership with the Region 17 Education Service Center ITV network has allowedthe college to expand dual credit articulation efforts and deliver additional courses beyond itsservice area. Additionally, the college has established dual credit partnerships with private highschools and charter schools operating within the service area. Options to offer home-schooledstudents dual credit have also been implemented, expanding the number of dual credit agreements to 65 for 2009-10. The standard is met.
10 – South Plains College2009-2010 Performance ReportMeasurement A-4: Student Satisfaction with InstructionBenchmark and ResultsA-4.1 Students participating in the annual faculty evaluation survey will rate their level of satisfaction with courses and instruction above average (greater than 3.5 on 5.0 scale) in all categories.Student Evaluation of InstructionAnnual Report to the Board2005-062006-072007-082008-092009-10Overall Rating of Instruction4.624.714.704.644.67SOURCE: Office of Academic AffairsInterpretation:The quality of instruction at SPC is rated annually by students through the faculty evaluationprocess. SPC students continue to rate their overall level of satisfaction with instruction veryhigh. The measure has exceeded the benchmark by 1.6 points throughout the reported years.The overall rating has approached excellent on the scale (5.0), indicating consistent instructionalquality. The standard is met. The student evaluation of instruction process is monitored by theFaculty Evaluation Committee.Benchmark and ResultsA-4.2 Technical graduates will rate their level of satisfaction of program training in relation to jobabove average (greater than 3.5 on 5.0 scale) in all survey categories.DEGREE OF SATISFACTION WITH CAREER PREPARATIONSurvey Statements2007 Cohort2008 CohortSatisfaction with preparation for current job3.984.03Satisfaction with preparation for additional study4.013.98SOURCE: Technical Graduate Follow-up SurveyInterpretation:A Graduate Follow-up Survey was developed and piloted with a 2007 graduate cohort (December 2006 grads and May 2007 grads). The survey was also administered to the 2008 graduatecohort (December 2007 and May 2008 grads). In both surveys, respondents expressed aboveaverage satisfaction with preparation for job and/or additional study beyond their degree orcertificate. The standard is met. The follow-up system is in the process of being operationalized.The Institutional Effectiveness Committee, in consultation with the Instructional Council, willdevelop guidelines for operationalizing the graduate follow-up system in Year 2 of the 20092013 Institutional Plan (2010-11).
2009-2010 Performance ReportSouth Plains College – 11Benchmark and ResultsA-4.3 Arts and Sciences graduates will rate their level of satisfaction with instruction above average (greater than 5.0 on 7.0 scale) in all survey categories.Action Plan:Plans are underway to develop an Arts and Sciences Graduate Follow-up Survey to providedata for this performance measure. The Institutional Effectiveness Committee, in consultationwith the Instructional Council, will develop and pilot an Arts and Sciences Graduate Follow-upSurvey instrument in Year 2 of the 2009-2013 Institutional Plan (2010-11) and will operationalizethe follow-up system in Year 3 (2011-2012).Measurement A-5: Employer Satisfaction with GraduatesBenchmark and ResultsA-5.1 Employers of SPC graduates will rate their satisfaction of technical training received in relation to job requirements above average (greater than 3.5 on 5.0 scale) in all survey categories.EMPLOYER SATISFACTION WITH TECHNICAL GRADUATESCurrent Employment Experience2007 Cohort2008 CohortGraduates’ knowledge and understanding of field of study4.35NAGraduates’ knowledge and understanding outside field of study4.26NADemonstrate qualities expected of a college graduate4.28NAGeneral skills as they relate to job requirements4.29NALevel of preparation graduates bring to the job4.25NALikelihood to hire other SPC graduates4.43NASOURCE: Technical Graduate Employer Survey, SPCInterpretation:An Employer Survey was developed and piloted in 2008-09 with 86 regional employers responding to the survey. Respondents rated their level of satisfaction with survey statements ona scale of 1 (Not at all satisfied) to 5 (Very satisfied). For all “overall satisfaction” statements,responding employers expressed above-average satisfaction with the education and trainingSPC technical graduates received. The employers of the 2008 graduate cohort have not been surveyed as of this report and data is not available. The Institutional Effectiveness Committee, onconsultation with the Instructional Council, will develop a plan to operationalize the EmployerSurvey during Year 2 of the 2009-2013 Institutional Plan. The standard is met.
12 – South Plains College2009-2010 Performance ReportMeasurement A-6: Faculty Qualifications and InstructionBenchmark and ResultsA-6.1 The college will employ full-time faculty members whose degrees are presented by regionally accredited institutions, whose educational credentials meet or exceed the SACS standards,or whose qualifications meet the standards for exceptions described in the SACS Criteria.Percentage of Faculty Meeting SACS Qualifications CriteriaData Elements2007-082008-092009-10Total Academic Faculty169165163No. Meeting SACS Criteria169165162100%100%99.4%Total Technical Faculty111113117No. Meeting SACS Criteria108108115100%97.3%98.3%% Compliance% ComplianceSOURCE: Office of Academic AffairsInterpretation:South Plains College seeks to employ full-time faculty members who meet the educationalcredentials required by SACS. Faculty who do not meet the criteria are required to demonstrateprogress toward meeting the requirements as a condition of employment. For 2009-10, 99.4% offull-time academic faculty members and 98.3% of technical faculty members met the credentialrequirements or had sufficient justifications on file to meet the SACS criteria. Those academicand technical faculty who did not meet credential requirements were seeking additional education to meet the standards. The standard is met. Instructional Deans will monitor the educational credentials of faculty members and progress made on faculty educational plans to meet theSACS criteria.Benchmark and ResultsA-6.2 The percentage of contact hours taught by full-time faculty employed at the college will exceed the average for peer institutions and the state average for public community colleges.Percentage of CONTACT HOURS Taught by Full-Time FacultyData ElementsFall 2007Fall 2008Fall 2009SPC Full-Time Faculty79.2%84.2%82.1%Peer Institutions Full-Time Faculty72.1%77.3%70.9%State Average Full-Time Faculty62.9%63.8%62.4%SOURCE: CC Accountability System, THECBInterpretation:The percentage of course sections taught by full-time faculty members is a performance measure used by the Legislative Budget Board and the Texas Higher Education Coordinating Board.The THECB measures the total number of contact hours taught by full-time faculty and reportsinstitutional, peer group and statewide data for this measure. The percentage of courses taughtby full-time faculty at SPC greatly exceeds the peer group and statewide percentages reportedby THECB. The standard is met.
2009-2010 Performance ReportSouth Plains College – 13A-6.3 The percentage of full-time faculty employed by the college will compare favorably withpeer group and the state averages for public community colleges.Percentage of FULL-TIME FACULTY EMPLOYED BY SPCData ElementsFall 2007Fall 2008Fall 2009SPC Full-Time Faculty Employed63.0%66.2%63.7%Peer Group Full-Time Faculty52.8%55.3%45.9%State Average Full-Time Faculty37.5%37.8%36.6%SOURCE: CC Accountability System, THECBInterpretation:The percentage of full-time faculty employed by the college is a measure that can be interpretedas an indicator of instructional quality. South Plains College’s ratio of full-time to part-timefaculty exceeds peer group colleges as well as the state ratio for all community colleges. Thishigh percentage demonstrates the commitment of the College’s Board of Regents to provide afull-time faculty workforce that will meet the needs of students and ensure teaching excellence.The standard is met.A-6.4 The College’s FTE student to FTE faculty ratio will compare favorably with peer group andstate averages for public community colleges.FTE Student to FTE Faculty RatioData ElementsFall 2007Fall 2008Fall 2009SPC Student/Faculty Ratio24:122:123:1Peer Group Student/Faculty Ratio20:119:122:1State Student/Faculty Ratio20:120:121:1SOURCE: CC Accountability System, THECBInterpretation:South Plains College’s full-time-equivalent student to full-time equivalent faculty ratio is higherthan peer group and state community college averages for all three reporting periods. Whilethe college’s ratio is not undesirable, it could be the result of several factors. The college hasexperienced difficulty in hiring qualified individuals to fill approved faculty positions in certaindisciplines, such as nursing. The area’s pool of qualified part-time faculty is not sufficient insome disciplines to handle overload class situations. Class seating limits have been increased insome disciplines in order to accommodate student demand for certain courses without havingto hire additional part-time faculty. Course overload policies for full-time faculty have beenadjusted to allow some faculty to teach a greater course overload, especially in online courses.The ratio is within an acceptable range of variance, so the standard is met. Instructional Deanswill continue to monitor course limits, course overloads and faculty assignments to keep the college’s student/faculty ratio as low as possible.
14 – South Plains College2009-2010 Performance ReportCSF B: Student Success OutcomesMeasurement B-1: Course CompletionBenchmark and ResultsB-1.1South Plains College will maintain a course completion rate of not more than 5 percentagepoints below peer group or state averages for community colleges.Percentage of Course CompletersData ElementsFall 2006Fall 2007Fall 2008Fall 2009SPC Course Completers84.4%85.9%88.3%NAPeer Group Course Completers84.6%85.5%87.1%NAState CC Average84.8%85.9%87.7%NASOURCE: LBB Performance Measures, CC Accountability System, THECBInterpretation:The state performance measures for two-year institutions includes the percentage of statefunded contact hours that are completed during the fall semester. Contact hours for students receiving grades of A, B, C, D and F are count as course completion. South Plains College’s coursecompletion rate has been on par with the Large College Peer Group and the state averages. Forthe most recent reporting period, the college’s rate exceeded the rate of both comparison groups.Data is not available for Fall 2009 course completion rates. The standard is met.Measurement B-2: Graduation and Persistence RatesBenchmark and ResultsB-2.1The 6-year graduation / persistence rate of first-time, full-time, credential seeking undergraduates will not be more than 5 percentage points below the peer group and statewide rates forpublic community colleges.6-YEAR Graduation / PERSISTENCE Rate for FIRST-TIME, Full-Time StudentsData ElementsFY 2005FY 2006FY 2007FY 2008Fall 1999 CohortFall 2000 CohortFall 2001 CohortFall 2002 CohortSPC Graduation/Persistence Rate39.5%38.2%41.9%39.9%Peer College Group Rate50.5%47.9%48.8%45.1%Statewide CC Rate44.0%43.7%43.1%41.5%SOURCE: CC Accountability System, THECBInterpretation:The percent of first-time, full-time credential seeking students who have graduated or who arestill enrolled in a Texas public or private institution of higher education is tracked as a performance measure by the THECB. Students who transferred to out-of-state institutions are nottracked. While SPC has improved its graduation/persistence rate and has been within 5 percentage points of the state average for the three years reported here, it has lagged behind itsLarge College Peer Group rate by a more than 5 percentage point gap. The standard is not met.
2009-2010 Performance ReportAction Plan:South Plains College – 15Improving graduation rates and student goal attainment are priority objectives in the College’sInstitutional Plan. Improvements to the advisement system and development of individual educational plans for students are being piloted as strategies to address performance in this area.A significant number of students eligible for graduation transfer from SPC without applyingfor graduation. Strategies to encourage eligible students to apply for a degree or certificate willcontinue to be developed and implemented. The Admissions and Records Office has a systemin place to contact students who are nearing completion of certificate and associate degree toencourage them to apply for graduation. Appropriate personnel, as well as the Retention Team,will continue to monitor this measure.Benchmark and ResultsB-2.2The 3, 4 and 6-year graduation rates of first-time, full-time credential seeking undergraduates will not be more than 5 percentage points below the peer group and statewide rates forpublic community colleges.3, 4, and 6-year Graduation Rates for FIRST-TIME, FULL-TIME STUDENTSStudent CohortsFY 2007FY 2008SPC RatesPeer RatesState Rates3-Year Graduation Rate (Fall 2004)11.9%10.1%11.1%4-Year Graduation Rate (Fall 2003)17.9%21.1%18.3%6-Year Graduation Rate (Fall 2001)32.4%37.5%30.8%3-Year Graduation Rate (Fall 2005)14.4%10.7%11.0%4-Year Graduation Rate (Fall 2004)16.5%16.5%17.0%6-Year Graduation Rate (Fall 2002)30.6%33.5%29.4%SOURCE: CC Accountability System, THECBInterpretation:First-time, full-time credential seeking student cohorts are tracked to degree/certificate completion at 3, 4 and 6-year intervals. SPC’s graduation rates at these points are within the acceptedrange of variance when compared to the Large College Peer Group and statewide averages forall public community colleges. The
For additional information about the institutional effectiveness program at South Plains College or to address questions, contact the Office of Institutional Advancement, South Plains College, 1401 S. Col-lege Ave., Levelland, Texas 79336. Telephone: (806) 716-2217 or (806) 716-2218.