Transcription
FINANCIAL SERVICESFor updated information, please visit www.ibef.orgJanuary 2019
Table of ContentExecutive Summary . .3Advantage India . .4Market Overview . . .6Recent Trends and Strategies. . .16Growth Drivers and Opportunities .19Key Industry Organisations. . .29Useful Information . . .31
EXECUTIVE SUMMARYGross national savingsabove 30 per cent ofGDPIndia’s HNWI populationto double by 2020 As of March 2017, India’s Gross National Savings (GNS), as a percentage of GDP, stood at 30 per cent. The number of High Net Worth Individual (HNWI) increased to 330,400 in 2017 and the population of HNWIsis expected to double by 2020. India’s HNWIs wealth is likely to expand at a CAGR of 19.7 per cent and reach around US 3 trillion by 2020. For the year 2017-18, the Assets Under Management (AUM) of the mutual fund industry stood at Rs 23.26lakh crore (US 360 billion).Robust AUM growthFundraising via IPOs onthe rise Mutual fund industry AUM recorded a CAGR (in Rs) of 15.51 per cent over FY07–18. India is considered oneof the preferred investment destinations globally. The Association of Mutual Funds in India (AMFI) istargeting nearly five fold growth in assets under management (AUM) to INR 95 lakh crore (US 1.47 trillion)and a more than three times growth in investor accounts to 130 million by 2025. The total amount of Initial Public Offerings increased to Rs 84,357 crore (US 13,089 million) by the end ofFY18. In FY19 (up to June 2018) US 1.2 billion has been raised from 37 (Initial Public Offerings) IPOs.Note: NBFC – Non-Banking Financial CompanySource: IMF, ICRA, Economic Times, Capgemini Wealth Report, Aranca Research, EY report3Financial ServicesFor updated information, please visit www.ibef.org
Financial ServicesADVANTAGE INDIA
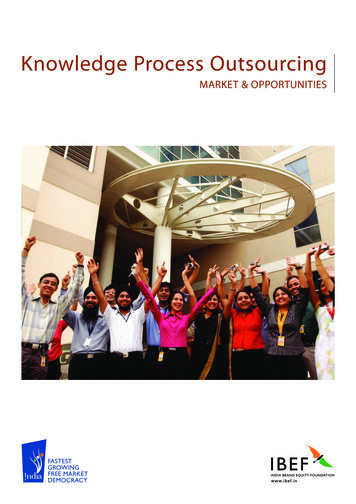
ADVANTAGE INDIA Rising incomes are driving the demand forfinancial services across income brackets. Financial inclusion drive from RBI hasexpanded the target market to semi-urban andrural areas. Investment corpus in Indian insurance sectorcan rise to US 1 trillion by 2025. India benefits from a large cross-utilisation ofchannels to expand reach of financial services. Maharashtra has launched its mobile walletfacility allowing transferring of funds from othermobile wallets. Maharashtra is the first state tolaunch it. As of October 2018, the Financial InclusionLab has selected 11 fintech innovators with aninvestment of US 9.5 million promoted by theIIM-Ahmedabad's Bharat Inclusion Initiative(BII) along with JP Morgan, Michael and SusanDell Foundation, and the Bill and MelindaGates Foundation. Government has approved new bankinglicenses and increased the FDI limit in theinsurance sector. Gold Monetization Scheme, 2015, AtalPension Scheme, Pradhan Mantri SurakshaBima Yojana, Pradhan Mantri Jeevan JyotiBima Yojana.ADVANTAGEINDIA Credit, insurance and investment penetration isrising in rural areas. HNWI participation is growing in the wealthmanagement segment. Lower mutual fund penetration of 5–6 per centreflects latent growth opportunities. The Government of India launched India PostPayments Bank (IPPB), to provide every districtwith one branch which will help increase ruralpenetration. It opened a total of 1,896,410accounts till December 24, 2018.Note: FDI – Foreign Direct Investment, IIM – Indian Institute of ManagementSource: IMF, World Bank, KPMG report “Indian Mutual Fund Industry”, Ministry of External Affairs5Financial ServicesFor updated information, please visit www.ibef.org
Financial ServicesMARKETOVERVIEW
SEGMENTS OF THE FINANCIAL SERVICES SECTORFinancial ServicesCapital marketsInsuranceNBFCsAsset Management.Life.Asset finance company.Broking.Non-life.Investment company.Wealth Management.Loan company.InvestmentBanking.Note: NBFC - Non Banking Financial CompanySource: Aranca Research7Financial ServicesFor updated information, please visit www.ibef.org
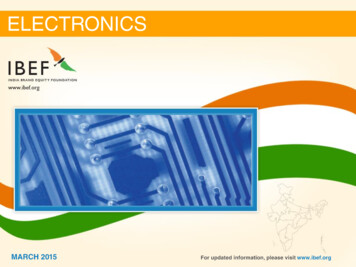
ASSETS UNDER MANAGEMENT HAVE MORE THANDOUBLED SINCE FY08 Growth in B30 (beyond top 30) cities, sustainability of alpha,alternative investments and regulation norms are expected to shapethe mutual fund industry in the coming years.300250316.84331.42CAGR (in Rs): 15.51%272.62 Equity mutual funds have registered a net inflow of Rs 812.11 billion(US 11.26 billion) in April-December 2018, thereby taking theirasset base to Rs 6.99 trillion (US 96.88 billion).350252.06 Inflows in India's mutual fund schemes via the SystematicInvestment Plan (SIP) route reached Rs 67,190 crore (US 10.43billion) during FY18 from Rs 43,921 crore (US 6.55 billion) duringFY17. During April-November 2018, Rs 604.57 billion (US 8.61billion) was collected.Mutual fundVisakhapatnamassets under portmanagement*traffic (million(AUM)tonnes)(in US billion)200179.60 As of December 2018, the Assets Under Management of the mutualfund industry stood at Rs 22.86 trillion (US 316.84 Y09FY080Note: AUM – Assets Under Management, * - as of December 2018, CAGR in Rs till FY18, Confederation of Indian Industry (CII) Mutual Fund Sector reportSource: Association of Mutual Funds - AMFI, Aranca Research8Financial ServicesFor updated information, please visit www.ibef.org
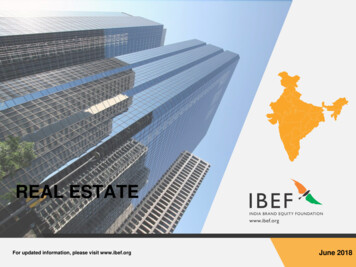
CORPORATE INVESTORS ARE BY FAR THE LARGESTINVESTOR IN MUTUAL FUNDS CATEGORYLeading AMCs in India (between July-September 2018)Top 5 AMCs in IndiaInvestor breakup as of September 2018 (US billion)AUM (US billion)5.44ICICI Prudential Asset Management Co. Ltd44.21HDFC Asset Management Co. Ltd43.651.59CorporatesHigh NetworthIndividuals*80.46127.33RetailAditya Birla Sun Life Asset Management Co. Ltd36.22SBI Funds Management Private Limited36.17Reliance Nippon Life Asset Management Ltd34.89Banks/FIs99.28FIIs In September 2018, corporate investors AUM stood at US 127.33 billion, while HNWIs and retail investors reached US 99.28 billion and US 80.46 billion, respectively. In 2017, Alternative Investment Funds (AIFs) in India doubled to 346 and raised US 5.7 billion.Note: HNWI - High Net Worth Individuals, AMC - Asset Management Company, AUM – Assets Under Management * - individuals investing 500,000 and above, data is expected to beupdated by March 2019 from quarterly reports of Association of Mutual funds IndiaSource: AMFI, Money Control, India Private Equity Report 2018 by Bain and Co9Financial ServicesFor updated information, please visit www.ibef.org
INDIAN EQUITY MARKET MEETING THE GOLBALPACE Indian stocks markets, S&P Sensex and Nifty 50, rose 10-11 per centin FY18. The number of companies listed on the NSE rose from 135 in 1995 to1,923 by the end of December 2018. ’India has scored a perfect 10 in protecting shareholders' rights on theback of reforms implemented by Securities and Exchange Board ofIndia (SEBI) in World Bank's Ease of Doing Business 2018 report.Listed companies on major stock exchanges in Asia-Pacificcountries (as of December 5000Australian SE Hong KongSEKorea SENSE India*Shanghai SENote: NSE – National Stock ExchangeSource: National Stock Exchange, SEBI10Financial ServicesFor updated information, please visit www.ibef.org
VIBRANT CAPITAL MARKET EVIDENT THROUGHLARGE NUMBER OF LISTINGSAmount raised by IPOs (US million)Companies listed on NSE and .190.47FY14FY151.200FY16FY17FY18FY19 The number of listed companies on NSE* and BSE* were 1,923 and 5,363, respectively. The total amount of Initial Public Offerings (IPO) increased to Rs 84,357 crore (US 13,089 million) by the end of 2017-18. The total number ofIPO’s reached 161 and amounted to US 5.52 billion between January-November 2018.Note: FII – Foreign Institutional Investors, NSE – National Stock Exchange, SME - Small and Medium-sized Enterprises, BSE – Bombay Stock Exchange, * - NSE as on December 2018and BSE as on August 2018, - April-June 2018, India IPO Market Insight report by EYSource: SEBI, EY, ICRA11Financial ServicesFor updated information, please visit www.ibef.org
WEALTH MANAGEMENT: AN EMERGING ,000200,000198,000 Advisory asset management and tax planning has one of the highestdemand among wealth management services by HNWIs; this isfollowed by financial planning.156,000250,000153,000High net worth households would grow at an even faster rate till2019 growing at a CAGR of about 21.5 per cent.263,000300,000125,000 VisakhapatnamNumberportof HNWIstraffic in(millionIndia tonnes)153,000 The number of HNWIs in India reached 263,000 by the end of 2017.Between 2011 and 2017, number of HNWIs in India has seen asteady rise at a CAGR of 13.52 per cent. By the end of 2025, globalHNWI wealth is estimated to grow to over US 100 trillion.2008 2009 2010 2011 2012 2013 2014 2015 2016 2017Note: HNWI – High Net Worth IndividualsSource: World Wealth Report by Capgemini, Asia Pacific Wealth Report 2018 by Capgemini12Financial ServicesFor updated information, please visit www.ibef.org
THE LIFE INSURANCE SEGMENT HAS GROWNSIGNIFICANTLY IN RECENT YEARSMajor private players in the life insurance segment (betweenApril-November 2018)Life insurance Premium (US 3100FY14FY15HDFC Standard1,213.83SBI Life1,101.2356.0640FY13Total premiums (US million)FY16FY17FY18*ICICI Prudential836.42Max Life367.11Bajaj Allianz387.45FY19 In FY18, the total first year premium of life insurance companies was valued at Rs 193,866.23 crore (US 30.10 billion). It reached Rs 1.23 trillion(US 17.53 billion) between April–November 2018. Over FY11–17, life insurance premiums witnessed growth at a CAGR of 0.24 per cent.Note: * - FY18 only includes First Year Premium of Life Insurers the data is expected to be updated by April 2019, - FY19 only includes First Year Premium of Life Insurers till November2018, CAGR till FY17Source: IRDA13Financial ServicesFor updated information, please visit www.ibef.org
NON-LIFE INSURANCE SEGMENT HAS BEEN RISINGAS WELL Non-Life insurance premiums were Rs 1.5 lakh crore (US 23.27billion) during FY18. During FY02–18, increase in non-life insurance premiums witnessedat a CAGR of 16.65 per cent . In April-October 2018, the Gross Direct Premiums reached Rs860.90 billion (US 12.27 billion), showing an year-on-year growthrate of 11.72 per cent.VisakhapatnamNon-life insuranceportpremiumstraffic (million(US e: YoY – Year on Year, * - from April–October 2018, CAGR till FY 2018Source: IRDA, General Insurance Council14Financial ServicesFor updated information, please visit www.ibef.org
NBFC: GROWING IN PROMINENCE NBFCs are rapidly gaining prominence as intermediaries in the retailfinance space NBFC’s market share in commercial loans increased to 2.8 per centin 2016-17 from 2 per cent in 2015-16*.56.104.95 The gross loans of India’s Non-Banking Finance CompanyMicrofinance Institutions (NBFC-MFIs) increased 24 per cent yearon-year in Q2 FY18 to Rs 38,288 crore (US 5.89 billion).65.65 The public deposit of NBFCs increased from US 0.29 billion inFY09 to Rs 319.05 billion (US 4.95 billion) in FY18, registering aCompound Annual Growth Rate (CAGR) of 36.86 per cent.74.31 NBFCs finance more than 80 per cent of equipment leasing and hirepurchase activities in IndiaVisakhapatnamNBFC PublicportDeposittraffic(in(millionUS billion)tonnes)431.611.060.850.610.4210.292FY09 FY10 FY11 FY12 FY13 FY14 FY15 FY16 FY17 FY18Note: NBFC - Non Banking Financial Company, FY19 update is expected to be available by October 2019, * - as per latest data availableSource: RBI, Microfinance Institutions Network (MFIN)15Financial ServicesFor updated information, please visit www.ibef.org
Financial ServicesRECENT TRENDSAND STRATEGIES
RECENT TRENDS New distribution channels such as bank assurance, online distribution and NBFCs have widened the reach andreduced operational costsInsurance Sector The life insurance sector has witnessed the launch of innovative products such as Unit Linked Insurance Plans(ULIPs) Most general insurance public companies are planning to expand beyond Indian markets, especially in SouthEast Asia and the Middle East Insurance industry in India is expected to reach US 280 billion by 2020 As the Reserve Bank of India (RBI) allows more features such as unlimited fund transfers between wallets andbank accounts, mobile wallets will become strong players in the financial ecosystem,Mobile WalletsDigital Transactions India's mobile wallet industry is estimated to grow at a compound annual growth rate (CAGR) of 148 per cent toreach US 4.4 billion by 2022. Indian companies are strengthening their footprint on foreign shores, enhancing geographical exposure. Digitaltransactions reached an all-time high of 1.11 billion in January 2018. India's digital payments are estimated toincrease to US 1 trillion by 2023, backed by global technology majors boosting infrastructure as aggregators forretail payments. India has been ranked 28th out of 73 countries in 2018, in adoption of e-payments by the government. NBFCs have served the unbanked customers by pioneering into retail asset-backed lending, lending againstsecurities and microfinance. NBFCs aspire to emerge as a one-stop shop for all financial servicesNBFCs Non-Banking Financial Companies are expected to raise their share to 19-20 per cent by 2020 throughrecapitalisation program for public sector@ New RBI guidelines on NBFCs with regard to capital requirements, provisioning norms and enhanced disclosurerequirements are expected to benefit the sector in the long runSource: Aranca Research, 'World Payment Report 2017' by Capgemini, Credit Suisse, Crisil, The Economist Intelligence Unit commissioned by payments company Visa17Financial ServicesFor updated information, please visit www.ibef.org
STRATEGIES ADOPTED In insurance industry, several new and existing players have introduced innovative insurance-based products,value add-ons and services. Few foreign companies have also entered the domain, including Tokio Marine, Aviva,Allianz, Lombard General, AMP, New York Life, Standard Life AIG and Sun Life.Innovation HDFC Capital Advisors Ltd has raised US 550 million for its second affordable housing fund, HDFC CapitalAffordable Real Estate Fund-2 (H-CARE-2), which will invest in affordable and mid-income and residentialprojects in 15 cities across India. As of December 2018, Warburg Pincus LLC acquired minority stake in Fusion Microfinance for Rs 520 crore (US 75 million).Mergers andAcquisition In October 11, 2018, MobiKwik forayed into the wealth management business with acquisition of Clearfunds. In H12018, 74 deals of acquisition took place in financial sector. The total value of such transactions was US 4.166 billion.Stepped up ITexpenditureExpandinggeographical presence The explosion of mobile phones, uptake of technologies such as cloud computing and rising pace of convergenceand interconnectivity have led companies in the financial services industry to ramp up investment in InformationTechnology (IT) to better serve their end-customers Indian companies are strengthening their footprint on foreign shores, enhancing geographical exposure.Source: Ministry of External Affairs, RBI, EY Annual Report 2018, PE Roundup – 1H2018 & Jun’18 report by EY, NBFC, Online Financial Services, Payment Solutions.18Financial ServicesFor updated information, please visit www.ibef.org
Financial ServicesGROWTHDRIVERS ANDOPPORTUNITIES
GROWTH DRIVERS IN FINANCIAL SECTOR In September 2018, SEBI asked for recommendations to strengthen rules which will enhance the overallgovernance standards for issuers, intermediaries or infrastructure providers in the financial market. In December 2018, Securities and Exchange Board of India (SEBI) proposed direct overseas listing of IndianGovernment Initiativescompanies and other regulatory changes. It has provided companies with a broader investor base, bettervaluation, increased awareness, analyst coverage and visibility. In November 2018, India's leading stock exchange BSE has created a new sub-segment within its existingsmall to medium (SME) segment to list start-up companies in India. Financial sector growth can be attributed to rise in equity markets and improvement in corporate earnings. In FY17, individual wealth in India expanded to Rs 344 lakh crore (US 5,337.47 billion) from Rs 310 lakhShift to Financial Assetclasscrore (US 4,620.66 billion) in FY16.It increased growth rate from 10.91 per cent in FY17 to 8.50 per cent inFY16. By 2022, India’s personal wealth is forecasted to reach US 5 trillion at a CAGR of 13 per cent. It stood atUS 3 trillion in 2017. As of November 2018, outlook of global brokerages Morgan Stanley and Credit Suisse are turning upbeattowards Indian equities.Others Investments by Foreign Portfolio Investors (FPIs) in Indian capital markets have reached Rs 6,310 crore(US 899.12 million) up to November 22, 2018.Note: IT – Information and TechnologySource: NSE, News articles, Microfinance Institution Network, Boston Consulting Group (BCG)20Financial ServicesFor updated information, please visit www.ibef.org
GROSS NATIONAL SAVINGS TO CONTINUE GROWINGAT A HEALTHY PACE Gross National Savings as percentage of GDP was 30.00 per cent in17.VisakhapatnamGross national savingsport trafficas per(millioncent tonnes)of 2827262011201220132014201520162017Note: F – Forecast, Deloitte Center for Financial Services, data is expected to be updated by May 2019 from CEIC dataSource: IMF, Reserve Bank of India21Financial ServicesFor updated information, please visit www.ibef.org
CONTINUED GROWTH IN EQUITIES AND INNOVATIVEPRODUCTSNumber of listed companies - NSETurnover for derivatives segment (US Y13FY149.2310.25FY15FY160FY17FY18 The Indian equity market is expanding in terms of listed companies and market cap, widening the playing field for brokerage firms. Sophisticatedproducts segment is growing rapidly, reflected in the steep rise in growth of derivatives trading. With the increasing retail penetration there is immense potential to tap the untapped market. Growing financial awareness is expected to increasethe fraction of population participating in this market. Total wealth held by individuals in unlisted equities is projected to grow at a CAGR of 19.54 per cent to reach Rs 17.64 lakh crore (US 273.69billion) by FY22. Private Equity (PE) investments grew at the rate of 36 per cent year-on-year to reach US 33.1 billion with about 720 deals in 2018 from US 24.3billion with 734 deals in 2017. The total number of companies listed on National Stock Exchange by end of December 2018 was 1,923. Turnover for derivatives segment for 2017-18 was Rs 1,649.85 lakh crore (US 25,599 billion). In October 2018, Bombay Stock Exchange (BSE) became the first Indian stock exchange to launch the commodity derivative contracts in gold andsilver.Note: * - As of December 2018Source: National Stock Exchange, Venture Intelligence Karvy India Wealth Report 2017, Private Equity Deal Tracker report by EY22Financial ServicesFor updated information, please visit www.ibef.org
RISING SCOPE FOR WEALTH MANAGEMENT India is one of the fastest growing wealth management markets in the world. The HNWI population in India is young and therefore more receptive towards sophisticated financial products. India has over 330,400 individuals with net worth of more than US 1 million with assets close to US 8,230 billion in 2017.Investor protection The regulatory environment for fiduciary duties in wealth management is evolving; players will benefit greatlyfrom quickly adopting new investor protection measures.Brand building Brand building coupled with partnership based model will improve the advisory penetration. Greater focus ontransparency will speed up the process.Innovation Investment in required technologies, imbibing state-of-the-art best practices of advisory and creatingcustomised and innovative products will enable growth.Source: Aranca Research, News Articles23Financial ServicesFor updated information, please visit www.ibef.org
HNWI POPULATION TO DOUBLE BY 2020 HNWI population in India is expected to expand rapidly over the next seven years. Total wealth holdings by HNWI in India is expected to reach US 3 trillion by 2020. In Asia-Pacific, India is among the top five countries in terms of HNWIs.High-net-worth population and wealth in IndiaYearPopulationWealth (US 0007692017263,000895Source: Deloitte Center for Financial Services, Capgemini Asia Pacific Wealth Report 201824Financial ServicesFor updated information, please visit www.ibef.org
INSURANCE TO BENEFIT FROM WIDENING REACHACROSS SEGMENTS Targeted at rural segment, potentiallyaddressing two-thirds of Indian populationpolicy incentives are driving growth. Passenger car sales in the country grew ata y-o-y of 3.33 per cent in FY18. Increasing number of insuranceregistered for passenger cars and forconstruction activities will rise with India’sinfrastructure growth plans.Insurance Only one per cent population coveredcurrently, suggesting that the vast marketis yet to be tapped. Health insuranceaccounts for 1.2 per cent of totalhealthcare spend. Demand for agricultural and livestockinsurance growing on the back of risingawareness among rural population.Note: F – Forecasts, E –Estimated, Deloitte Center for Financial ServicesSource: YoY – Year on Year25Financial ServicesFor updated information, please visit www.ibef.org
HUGE UNTAPPED POTENTIAL AT THE ‘BOTTOM OFTHE PYRAMID Two-thirds of India’s population lives in rural areas where financial services have made few inroads so far. Rural India, however, has seen steadyrise in incomes creating an increasingly significant market for financial services. There are several standalone networks of SHG, NGO’s and MFI’s in different parts of rural India. Cross-utilisation of these channels can facilitatefaster penetration of a wider suite of financial services in rural India. Increasing use of technology to reach rural India is the paradigm-shifting enabler. Internet kiosk based channels are expected to become thebridge that connects rural India to financial services.Credit Rural credit segment is a large market, which can be tapped by ensuring timely loans which are critical toagricultural sector. Self Help Groups and NGOs are useful vehicles to make inroads into rural India. Safe investment options have a potential to tap into rural household savings.Investments Some private players are coming up with innovative products like third party money market mutual funds tocater to rural investment needs. Agricultural, livestock and weather insurance are potentially large markets in rural India.Insurance Harnessing existing networks of MFIs, NGOs can speed up the process. Market size to reach US 280 billion by 2020.Note: MFI – Micro Finance Institutions; NGO – Non Governmental Organisation; SHG – Self Help GroupsSource: Aranca Research26Financial ServicesFor updated information, please visit www.ibef.org
FAVOURABLE POLICY MEASURES ANDGOVERNMENT INITIATIVES (1/2)Budgetary MeasuresGoods and ServicesTax (GST)FDI requirement forfund based and nonfund based financialentities Under the Union Budget 2018-19, the government has allocated Rs 3 trillion (US 46.34 billion) towards theMudra (Micro-Units Development & Refinance Agency Ltd) Scheme. As per the Union Budget 2018-19, the recapitalisation of PSBs is expected to allow banks to lend additional Rs 5lakh crore (US 77.23 billion). The Goods and Services Tax (GST) on financial services transactions like banking transactions, mutual funds,insurance and stock market has been increased from the current 15 per cent to 18 per cent. The Government of India is planning to introduce a two percentage point discount in the Goods and Services Tax(GST) on business-to-consumer (B2C) transactions made via digital payments. In April 2018, the Government of India issued minimum FDI capital requirement of US 20 million for unregistered/exempt financial entities engaged in ‘fund based activities’ and threshold of US 2 million for unregisteredfinancial entities engaged in ‘non-fund based activities’.Note: QFI – Qualified Foreign InvestorsSource: Dun and Bradstreet., Media articles27Financial ServicesFor updated information, please visit www.ibef.org
FAVOURABLE POLICY MEASURES ANDGOVERNMENT INITIATIVES (2/2) Insurance products are covered under the EEE (exempt, exempt, exempt) method of taxation. This translates toan effective tax benefit of approximately 30 per cent on select investments (including life insurance premiums)every financial year.Tax incentives Reduction in securities transaction tax from 0.125 per cent to 0.1 per cent on cash delivery transactions and from0.017 per cent to 0.1 per cent on equity futures. Indian tax authorities plan to sign a bilateral advance pricing agreement with a number of companies in Japan.The agreement is aimed at avoiding conflicts with multinational companies over sharing of taxes between Indiaand the countries where these firms are based. In November 2018, National Stock Exchange of India (NSE) has launched a new mobile application and webbased platform NSE goBID for retail investors to invest in government securities. In November 2018, Bombay Stock Exchange (BSE) has enabled offering live status of applications filed by listedcompanies on its online portal.Other initiatives Bombay Stock Exchange (BSE) introduced weekly futures and options contracts on Sensex 50 index fromOctober 26, 2018. The Government of India is planning to launch a global exchange traded fund (ETF) in FY20 to raise long terminvestments from overseas pension funds. Bombay Stock Exchange (BSE) and National Stock Exchange of India (NSE) attained permission from theSecurities and Exchange Board of India (SEBI), to launch commodity derivatives trading from October 1, 2018.Source: Media articles28Financial ServicesFor updated information, please visit www.ibef.org
Financial ServicesKEY INDUSTRYORGANISATIONS
INDUSTRY ORGANISATIONSInsurance Brokers Association of India (IBAI)Association of Mutual Funds in India (AMFI)Maker Bhavan No 1, 4th Floor,Sir V T Marg, Mumbai – 400 020IndiaPhone: 91 11 22846544E-mail: ibai@ibai.orgOne Indiabulls Centre,Tower 2, Wing B, 701,841 Senapati Bapat Marg,Elphinstone Road, Mumbai – 400 013IndiaPhone: 91 11 24210093 / 24210383Fax: 91 11 43346712E-mail: contact@amfiindia.comFinance Industry Development Council (FIDC)222, Ashoka Shopping Centre,II Floor, L T Road, Near G T HospitalMumbai – 400 001IndiaPhone: 91 11 2267 5500Fax: 91 11 2267 5600E-mail: info@fidcindia.com30Financial ServicesFor updated information, please visit www.ibef.org
Financial ServicesUSEFULINFORMATION
GLOSSARY AUM: Assets Under Management BSE: Bombay Stock Exchange CAGR: Compound Annual Growth Rate FII’s: Foreign Institutional Investors GDP: Gross Domestic Product HCV: Heavy Commercial Vehicle HNWIs: High-Net-Worth Individuals IRDA: Insurance Regulatory and Development Authority LIC: Life Insurance Corporation NBFCs: Non Banking Financial Company NSE: National Stock Exchange RBI: Reserve Bank of India SEBI: Securities and Exchange Board of India US : US Dollar32Financial ServicesFor updated information, please visit www.ibef.org
EXCHANGE RATESExchange Rates (Fiscal Year)Exchange Rates (Calendar Year)Year INRINR Equivalent of one US 8YearINR Equivalent of one US 767.09201461.032017-1864.45201564.15Q1 2018-1967.04Q2 2018-1970.18201667.21Q3 2018-1972.15201765.12Source: Reserve Bank of India, Average for the year33Financial ServicesFor updated information, please visit www.ibef.org
DISCLAIMERIndia Brand Equity Foundation (IBEF) engaged Aranca to prepare this presentation and the same has been prepared by Aranca in consultationwith IBEF.All rights reserved. All copyright in this presentation and related works is solely and exclusively owned by IBEF. The same may not be reproduced,wholly or in part in any material form (including photocopying or storing it in any medium by electronic means and whether or not transiently orincidentally to some other use of this presentation), modified or in any manner communicated to any third party except with the written approvalof IBEF.This presentation is for information purposes only. While due care has been taken during the compilation of this presentation to ensure that theinformation is accurate to the best of Aranca and IBEF’s knowledge and belief, the content is not to be construed in any manner whatsoever as asubstitute for professional advice.Aranca and IBEF neither recommend nor endorse any specific products or services that may have been mentioned in this presentation and nor dothey assume any liability or responsibility for the outcome of decisions taken as a result of any reliance placed on this presentation.Neither Aranca nor IBEF shall be liable for any direct or indirect damages that may arise due to any act or omission on the part of the user
Source: National Stock Exchange, SEBI . India IPO Market Insight report by EY The number of listed companies on NSE* and BSE* were 1,923 and 5,363, respectively. The total amount of Initial Public Offerings (IPO) increased to Rs 84,357 crore (US 13,089 million) by the end of 2017-18. The total number of IPO's reached 161 and amounted to US 5.52 billion between January-November 2018. 0.19 .